*e-mail: [email protected]
1. Introduction
ZnO, especially nanometer ZnO, has been the focus of much research on account of its excellent optical and electrical properties, low cost, and innocuity1,2. A large number of papers in the literature have reported on improving ZnO’s optical and electrical properties by morphological control and doping3-6. Morphology control relates to
enlarging the speciic surface area and regulating the size and the shape of ZnO particles. Doping is the introduction of another atom type into the ZnO crystals in order to increase the carrier concentration. Some researchers investigated the optical and electrical properties of ZnO by using positron annihilation spectroscopy (PAS) to detect the microstructure and defects in the crystals. For example, Sarkar et al.7
conirmed that the room temperature positron annihilation lifetime for single-crystal ZnO is 164 ps. Chakrabarti et al.8 found that a large number of vacancy defects present at the surface of nanocrystalline ZnO prepared by a chemical route. Chen et al.9 found a large number of vacancy defects in the interface region of Ni-doped ZnO nanocrystals, and that they gradually recover with an increasing annealing temperature from 700 to 1000 °C. However, in most reports, the point defects of ZnO are at equilibrium; ZnO is grown as perfectly as possible, and the point defect concentration was controlled by an annealing process. When ZnO is prepared by a non-equilibrium process, the point defect characteristics will deviate from the equilibrium state. For example, Li et al.10 reported that oxide ilms formed from
Zn ilms with a ine, porous structure deposited in Ar, had a dense structure with a large particle size, and exhibited extremely strong UV emission. Wang et al.11 reported that
the ZnO ilm obtained by the oxidation of a Zn ilm at 410 °C is more stoichiometric and less defective. Fan et al.12 found that the increase of oxidation temperature to above the melting point (419 °C) resulted in an increase in defects.
Additionally, the evaporation of Zn atoms from ZnO thin-ilms is promoted at too high a temperature (for example, 700 °C), and would decrease the concentration of interstitial zinc (Zni) defects in ZnO ilms
13.
In this paper, ZnO particles were synthesized from Zn nanoparticles by thermal oxidation in air at different temperatures. X-ray diffraction (XRD) patterns, scanning electron microscope (SEM) images, and positron annihilation spectroscopy (PAS) of ZnO were used to investigate the microstructure and the point defect characteristics.
2. Experimental
Zn nanoparticles were thermally oxidized in air for 2 hours at temperatures of 500, 600, 700, 800, and 900 °C, repectively. The Zn nanoparticles for this study were irregular polygons, with an average size of 30 nm, produced by heating bulk Zn in Ar at 15 Pa in a hybrid induction/ laser furnace. The crystalline structure of the ZnO particles was identiied by a Philips X’Pert-pro X-ray diffractometer with Cu Kα radiation (λ=1.54 Å). Their morphology was analyzed by a Hitachi S-3400 SEM. The thermogravimetry-differential scanning calorimetry (TG-DSC) curves was tested by NETZSCH STA449C Simultaneous Thermal Analyzer with 15.0 °C /min in air.
PAS was performed using a conventional fast-fast coincidence system with a temporal resolution of about 280 ps. Each spectrum was collected with 2×10⁶ total counts. The 22Na positron source was sealed between two Kapton
ilms. During the measurement, the positron source was sandwiched between two identical sample pieces. The positron annihilation lifetime in the source and Kapton ilms were determined to be 385 ps with intensity of 17.4%, and 1100 ps with intensity of 1.0%, respectively. The spectra were analyzed using an LT V9 program based on a sum of several exponential decay terms:
A Positron Annihilation Study of ZnO Prepared by Thermal
Oxidation at Different Temperatures
Yanhui Liua*, Xudong Xueb, Zhi Yana, Jianjian Shib, Lei Suna, Yichu Wub
aSchool of Materials Engineering, Shanghai University of Engineering Science,
Shanghai, 201620, China
bHubei Nuclear Solid Physics Key Laboratory, School of Physics and Technology,
Wuhan University, Wuhan 430072, China
Received: July 21, 2014; Revised: November 23, 2014
ZnO particles were prepared from Zn nanoparticles by thermal oxidation in air, over a temperature range of 500 to 900 °C. The microstructure of ZnO was investigated by SEM and XRD, showing that the thermal oxidation temperature affected the particle growth mechanism, morphology, and microstructure. Positron annihilation spectroscopy indicated that the thermal oxidation process has an important inluence on the zinc-related vacancies and their clusters in the ZnO particles.
1
(t) n iexp( )
i i i
I t
L =
=∑τ −τ (1)
The lifetime components, τ1 and τ2, and corresponding percentage intensities, I1 and I2, are resolved in the case of samples.
3. Results and Discussion
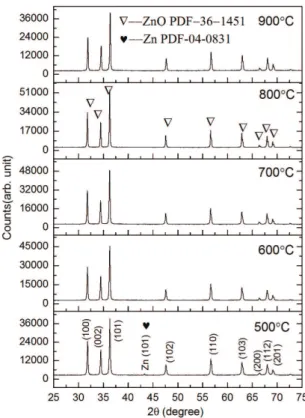
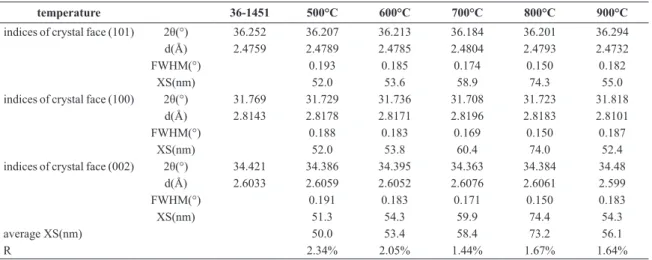
Figure 1 shows the XRD patterns of the ZnO particles obtained by the oxidation of Zn nanoparticles at temperatures of 500 to 900 °C; it can be see that the diffraction peaks in each sample match well with those of standard ZnO (P63mc, a = 3.249, c = 5.206, PDF-036-1451). The diffraction peaks at 31.769°, 34.421°, 36.252°, 47.538°, 56.602°, 62.862°, 66.378°, 67.961°, and 69.098° in the ive samples are similar to each other and correspond to the (100), (002), (101), (102), (110), (103), (200), (112), and (201) lattice planes, respectively. By comparing with the standard intensities from the PDF card, all the ZnO powders are found to have (101) as the preferred orientation direction. Note that a Zn diffraction peak (43.231°, (101) lattice plane, PDF-004-0831) is present in the XRD pattern when oxidized at 500 °C. The XRD patterns of Figure 1 were smoothed and the proile was it by MID JADE 6.5 software. The peak proile report is summarized in Table 1, where 2θ is the Bragg diffraction angle, d is the interplanar spacing, FWHM is the full-width at half-maximum, XS is the crystallite size that derived from the FWHM by the Scherrer equation at certain crystal plane, and R is the full spectrum itting error.
A good it corresponds to an R value smaller than 5%, and a smaller value indicates a better it.
Table 1 displays the effect of the thermal oxidation temperature on the ZnO microstructure of the wurtzite phase. XS increases gradually, and the average crystallite size that derived from all peaks by the Scherrer equation change from 50.0 nm to 73.2 nm, when the thermal oxidation temperature rises from 500 °C to 800 °C. Note that the average crystallite size coarsens markedly from 58.4 nm to 73.2 nm when the thermal oxidation temperature rises from 700 °C to 800 °C. However, the XS value and the average crystallite size appear unusual when the thermal oxidation temperature rise up to 900 °C.
From the thermogravimetry-differential scanning calorimetry (TG-DSC) curves of Zn powder in Figure 2, an endothermic valley stands at 414 °C between two exothermic peaks, which is about the melting point of Zn. Part of the Zn powder is oxidized and releases heat before melting, and then the endothermic valley appears as the melting Zn powder absorbs heat. The liquid Zn powder causes the oxidation rate of Zn to accelerate dramatically, and then the second exothermic peak appear. At the same time, the TG curve indicates that the Zn powder’s mass rises continuously from 350 °C to 800 °C, with a sharply rising region from 450 °C to 550 °C.
The SEM images of ZnO particles in Figure 3 show the morphological effect of the thermal oxidation temperature: when the thermal oxidation temperature rises from 500 °C to 900 °C, the morphology of the ZnO particles signiicantly, and gradually, change from rod, to merging granular, to granular. Obviously, the thermal oxidation temperature has an important effect on the growth of the ZnO particles.
According to the TG-DSC curves of Zn nanoparticles and the SEM image shown in Figure 3, it is clear that the Zn nanoparticles irstly begin to oxidize slowly, and then melted quickly. Due to the melting speed being far faster than the oxidation speed, a core (liquid Zn)–shell (solid ZnO) structure forms. And then, at higher temperatures, the ZnO shell would break and the liquid Zn would merge, even the Zn powder fast combust (800°C-900°C). Obviously, when the ZnO shell is stabilizing during thermal oxidation, the growth of ZnO was depends on the diffusion of oxygen and zinc atoms by the crystalline boundary and the bulk (as shown in Figure 4).
Figure 1. XRD patterns of ZnO powders obtained by oxidation of
Table 1. XRD diffraction proile data from the ZnO powders prepared at different thermal oxidation temperatures.
temperature 36-1451 500°C 600°C 700°C 800°C 900°C
indices of crystal face (101) 2θ(°) 36.252 36.207 36.213 36.184 36.201 36.294
d(Å) 2.4759 2.4789 2.4785 2.4804 2.4793 2.4732
FWHM(°) 0.193 0.185 0.174 0.150 0.182
XS(nm) 52.0 53.6 58.9 74.3 55.0
indices of crystal face (100) 2θ(°) 31.769 31.729 31.736 31.708 31.723 31.818
d(Å) 2.8143 2.8178 2.8171 2.8196 2.8183 2.8101
FWHM(°) 0.188 0.183 0.169 0.150 0.187
XS(nm) 52.0 53.8 60.4 74.0 52.4
indices of crystal face (002) 2θ(°) 34.421 34.386 34.395 34.363 34.384 34.48
d(Å) 2.6033 2.6059 2.6052 2.6076 2.6061 2.599
FWHM(°) 0.191 0.183 0.171 0.150 0.183
XS(nm) 51.3 54.3 59.9 74.4 54.3
average XS(nm) 50.0 53.4 58.4 73.2 56.1
R 2.34% 2.05% 1.44% 1.67% 1.64%
Figure 3. SEM micrographs of ZnO particles oxidized from Zn nanoparticles at different temperatures. (a) 500 °C, (b) 600 °C, (c) 700 °C, (d) 800 °C and (e) 900 °C.
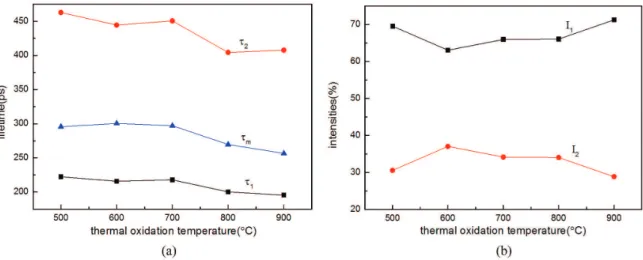
Figure 5 represents the change of the positron lifetime components and their relative intensities with thermal oxidation temperature. It has been found that zinc vacancy (VZn), their clusters or complexes, are the major trapping centers of positrons in the bulk of ZnO crystalline and the crystalline boundaries, as well as the particles surface14,15.
Furthermore, positron trapped at isolated zinc vacancies in ZnO is about 230 ps and the positron lifetime values are scattered even more than 30 ps for polycrystalline samples14-16. It means that the short lifetime component
(τ1) in Figure 5 represents the positron trapped at zinc vacancies or VZn-solute complexes in ZnO. According to the reference15, the long lifetime component (τ
2) in Figure 5 represents the positron trapped at the Zn related large volume vacancy clusters and their complexes at the bulk and the crystalline boundaries. In the present work, τ2 decreases slowly with thermal oxidation temperature, and the intensity of longer component (I2) is around 30%, which means a large number of the Zn related large volume vacancy clusters existed in the ZnO. One possibility reason is the diffusion of atoms and vacancy through the crystalline boundaries and the bulk of ZnO shell. This means that a lot of vacancies and its clusters would be residual in the ZnO. In general, the I2 decreases with increasing crystalline size, because the increasing crystalline size means the probability of positrons to be annihilated in the crystalline boundary region decrease15. However, the I
2 does not accord with above
phenomenon at 500 °C and at 900 °C due to the inluence of the growth way. A Zn diffraction peak (see Figure 1) is present in the XRD pattern of ZnO at 500 °C. It indicates that the diffusion ability of point defect is not enough to pass through the ZnO shell when the ZnO shell becomes more and more thick. As a result, the Zn related large volume vacancy clusters and their complexes decrease because the Zn atom is rich. However, the I2 is the smallest at 900 °C, the possible reason is that the fast combustion synthesis
is the main way for the ZnO growth. The fast combustion synthesis lead to that the crystalline size is ine and the role of the diffusion by the ZnO shell declines. The other possible reason is that annealing and sintering of ZnO would lead the vacancies cluster to merge or migrate into the crystalline boundary14. In fact, the mean lifetime τ
m (τm=( I1τ1+ I2τ2)/ (I1+I2) decreases with thermal oxidation temperature in Figure 5, this means that total defect concentration decreases when ZnO prepared at higher temperature.
4. Conclusion
ZnO particles were prepared from Zn nanoparticles by thermal oxidation in air at 500, 600, 700, 800, and 900 °C. The microstructure of ZnO was investigated by SEM and XRD, showing that the growth mechanism and the morphology of the particles were affected by the thermal oxidation temperature. When the thermal oxidation temperature rose from 500 to 800 °C, the average crystallite size of ZnO changed from 50.0 to 73.2 nm, according to the XRD patterns. ZnO particles oxidized at 900 °C formed from melting Zn being directly oxidized prior to agglomeration. The melting and agglomeration of Zn nanoparticles occurs prior to the growth of ZnO when the thermal oxidation temperature is 600, 700, or 800 °C. The positron lifetime characteristic in ZnO sample implies that the thermal oxidation process has an important inluence on the zinc-related vacancies and their clusters.
Acknowledgements
This work was inancially supported by “the visiting scholar” project of Shanghai Municipal Education Commission and Shanghai Education Development Foundation, and Graduate Research and Innovation Program of Shanghai University of Engineering Science (13KY0506).
References
1. Özgür Ü, Alivov YI, Liu C, Teke A, Reshchikov MA, Doğan S, et al. A comprehensive review of ZnO materials and devices.
Journal of Applied Physics. 2005; 98(4):041301. http://dx.doi. org/10.1063/1.1992666.
2. Pearton SJ, Norton DP, Ip K, Heo YW and Steiner T. Recent progress in processing and properties of ZnO. Progress in Materials Science. 2005; 50(3):293-340. http://dx.doi. org/10.1016/j.pmatsci.2004.04.001.
3. Paraguay D F, Miki-Yoshida M, Morales J, Solis J and Estrada L W. Influence of Al, In, Cu, Fe and Sn dopants on the response of thin film ZnO gas sensor to ethanol vapour. Thin Solid Films. 2000; 373(1-2):137-140. http://dx.doi.org/10.1016/ S0040-6090(00)01120-2.
4. Suwanboon S, Amornpitoksuk P and Sukolrat A. Dependence of optical properties on doping metal, crystallite size and defect concentration of M-doped ZnO nanopowders (M = Al, Mg, Ti).
Ceramics International. 2011; 37(4):1359-1365. http://dx.doi. org/10.1016/j.ceramint.2010.12.010.
5. Erkoç S and Kokten H. Structural and electronic properties of single-wall ZnO nanotubes. Physica E, Low-Dimensional Systems and Nanostructures. 2005; 28(2):162-170. http:// dx.doi.org/10.1016/j.physe.2005.03.004.
6. Zhou F, Zhao X, Zheng H, Shen T and Tang C. Synthesis and electrochemical properties of ZnO 3D nanostructures.
Chemistry Letters. 2005; 34(8):1114-1115. http://dx.doi. org/10.1246/cl.2005.1114.
7. Sarkar A, Chakrabarti M, Ray SK, Bhowmick D and Sanyal D. Positron annihilation lifetime and photoluminescence studies on single crystalline ZnO. Journal of Physics Condensed Matter. 2011; 23(15):155801. http://dx.doi.org/10.1088/0953-8984/23/15/155801. PMid:21460421
8. Chakrabarti M, Jana D and Sanyal D. Positron annihilation characterization of nanocrystalline ZnO. Vacuum. 2013; 87:16-20. http://dx.doi.org/10.1016/j.vacuum.2012.06.013.
9. Chen ZY, Chen ZQ, Zou B, Zhao XG, Tang Z and Wang SJ. Defect mediated ferromagnetism in Ni-doped ZnO nanocrystals evidenced by positron annihilation spectroscopy. Journal of Applied Physics. 2012; 112(8):083905. http://dx.doi. org/10.1063/1.4759136.
10. Li ZW, Gao W and Reeves RJ. Zinc oxide films by thermal oxidation of zinc thin films. Surface and Coatings Technology. 2005; 198(1-3):319-323. http://dx.doi.org/10.1016/j. surfcoat.2004.10.111.
11. Wang YG, Lau SP, Lee HW, Yu SF, Tay BK, Zhang XH, et al. Photoluminescence study of ZnO films prepared by thermal oxidation of Zn metallic films in air. Journal of Applied Physics. 2003; 94(1):354-358. http://dx.doi.org/10.1063/1.1577819.
12. Fan XM, Lian JS, Guo ZX, Zhao L and Jiang Q. Influence of the annealing temperature on violet emission of ZnO films obtained by oxidation of Zn film on quartz glass. Journal of Materials Science. 2006; 41(8):2237-2241. http://dx.doi. org/10.1007/s10853-006-7177-4.
13. Ye J, Gu S, Zhu S, Chen T, Liu W, Qin F, et al. Raman and photoluminescence of ZnO films deposited on Si (111) using low-pressure metalorganic chemical vapor deposition.
Journal of Vacuum Science & Technology. A, Vacuum, Surfaces, and Films. 2003; 21(4):979-982. http://dx.doi. org/10.1116/1.1580836.
14. Sharma SK, Pujari PK, Sudarshan K, Dutta D, Mahapatra M, Godbole SV, et al. Positron annihilation studies in ZnO nanoparticles. Solid State Communications. 2009; 149(13-14):550-554. http://dx.doi.org/10.1016/j.ssc.2009.01.005.
15. Chakrabarti M, Jana D and Sanyal D. Positron annihilation characterization of nanocrystalline ZnO. Vacuum. 2013; 87:16-20. http://dx.doi.org/10.1016/j.vacuum.2012.06.013.
16. Tuomisto F, Ranki V, Saarinen K and Look DC. Evidence of the Zn vacancy acting as the dominant acceptor in n-type ZnO.