ISSN 0104-6632 Printed in Brazil
www.abeq.org.br/bjche
Vol. 23, No. 02, pp. 205 - 212, April - June, 2006
Brazilian Journal
of Chemical
Engineering
EFFICIENCY OF WATER REMOVAL FROM
WATER/ETHANOL MIXTURES USING
SUPERCRITICAL CARBON DIOXIDE
M. A. Rodrigues
1, Jun Li
2, A. J. Almeida
3, H. A. Matos
1, and E. Gomes de Azevedo
1*1
Department of Chemical Engineering, Instituto Superior Técnico, Av. Rovisco Pais, 1049-001 Lisbon, Portugal.
E-mail: [email protected]
2
Department of Chemical Engineering, Xiamen University, Xiamen 361005, China.
3
Unidade de Ciências e Tecnologia Farmacêuticas, School of Pharmacy, University of Lisbon, Av. Prof. Gama Pinto,
1649-003, Lisbon, Portugal
(Received: October 20, 2004 ; Accepted: January 28, 2006)
Abstract - Techniques involving supercritical carbon dioxide have been successfully used for the formation of drug particles with controlled size distributions. However, these processes show some limitations, particularly in processing aqueous solutions. A diagram walking algorithm based on available experimental data was developed to evaluate the effect of ethanol on the efficiency of water removal processes under different process conditions. Ethanol feeding was the key parameter resulting in a tenfold increase in the efficiency of water extraction.
Keywords: Water/ethanol mixtures; Supercritical carbon dioxide.
INTRODUCTION
New processes of particle formation are becoming very attractive to the pharmaceutical industry, where inhalable drug formulations are gaining importance. With the goal on delivery of insulin via the lungs almost accomplished by some of the major pharmaceutical companies, it is expected that other formulations will follow insulin in the emerging new market of inhalable therapeutics.
To enter the blood circulation instantaneously, replacing classic intravenous administration, formulations of inhalable drugs must reach deep into the lungs, the site where these drugs act. However, lung bronchioles are difficult targets because the trough and its branches are physical barriers that can retain most of the dose of the formulation (Edwards, 2002).
Very small particles with narrow size distributions are hard to achieve with the conventional technologies, especially in the case of proteins due to their sensitivity to high temperatures, high shear stresses, and organic solvents.
Processes of particle formation by supercritical fluids are consistently providing a solution and a competitive alternative to some of the established processes. The reasons for the relative success of supercritical fluid-based techniques are their ability to produce submicron particles with efficient control over size distribution in a single-step process, their extended control over the crystalline form of the products, and their smaller environmental impact since this technology is potentially cleaner (Rodrigues et al., 2004).
critical point (7.38 MPa and 31.1ºC), low cost, and environmental acceptability. However, because most of the therapeutic compounds, especially macromolecules such as proteins or nucleic acids, are sparingly soluble in supercritical (SC) CO2 ,
antisolvent techniques such as GAS, SAS, and SEDS have the greatest potential in the pharmaceutical industry (York, 1999).
Supercritical antisolvent procedures involve drug dissolution in a liquid solvent that is further expanded by the dissolution of the supercritical phase, forcing the drug to precipitate. In most cases the choice of solvent is the critical stage in processing biological macromolecules for therapeutic purposes. Ideally this solvent should dissolve large quantities of the drug without deactivating it and should also be highly mixable with the supercritical fluid. Such solvents have yet to be found, but organic solvents such as DMSO or methylene chloride have been reported to be able to precipitate several proteins. Organic solvents, however, are potential denaturants for most therapeutic macromolecules, and as a consequence, the biological activity of the products can be severely affected. Also, with this approach a dry protein reagent is required, which means that the raw protein broth first has to be processed by other techniques, such as spray-drying or lyophillization, which consequently raises questions on the purpose and advantages of the supercritical fluid technology.
Successful formulations are therefore difficult to obtain without using water in the production process, which represents one of the major difficulties in the processing of protein molecules with supercritical-fluid technologies. The reduced solubility of water in supercritical CO2 makes antisolvent processes very
inefficient.
The intermediate solution of mixing water with ethanol in order to improve the miscibility with the SC-CO2 has been shown to be somewhat reliable for
many formulations. Many biological macromolecules are tolerant to moderate concentrations of ethanol, and small amounts of ethanol can increase the miscibility with the SC phase by several orders of magnitude, thus increasing the efficiency of the process. Ethanol also shows some advantages over other solvents: low toxicity, FDA approval, and cost. The use of water/ethanol mixtures has been reported for GAS, SAS, and SEDS. Briefly, the GAS process consists in the injection of a drug/ethanol/water solution into a precipitator vessel, and its pressurization with CO2
until drug precipitation occurs. The ethanol/water mixture is then removed by circulating fresh SC-CO2
until a dry powder is obtained. In the SAS process, an aqueous solution is sprayed continuously into a flowing SC-CO2 phase enriched with ethanol and the
particles precipitate readily as the water is dissolved in the SC phase. In SEDS the aqueous phase, the
CO2 phase, and an ethanol phase are sprayed
together through a multi-channel nozzle in such proportions that all components are miscible in the SC phase except the drug that precipitates.
Despite the intense research in this area, supercritical-fluid technology has not yet received widespread industry acceptance for processes of particle formation. To achieve an industrial scale, the effects of SCF processing of biological macromolecules on aqueous-based therapeutic species have yet to be shown and specially most of the operational parameters that determine the efficiency of the process have yet to be optimized.
The aim of this work was to evaluate the effect of the water/SC-CO2/ethanol system on the efficiency
of processes of protein micronization with supercritical CO2 from aqueous solutions. The low
productivity associated with SC fluid antisolvent processes is due to the complete removal of water from the initial aqueous solution. This difficulty constrains the (aqueous solution)/(SC phase) feed ratio to very small values, making the process very time-consuming. However this depends on the process selected, GAS, SAS, or SEDS; on the ethanol feeding; and on temperature and pressure, among other variables. An algorithm, referred to as “diagram walking”, based on data presented by Duarte et al. (2000) was developed to generate the water removal profile for the GAS process depending on the process parameters selected.
MODEL DESCRIPTION
Source of the Data
Duarte et al.(2000) compiled available VLE data for the ternary water/ethanol/CO2 system covering a
temperature range of 35ºC to 70ºC and a pressure range of 10 MPa to 18.5 MPa. Under these conditions the ternary phase diagram is of type I and, for a constant temperature and pressure, the VLE curve is represented by a continuous line and therefore can be described by a polynomial function with rectangular coordinates,
2
au bu c
2 5 C H OH
v=z sin( / 3)π ;
2 2 5
CO C H OH
u=(2z +z )cos( / 3)π ;
and a, b, and c are constants obtained by fitting the experimental data at different pressures and temperatures. Duarte et al. (2000) also found a linear relationship between the tie line-slopes (at constant temperature and pressure) and the tie-line interceptions with the VLE curve on the liquid side (uL). A linear equation is therefore suited to the
tie-line slope calculation:
0 1 L
m= +b b u +c (2)
where m is the slope, uL is the abscissa for the liquid
interception between the tie line and the VLE curve, and b0 and b1 were obtained by Duarte et al. by data fitting. Diagram Walking Algorithm
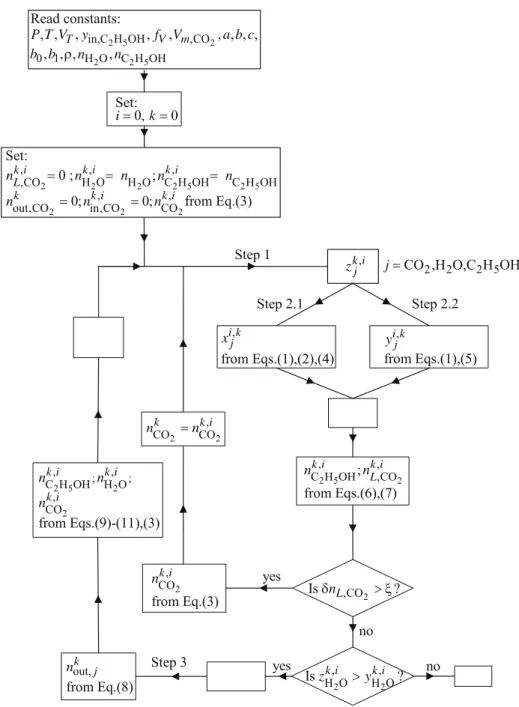
Assuming that the system is always in equilibrium (steady state), the algorithm proceeds in three steps. This three-step routine provides a path for water extraction that depends on the conditions selected. Each path can be observed if plotted in the ternary diagram, as schematically shown in Fig. 1.
Figure 1: Representation of the calculations with the diagram walking algorithm for a generic H2O/C2H5OH/CO2 vapor-liquid-equilibrium curve at fixed P and T.
Step 1: Determination of the Overall Mole Fraction (z) of Each Component
The routine starts with the calculation of the overall composition of each component (zCO2, zH2O, zC2H5OH) and of (uk,vk) in rectangular coordinates. This requires an estimation of the amount of CO2 (loop
i in Fig. 2). Because the volume of the liquid is always very small compared to the total volume, we estimate the CO2 mole number by
2 2 2 2
2
k,i k,i k,i T L k,i
CO V,CO L,CO L,CO
m,CO
V V
n n n n
V
−
= + = + (3)
In Eq. (3), nCO2, nL,CO2, and nV,CO2 are respectively the total number of moles of CO2 and
the number of moles of CO2 in the liquid and in the
vapor; VT is the total volume; VL is the total liquid
(water and ethanol) volume; and Vm,CO2 is the molar volume of CO2 at the selected pressure and
temperature. Superscript k denotes the iteration number when equilibrium has been attained. In the first iteration nL,CO2 is unknown. Therefore the iteration for obtaining the CO2 mole fraction starts
,
from Eqs.(1),(2),(4)
i k j
x ,
from Eqs.(1),(5)
i k j
y
2 2
, ,
H O H O
Is ?zk i >yk i
Step 1
Step 2.1 Step 2.2
2 5 2
2 2 5
in,C H OH ,CO
0 1 H O C H OH
Read constants:
, , , , , , , , ,
, , , ,
T V m
P T V y f V a b c
b b ρn n
, k i j
z
2
,CO
Is ?δnL > ξ
no Set:
0, 0
i= k=
2 2 2 2 5 2 5
2 2 2
, , ,
,CO H O H O C H OH C H OH
, ,
out,CO in,CO CO
Set:
0 ; ;
0; 0; from Eq.(3)
k i k i k i
L
k k i k i
n n n n n
n n n
= = =
= =
2 2 2 5
CO ,H O,C H OH
j=
out, from Eq.(8)
k j
n
2 5 2
, ,
C H OH; ,CO from Eqs.(6),(7)
k i k i L
n n
2 5 2
2
, ,
; ;
C H OH H O ,
CO
from Eqs.(9)-(11),(3)
k i k i
k i
n n
n
yes
no
Step 3 yes
2
, CO from Eq.(3)
k i
n
2 2
,
CO CO
k k i
n =n
Figure 2: Schematic representation of the diagram walking algorithm. Superscript k is the iteration number when equilibrium has been attained.
Step 2: Calculation of the Tie Line, VLE Curve Interceptions, and Mole Fractions
For clarification we separate the calculation of the tie line and of the VLE curve interceptions into two further steps.
Step 2.1
Because (uk,vk) are already known from step 1, the liquid-side interception (uL,vL) is determined by solving Eqs. (1), (2), and (4) for uL, vL and for the tie-line slope m:
L k
L k
m
u u
ν − ν =
−
(4)
The smallest solution is chosen as uL.
Step 2.2
mu d
ν = + (5)
Recalculation of the Ethanol Added
Because the ethanol added (
2 5
in,C H OH
n )
depends on the CO2 intake, it must be recalculated
for the
2
CO
n obtained in each iteration i by using
Eqs. (6) and (7):
2 2
2 2
k,i k,i k 1 k
CO out,CO
in,CO CO
n =n −n − +n (6)
2 5 2
2 5
2 5 k,i 1
in,C H OH in,CO
k,i in,C H OH
in,C H OH
n y
n
1 y − ×
=
− (7)
where
2
in,CO
n and
2
out,CO
n are respectively the
mole numbers of CO2 that entered and left the system.
We assume that the ethanol vapor composition (
2 5
in,C H OH
y ) in the vapor feed is constant.
Step 3: Removal of a Small Part of the Vapor
A small fraction (fV) of the vapor is removed and
replaced by fresh CO2 and ethanol. For each
component the moles extracted are calculated from
k k 1,i i 1
out,j V V j
n =n − × ×f y− (8)
where subscript j refers to each component (j = H2O
or C2H5OH or CO2).
The next operating line is determined from Eqs. (9) and (11); however this requires estimation of the ethanol added to the system with Eq. (10):
2
2 2
k,i k 1,i k
out,H O
H O H O
n =n − −n (9)
2 5 2 5
k,i k 1,i
V in,C H OH
in,C H OH V
n =n − × ×f y (10)
2 5
2 5 2 5 2 5
k,i k 1,i k k,i
out,C H OH
C H OH C H OH in,C H OH
n =n − −n +n (11)
The correct amount of ethanol will be determined only after the second step of the next iteration because it depends on the total amount of CO2.
EXPERIMENTAL
To evaluate the experimental reproducibility and usefulness of the diagram walking algorithm predictions, a GAS apparatus was used to obtain experimental data. Each experimental run starts by injecting an ethanol/water solution of known composition into a 460 cm3 high-pressure visual cell, placed inside a temperature-controlled air box, as schematically shown in Fig. 3.
The cell is then pressurized with CO2 (99.998%
pure, supplied by Ar Líquido, Portugal) using a motor-driven gas compressor (Newport Scientific, model 46-13421-2). The gas circulates first through a temperature-controlled cylinder for temperature equilibration. The working pressure is controlled by a back-pressure regulator (Tescom, model 26-1722-24). When the working pressure is reached, the back-pressure regulator opens and the liquid is extracted by the circulating CO2. The total amount of CO2
consumed is calculated based on flow meter readings (Omega, model FLR 1000). Extraction is stopped when only one phase is observed inside the cell. All the extraction runs were carried out at 10 MPa and 40ºC with CO2 flow rates from 3 to 7 g min-1.
RESULTS AND DISCUSSION
The Effect of Ethanol Fraction on Extraction Efficiency
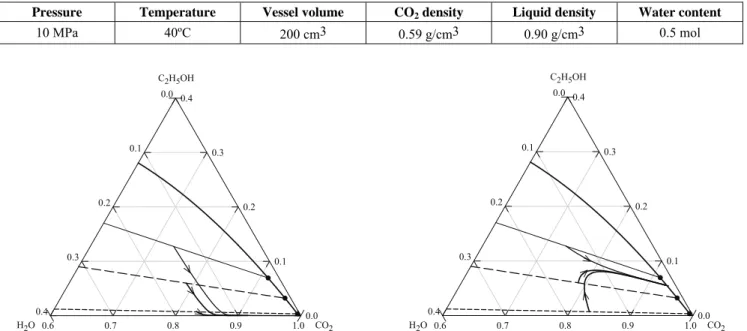
Several extraction pathways were obtained with the diagram walking algorithm for different initial mass fractions of ethanol and different ethanol feeds. In Table 1 the variables that were kept constant are shown. In Fig. 4 the higher selectivity of the CO2 for
ethanol in the ternary system can be seen. It is evident that without ethanol feed the increase in extraction produced by the ethanol initial fraction ends rapidly and the system tends towards a binary CO2/water
behavior. It can also be observed that the efficiency of complete water removal is little affected by initial ethanol content. Efficiency is defined here as the moles of water removed per mole of CO2 consumed.
As Table 2 shows, a 35% increase in efficiency is achieved only for ethanol mass fractions greater than 0.7; however, these high-ethanol contents are frequently unsuited for the processing of biological molecules and in most cases the advantages of adding ethanol to the liquid feed do not compensate the advantages of using ethanol-free solutions.
Table 2 shows that 5% (mass) ethanol in the CO2
feed increases the extraction efficiency by over 500%, revealing that this is the key parameter for successful water removal. An important drawback may however result from the ethanol feed; the ethanol content in the liquid fraction increases during extraction and may reach values unsuitable for successful formulations. Stability of the active molecules in the ternary liquid mixture is therefore the limiting parameter for ethanol feed and consequently for extraction efficiency.
Table 1: Fixed variables.
Pressure Temperature Vessel volume CO2 density Liquid density Water content
10 MPa 40ºC 200 cm3 0.59 g/cm3 0.90 g/cm3 0.5 mol
CO2
0.6 0.7 0.8 0.9 1.0
C2H5OH
0.0 0.1 0.2 0.3 0.4
H2O
0.0
0.1
0.2
0.3
0.4
0.6 0.7 0.8 0.9 1.0 CO2
C2H5OH
0.0 0.1 0.2 0.3 0.4
H2O
0.0
0.1
0.2
0.3
0.4
Figure 4: Extraction pathways generated by the diagram walking algorithm for solutions with different initial ethanol mass fractions (0.7: ⎯, 0.5: −−; 0.1: - - -) without ethanol feed (left) and with
ethanol feed (right). The straight lines are the initial tie lines generated for each mixture.
Table 2: Comparison of efficiencies of water extraction from solutions with different initial ethanol mass fractions using a CO2 feed with or without ethanol at 10 MPa and 40ºC.
Without ethanol in CO2 feed With 5% ethanol in CO2 feed
Ethanol mass fraction
Efficiency×103 mol water/mol CO2
Increase in efficiency (%)
Efficiency×103 mol water/mol CO2
Overall increase in efficiency (%)
0 2.7 - 13.9 414
0.1 3.0 2 14.0 419
0.3 3.1 15 14.4 433
0.5 3.2 20 15.2 461
The Effect of P and T on the Extraction of Water with Ethanol-Saturated CO2
As described in Table 3, pressure and temperature have a significant effect on process efficiency. Depending on the initial ethanol content, an increase of 4 MPa (or of 20ºC) results in efficiencies that are 20-30% higher or even much higher with a simultaneous increase in both pressure and temperature.
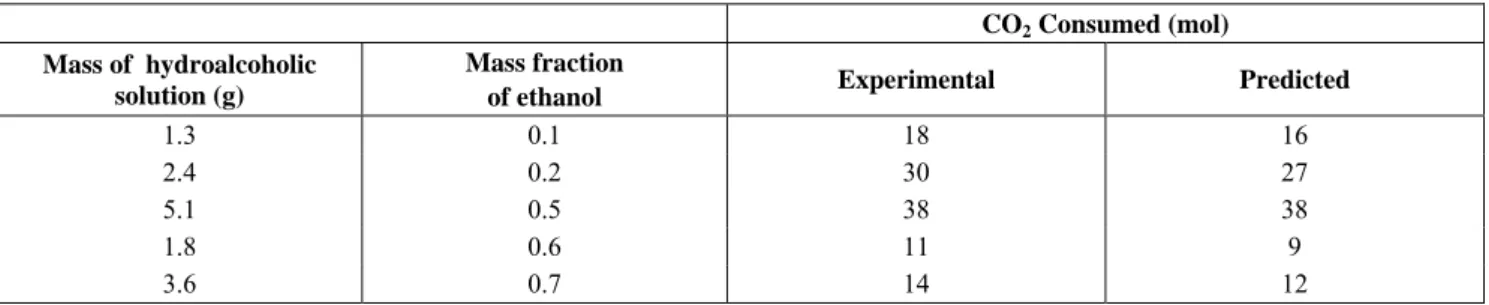
Experimental Reproducibility of the Algorithm
Table 4 compares the efficiencies of water extraction obtained experimentally (at 10 MPa and 40ºC) with those predicted by the diagram walking algorithm. There is good agreement between the experimental and predicted values, with a deviation not larger than 10%. Moreover, we found that this agreement was slightly sensitive to changes in the solution mass or in the initial mass fraction of ethanol.
Table 3: Comparison of efficiencies of water extraction from solutions with different initial ethanol mass fractions at different temperatures and pressures using a CO2 feed with 5% ethanol.
Table 4: Comparison of efficiencies of water extraction obtained experimentally (at 10 MPa, 40ºC) with those predicted with the diagram walking algorithm.
CONCLUSIONS
A diagram walking algorithm based on available experimental data was developed to evaluate the effect of ethanol on the efficiency of water extraction under different process conditions in supercritical fluid-based techniques. Ethanol feed was the key parameter for increasing water extraction. The combination of the use of ethanol feed with an increase of 4 MPa and 20ºC increased extraction efficiency tenfold, revealing that water extraction limitations in supercritical antisolvent processes can be overcome with the use of a third component such as ethanol.
Comparison with experimental results showed that the diagram walking algorithm presented here is a reliable tool for evaluation of the effect of ethanol
on the efficiency of water removal with supercritical CO2.
Further work is being carried out for a complete integration of the phase equilibria for the ternary
water/ethanol/CO2 system with the algorithm
presented here. Together they will allow a more general approach because this technique can then be applied at any pressure and temperature.
ACKNOWLEDGMENTS
Financial support from FCT, Lisbon (Projects POCTI//EQU/34961/1999, POCI/EQU/55911/2004, and postdoctoral grant BPD/5526/2001) and the European Union Programme FEDER is gratefully acknowledged.
10 MPa, 40ºC 14 MPa, 40ºC 14 MPa, 60ºC
Ethanol mass fraction
Efficiency×103 mol water/mol CO2
Efficiency×103 mol water/mol CO2
Increase in efficiency at 40ºC (%)
Efficiency×103 mol water/mol CO2
Increase in efficiency at 14 MPa (%)
0 13.9 18.8 35 21.7 16
0.1 14.0 18.9 35 22.0 17
0.3 14.4 19.3 34 22.7 17
0.5 15.2 19.9 31 24.2 21
0.7 17.5 22.6 29 28.7 27
CO2 Consumed (mol)
Mass of hydroalcoholic solution (g)
Mass fraction
of ethanol Experimental Predicted
1.3 0.1 18 16 2.4 0.2 30 27 5.1 0.5 38 38
1.8 0.6 11 9
REFERENCES
Duarte, C., Aguiar-Ricardo, A., Ribeiro, N., Casimiro, T., and Nunes da Ponte, M. N., Correlation of Vapor-Liquid Equilibrium for Carbon Dioxide+Ethanol+Water at Temperatures from 35 to 70ºC. Separation Science and Technology, 35, 2187 (2000).
Edwards, D. A., Delivery of Biological Agents by Aerosols. AIChE Journal, 48, 2 (2002).
Rodrigues, M. A., Peiriço, N. M., Matos, H. A., Gomes de Azevedo, E., Lobato, M. R., and Almeida, A., Microcomposites Theophylline/Hydrogenated Palm Oil from a PGSS Process for Controlled Drug Delivery Systems. J. Supercritical Fluids, 29, 181 (2004).