*e-mail: [email protected]
Computer Simulation of the Mechanism for the Synthesis of Carbonado Diamond
João José de Assis Rangela*, Ruben Rosenthalb,
Guerold Sergueevitch Bobrovnitchiib, Sergio Neves Monteirob
a
Candido Mendes University, UCAM, Campos, NPDI, Rua Anita Pessanha, 100,
28040-320 Campos dos Goytacazes - RJ, Brazil
b
Laboratory for Advanced Materials – LAMAV,
State University of the Northern Rio de Janeiro – UENF,
Av. Alberto Lamego 2000, 28015-620 Campos dos Goytacazes - RJ, Brazil
Received: June 28, 2006; Revised: December 8, 2006
The synthesis mechanism associated with the formation of carbonado type polycrystalline diamond has been analyzed. This analysis was performed by computer simulation of the field of temperature developed at the moment of graphite transformation into polycrystalline diamond. It was found that during the synthesis of this carbonado diamond, a strong non-steady thermal condition occurs, leading to changes in the thermodynamic equilibrium. As a consequence, a region comprising non-transformed graphite and carbonado with different characteristics is established. An experimental comparison was carried out between the carbonado hardness profile and the field of temperatures. The results show that the higher the temperature attained at local points inside the high-pressure chamber, the higher the hardness of the diamond. The simulation and experimental results indicated that concurrent mechanisms are acting during the carbonado synthesis.
Keywords: computer simulation, carbonado, polycrystalline diamond, field of temperature
1. Introduction
Diamond is known as the material with highest hardness in addition to other special properties such as very high thermal conductivity and electric resistivity1. Owing to characteristics related to size, morphology and inclusions, as well as micro structural defects, such as flaws and grain boundaries, different types of diamond are recognized for both, the naturally occurring and the synthetically produced types2. For gemstone quality, natural large and flawless single crystals with specific lapidated morphology are of paramount importance. However, for industrial ap-plications such as in drilling, cutting and polishing, the strength and hardness are the basic requirements. For this reason most synthetic dia-monds are produced with a smaller size, in the form of dust or powder, since the strength decreases with increasing crystalline size3.
Polycrystalline diamonds may not be of interest for jewellery, due to grain boundaries that impair the transparency, but they do present practical advantages regarding the above-mentioned industrial appli-cations. In nature, polycrystalline diamonds are found mostly in Brazil and South Africa with specific denominations such as framesite, ballas and carbonado4. Carbonado type synthetic polycrystalline diamond (CSPD) is also produced at high pressure and high temperature (HPHT) conditions in the presence of a metallic alloy molten catalyst5. Some relevant differences apparently exist between the SCPD and the conventional crystalline synthetic diamonds. Metallic inclusions with totaling up to 10% in weight tend to segregate to the grain boundaries of the SCPD, which reduces its thermal stability. Moreover stronger non-equilibrium conditions are also believed to be responsible for the carbonado structure formation6.
The graphite to diamond, G → D, transformation mechanism is a very peculiar one for the CSPD. While conventional crystalline synthetic diamonds are nucleated from carbon dissolved in the molten alloy, the CSPD results in a bulk martensitic transformation of the graphite7. As the catalyst alloy melts, the high pressure applied to the system permits metallic liquid penetration through the graphite pores.
This promotes the G → CSPD by means of a solid-state martensitic reaction, which takes place within the penetrated graphite volume. For this reaction to occur, the HPHT conditions must be away from the line of graphite/diamond thermodynamic equilibrium to allow a higher Gibbs free energy8. The P, T and t parameters at which this phenomenon has been observed are: 6.5 to 8.5 GPa, 1500 to 1800 °C for processing times of the order of 5 to 10 seconds9,10.
In the present work a mathematical model based on the finite differ-ence technique was created to allow a computer simulation of the tem-perature distribution during transformation of a CSPD. In the model, the temperature is determined by means of the heat generated by the flow of an electric current established inside the High Pressure Reaction Chamber (HPRC). The simulation results permitted the determination of the field of temperatures (FT) associated with all temperatures inside the HPRC at the moment of the G → CSPD transformation. Actually, the FT is associated with the temperature distribution occurring dur-ing the synthesis process. This is entirely different from the profile of temperatures derived by common models that consider any given instant of the process under equilibrium conditions11,12.
One specific advantage of the model is that the influence on the heat generated by the electric current in the different component materials, including the transformed diamond, is taken into account. The model also considers the exothermic effect resulting from the G → CSPD phase transformation as well as the penetration of molten metal in the graphite pores.
2. Mapping of Temperatures
For the evaluation of the temperature distribution, the computer simulation considered the change in the applied voltage for the heating process inside the HPRC and a graphite pore radius R = 10-5 mm.
Other parameters selected for the simulation were a G → CSPD transformation yield (percentage of converted carbonado) equal to 70% and a processing time of 5 seconds, which corresponds to a common industrial synthesis operation5.
Figure 2 shows one simulation result presenting the temperature distribution in the reactive cell, (sector D in Figure 1) where the G →CSPD transformation occurred. As shown in Figure 2, the body of the transformed CSPD, represented by the upper gray shaded area, occupies about 70% of the cell. Temperature values determined by the simulation are displayed in tones of gray; the higher the tempera-ture the darker the tone. The temperatempera-ture distribution in Figure 2, suggests the existence of three distinct regions at the moment of the phase transformation. Region , in the core of the reactive cell, with an approximately spherical shape, corresponds to the interior of the transformed CSPD. Temperatures in this region are relatively lower and vary from 1400 °C to 1600 °C. Region , in darker tones, concentric with the first region and corresponding to a middle zone of the CSPD. This region is associated with higher temperatures, 1800 °C to 2000 °C. Region , in lighter gray tones, also concentric with the other two regions, corresponding to the external zone of the CSPD formed at lower temperatures, 1600 °C to 1400 °C, which are comparable with those in Region .
The results shown in Figure 2 indicate that different zones of the CSPD body are formed at different temperatures or thermo-dynamic conditions. As a consequence, different morphological structures and properties could be expected at different parts of the CSPD body. This result was also found by Ekimov et al.6 investigat-ing the synthesis of carbonado-like polycrystalline diamond in the B4C-graphite system.
By comparing the profiles of transformation temperatures Semi-onova-Tian-Chansckaia and Ovchinnikov11 found a direct association with the corresponding diamond hardness. The part of the diamond body formed at higher temperatures, region in Figure 2, displays correspondently higher hardness values, whereas diamond parts with lower hardness, regions and are associated with lower temperatures.
3. Analysis of the Temperature Variation in the
Synthesis of CSPD
As already mentioned, the heating during the synthesis process is achieved using electricity. However, during the G → CSPD transfor-mation an exothermic effect also occurs, which generates additional heat for the process. Therefore, two simultaneously operating heat sources promote a significant variation in the reactive zone tempera-tures, which results in the FT profile shown in Figure 2. As a conse-quence, the variation in temperature at the moment of transformation may reach 600 °C, under proper thermodynamic conditions.
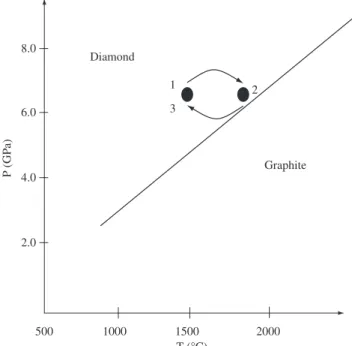
Figure 3 shows the pressure-temperature equilibrium diagram for carbon, limited to conditions of industrial interest for G → CSPD transformation. Points 1 and 2 in Figure 3 correspond to the thermo-dynamic parameters associated with the three distinct CSPD regions identified in Figure 2. The significant variation in temperature that exists in region as compared with and may be explained as follows.
At the beginning of the process, after the appropriate pressure has been applied, the temperature in the system is raised to point 1 by simple electrical heating. Point 1 is not only above the equilibrium line, Figure 3, corresponding to diamond stability, but also above the melting temperature for the catalyst metal. Consequently molten metal begins to penetrate the graphite pores and to promote the bulk
C
D E B
A A
Figure 1. High-pressure chamber. (A- matrix, B-gasket, C- catalyst metal, D- graphite reactive cell and E- graphite heating sleeve). Due to the cylindrical symmetry, only the left part of the chamber is shown.
A
A
C
D E
1
2
3 1400 °C
1600 °C 1800 °C 2000 °C
G → CSPD transformation5. As this transformation occurs, exother-mic heat from the phase reaction itself is added to the electrical heat, and the temperature therefore increases to that at point 2.
This continuous formation of CSPD at an increasing temperature corresponds to the evolution from region to in Figure 2, which is associated with a diamond body being synthesized from 1400 °C to 2000 °C. By the time point 2 is reached, 50% of CSPD is already transformed. The replacement of half of the conducting graphite in the chamber by the insulating diamond body poses a limitation to the electrical current. The heat generated is decreased and the temperature drops to that corresponding to point 1, in Figure 3. The process is then completed and another layer with 20% of diamond, region in Figure 2, is incorporated to the CSPD body.
4. Analysis of the Formation Mechanism of the
CSPD
In order to investigate the practical consequences of the field of temperature predicted by computer simulation, several CSPD samples were experimentally produced in a toroidal anvil high-pressure cham-ber with a 13.5 mm central concavity. The pressure of 6.5 ± 0.1 GPa was provided by a 1000 ton model D0040 RYAZANTIASMASS Russian press equipment. The operational FT was established after applying 1.8 V for 5 seconds. The experimental values of temperature were determined with a precision of ± 50 °C.
One of the CSPD samples was longitudinally ruptured to allow a direct comparison with the simulated section shown in Figure 2. The ruptured sample surface was etched with nitric acid to dissolve the local metallic phase characteristic of the CSPD structure. This surface was then metallized with gold and observed by scanning electron microscopy, SEM, in a model 962 Zeiss equipment. Exam-ples of the typical fracture structure observed for each region of the FT are now presented.
Figure 4 illustrates the fractured surface observed by SEM at the two typical regions corresponding to the schematic longitudinal section of the CSPD in Figure 2. It should be noticed that Figure 4b,
associated with region , closer to the equilibrium line (Figure 3), displays a more faceted structure with evidence of cubic crystals. By contrast, Figure 4a, region , which is relatively far from the equilibrium line, show a rougher structure with fewer facets and crystal-like elements. Some plate or layer features are also shown in Figure 4c.
The diamond crystal shown in Figure 4b displays similar mor-phological characteristics as those synthesized in B4C-C system by Ekimov et al.6.
5. Discussion
The results obtained in the present work regarding the influence of the field of temperatures FT developed inside a high-pressure reaction chamber, HPRC, on the formation of carbonado diamonds, permitted the explanation of the non-uniform distribution of hardness.
The existence of a hardness profile in the CSPD was reported by Semionova-Tian-Chansckaia and Ovchinnikov13, however they did not present a clear explanation for this feature. Actually they simply proposed that a possible temperature gradient inside the HPRC could be responsible for the different values of hardness found throughout the CSPD.
The computer simulation carried out in the present work pro-vided evidence that the non-uniform distribution of hardness is not a consequence of a simple temperature gradient, as suggested13. As a matter of fact, the FT obtained by the present computer modeling is not in agreement with a continuous gradient.
As shown in Figure 2, one can consider the existence of two distinct regions in the CSPD due to its formation involving different thermodynamic conditions. This was verified in terms of the corre-sponding transformation temperatures, given by the computer model for the FT, for each of the three regions. It was actually found that two regions, and , were formed at the same interval of tempera-tures, 1400 to 1600 °C. These two regions are physically separated, Figure 2, by another region , formed at higher temperatures of 1800 to 2000 °C. Consequently, the external parts of the CSPD body are made of diamond grains formed at lower temperatures whereas its interior is made of higher temperature diamond grains.
The morphological analysis revealed that the lower temperature regions, Figure 4a-c, present the typical CSPD rough and layered structure characteristic of the graphite from which it was formed. On the contrary, the intermediate region displayed facetted and crystal structures that are not typical of a CSPD. In fact, these features, some with sizes up to 40 µm, are more like to be found in single crystal-line diamonds.
The association between the values of microhardness obtained in a CSPD cross section by Seminova-Tian-Chansckaia and Ovchinnikov13 and the temperatures at the moment of its formation, Figure 2, has shown that regions and have lower microhardness as compared to region . In other words, that part of the CSPD transformed at higher temperatures presents relatively higher values of microhard-ness. It is then possible to infer that the non-uniform distribution of microhardness is a consequence of the different characteristics developed in distinct parts of CSPD body due to the FT. For instance, region with apparently more perfect diamond crystals, Figure 4b, presents a comparatively higher microhardness.
Combined with these experimental results, the computer model for the FT explains the non-uniform values of microhardness through-out the CSPD. In principle, by controlling the temperature distribution inside the HPRC, the model could be used to improve the mechanical strength and to make the microhardness more uniform.
Another point revealed by the experimental results in the present work is a rather complex transformation associated with the CSPD.
P (GP a) T (°C) 2000 1500 1000 500 2.0 4.0 6.0 8.0 Diamond Graphite 1 2 3
The fact that single crystalline diamonds with relatively larger sizes (40 µm) were found in the middle of the CSPD body, indicates a possible mechanism other than that of the martensitic transformation. Since the literature on CSPD is restricted to a martensitic mechanism5, the experimental results of this work display a complex situation, which is worth discussing.
As shown in Figure 3, the process parameters related to the intermediate region are closer to the G ↔ D thermodynamic equilibrium line. In practice, graphite under P and T conditions near
the equilibrium line in the carbon phase diagram usually transform into single crystalline diamond5,7. In this case, the transformation involves diffusion assisted nucleation of diamond by carbon solution in the molten catalyst alloy, which is different from the martensite assisted CSPD transformation9,10. Therefore, besides the non-uniform microhardness distribution, the present work has shown evidence of non-uniform CSPD morphology probably associated with different transformation mechanisms.
Figure 4. Typical SEM micrographic aspects of: a) region ; b) region ; c) region of the CSPD.
3 2 1
x1000 20 Mm 20 kV 9 mm
#101187 A3P1-1
x1000 20 Mm 24 kV 9 mm
#101187 A3P4
x1000 20 Mm 23 kV 11 mm
6. Conclusions
A computer simulation of the field of temperature developed at the moment of graphite transformation into carbonado type synthetic polycrystalline diamond, inside an anvil with central concavity high pressure reaction chamber, has displayed non-uniform characteris-tics.
The reason for this complex non-uniformity is caused by the FT developed at the moment of transformation. This results in different transformation mechanisms that affect the morphology and influence the mechanical properties.
The general analysis of the results obtained in the present work has displayed, for the first time, the possible existence of concur-rent mechanisms during the CSPD synthesis. This motivates further discussions concerning the theories presented so far to explain the formation of this type of diamond.
Acknowledgments
The authors thank the support for this investigation provided by the Brazilian agencies; CNPq, CAPES, FAPERJ and FENORTE. Special thanks are due to Dr. Andrei Pontemkin for supplying the diamond samples.
References
1. Howes VR. Physical Properties of Diamonds. ed. R. Berman, Clarendon Press, Oxford, United Kingdom; 1965. p. 174-183.
2. Field JE. The Properties of Diamond, Academic Press, London, United Kingdom; 1979. 281p.
3. Skury ALD, Bobrovnitchii GS, Monteiro SN, A Parametric Relationship for Synthesized Diamond Powder. Diamond and Related Materials. 2006; 15(1):61-66.
4. Jeynes C. Natural polycrystalline diamond. Industrial Diamond Review. 1978; 1:14-23.
5. Poliakov VP, Nozhkina AV, Chirikov NV. Diamonds and Superhard Materials, ed. 1, Metallurgy (in Russian), Moscow; 1990. 325p.
6. Ekimov EA, Sidorov VA, Sadykov RA, Mel’nik NN, Gierlotka S, Presz A. Synthesis of Carbonado-Like Polycrystalline Diamond in the B4
C–Graph-ite System. Diamond and Related Materials. 2005; 14(3-7):437-440; 2005.
7. Elyutin VP, Poliakov VP, Fedoseev DV, Loladze NT. Effect of Amorphous Carbon on the Nucleation and Growth of Diamond Crystals. Sov. Phys. Dokl. 1987; 32(12):1013-1014.
8. Tetsuo I, Kurio A, Sakamoto S, Inoue T, Sumiya H, Funakoshi K. Forma-tion of pure polycrystalline diamond by direct conversion of graphite at high pressure and high temperature. Physics of the Earth and Planetary Interiors. 2004; 143-144:593-600.
9. Eliutin AV, Laptev AI, Manukhin AV. “Synthesis of Carbonado Polycrys-talline Diamonds from Pyrographite”. Report from the Russian Academy of Science. 2001; 378(6):1-6.
10. Koltchemanov NA, Nozhkina AV, Laptev AI, Koltchemanov DN. Kinetiks of polycrystalline diamond formation. Journal of Superhard Materials. 2003; 25(2):26-32, 2003.
11. Novikov NV, Levitas VI, Leshchuk AA. Numerical Simulation of Material Stability Zones in the Working Volumes of High Pressure Equipment,
Journal of Superhard Materials. 1984; 6(4):3-8.
12. Levitas VI, Idesman AV, Leshchuk AA, Polotnyak SB. Numerical mod-eling of thermomechanical processes in high pressure apparatus applied for superhard materials synthesis. In: Naukova Dumka, Kiev ed. High Pressure Science and Technology: Proc. Xith AIRAPT Int. Conf. 1989; 4:38-40.