http://dx.doi.org/10.1590/0104-530X1567-13
Resumo: Num período de mudanças climáticas e restrições a emissões cada vez maiores, é importante focar o desenvolvimento das nações na direção de uma economia de baixo carbono. Neste contexto, o crescimento do consumo de energia tornou-se um problema grave; logo, medidas que garantam a eiciência energética tornaram-se prioritárias para qualquer nação que esteja disposta a desenvolver sua economia. Considerando que o grupo do BRICS tem apresentado rápido desenvolvimento econômico e desempenhado importante papel na economia mundial, este trabalho teve como principal objetivo medir e analisar a eiciência energética total de fatores nos países que compõem o BRICS (Brasil, Rússia, Índia, China e África do Sul), propiciando informações sobre países benchmark dentro desse grupo e sobre como o Brasil se encontra nesse cenário. Para isso, foi utilizada a Análise (DEA), modelo SBM variante e análise de janela, e, a partir das folgas fornecidas por esta ferramenta, foi calculado o índice de eiciência energética total de fatores (EETF) para os países analisados. Como inputs foram utilizados a formação bruta de capital ixo, trabalho e consumo energético e como outputs, a emissão de CO2 (output indesejável) e o Produto Interno Bruto – PIB (output desejável). A partir dos resultados, observou-se que o Brasil é o país com melhor índice de EETF dentro do BRICS, seguido por África do Sul, China, Índia e Rússia.
Palavras-chave: DEA; BRICS; Eiciência energética total de fatores.
Abstract: In a period of climate change and increased restriction of emissions, it is pivotal to focus on the development of countries towards an economy revolved on low carbon dioxide levels. The increase of energy consumption has become a serious problem; consequently, measures to ensure energy eficiency became a priority for any nation willing to develop their economy. Whereas the BRICS group has shown rapid economic development and played an important role in the world economy, this work aimed to measure and analyze total factor energy eficiency in BRICS countries (Brazil, Russia, India, China and South Africa), providing information on benchmark countries within this group and on how Brazil is situated in this scenario. To this end, Data Envelopment Analysis (DEA), Slack-based Measure (SBM) and variant analysis window were used; from the slacks provided by this tool, the total factor of energy eficiency index (TFEE) was calculated. The inputs used were gross ixed capital formation, labor and energy consumption; the outputs were CO2 emissions (undesirable output) and Gross Domestic Product - GDP (desired output). From the results, it was possible to observe that Brazil is the country with the highest rate of TFEE, followed by South Africa, China, India and Russia.
Keywords: DEA; BRICS; Total factor energy eficiency.
Energy efficiency analysis of BRICS countries:
a study using Data Envelopment Analysis
Análise da eficiência energética nos países do BRICS: um estudo envolvendo a Análise por Envoltória de Dados
Flávia de Castro Camioto1
Daisy Aparecida do Nascimento Rebelatto2
Roberta Teixeira Rocha2
1 Departamento de Engenharia de Produção, Universidade Federal do Triângulo Mineiro – UFTM, Av. Doutor Randolfo Borges Júnior,
1250, CEP 38064-200, Uberaba, MG, Brazil, e-mail: [email protected]
2 Departamento de Engenharia de Produção, Escola de Engenharia de São Carlos – EESC, Universidade de São Paulo – USP,
Av. Trabalhador São-carlense, 400, CEP 13566-590, São Carlos, SP, Brazil, e-mail: [email protected]; [email protected]
Received Aug. 13, 2014 - Accepted Mar. 27, 2015
Finnancial support: CNPq.
1 Introduction
Throughout history, humans have had a purely extractive attitude towards natural resources. Due to the problems generated by this operation, the
United Nations (UN) created, in 1980s, the World
Commission on Environment and Development
(UNCED), known as the Brundtland Commission.
There is a steady growth in energy demand to sustain the development of countries. At the same time, this energy demand increases the concentration of Greenhouse Gases (GHGs), especially carbon dioxide (CO2) in the atmosphere, consequently intensifying the natural greenhouse effect and global warming. The results presented in the IPCC report
(2007) conirms that the causes of global warming
are largely attributed to human activities, especially those related to CO2 emissions.
In this context, the increase in energy consumption has become a serious problem. According to Lucon & Goldemberg (2007), the current standards of production and energy consumption in the world are largely based on fossil fuels, which generate emissions of local pollutants, greenhouse gases and put at risk the long-term supply of natural resources in the planet, which are non-renewable. According to the IPCC (2007), about 90% of anthropogenic carbon dioxide (CO2) emissions produced annually come from the burning of fossil fuels.
According to Narayan et al. (2007), the pressure
on the world’s major economies to improve energy
eficiency has forced man to investigate ways to reduce
the need for energy consumption in order to avoid energy waste and pollution, therefore contributing to development with sustainability.
Within this context, the long-term relationship between energy consumption and real GDP of 25 OECD countries were analyzed in the study of Belke et al. (2011). The authors suggest that economic growth is directly related to energy consumption.
It is therefore important that the planning of eficient
energy conservation policies consider the direct impacts of energy consumption on economic growth and the consequences of economic growth on energy consumption.
Thus, in order to advance towards the construction
of an eficient world economy in the use of resources,
it is important to evaluate and estimate the energy savings and emissions reduction potential of countries, considering their economic growth. This analysis can provide useful information for energy and environmental policymaking process, and contribute to the sustainable development of countries that impact world economies.
Macroeconomics generally uses a monetary base
to measure the level of energy eficiency, referring to
the current energy consumption per production unit. Recently, a growing number of studies on developed
economies, such as USA (Mukherjee, 2008), Japan
(Honma & Hu, 2008), China (Wang et al., 2012, 2013; Wu et al., 2012; Watanabe & Tanaka, 2007; Hu & Wang, 2006) and India (Mukherjee, 2010), has
contributed to measuring energy eficiency focusing on the analysis of total eficiency factors, in which
any production process of the economy can be seen
as a joint production process in which multiple energy inputs and other materials and resources are used for the production of multiple desired outputs (e.g. PIB) and undesired outputs (e.g. CO2 emissions) as byproducts.
Based on this context, the objective of this study
is to measure and analyze the Total-Factor Energy Eficiency index (TFEE) in the BRICS countries
(Brazil, Russia, India, China and South Africa) providing information on benchmark countries in the BRICS group and the role Brazil has in this scenario.
In this study, the BRICS was chosen due to its
economic stature and global inluence. According
to Amorim (2010), the BRICS, in addition to rapid
economic growth, hold signiicant land mass, natural
resources and considerable amounts and diversity of energy and technological advances.
In this work, the analysis tool used was the data envelopment analysis (DEA), through the SCM variant model and windows analysis, simultaneously maximizing the outputs and minimizing the inputs. Subsequently, with the slacks provided by the DEA,
the Total-Factor Energy Eficiency (TFEE) index
was calculated. It should be noted that most studies
assessing the energy eficiency at the macroeconomic
level using a total factor structure adopt the DEA method, as it provides an appropriate mechanism for dealing with multiple inputs and outputs to measure
the eficiency ratio of each decision making unit
(DMU) under evaluation.
2 Literature review
2.1 Energy eiciency and BRICS
Considering that the higher the level of economic activity, the greater the energy use and the
environmental impacts of this use, energy eficiency can provide security and additional beneits, such
as mitigating CO2 emissions and decreasing energy imports (Selvakkumaran & Limmeechokchai, 2013).
These beneits are complementary, implying a
reduction in the energy required per unit of economic
product, increasing the economic eficiency and
ensuring that the same output can be obtained with less energy and thus less use of natural resources and less environmental damage.
Historically, the OECD countries are the largest
consumers of energy. The study of Niu et al. (2011)
conducted to assess the causality between energy consumption, GDP growth and carbon emissions for
eight countries in the Asia-Paciic between 1971 to 2005,
concluded that carbon emissions, per capita energy
consumption and the eficiency of energy use in
countries, the relative participation recorded a cumulative increase of more than 100% over the past three decades.
Among developing countries, the BRICS group (Brazil, Russia, India, China and South Africa) has been gaining attention. The BRICS countries are an alliance covering four continents and all members are emerging economies, with actions that go beyond pure diplomacy.
The ive countries that form the block are generally
grouped by their similarities. But separately, they have different economic, social, political and cultural characteristics, as well as differences in history, religion, geographies and climates (Almeida, 2009).
Furthermore, Leonova et al. (2007) argued that each
country has its peculiarities with regard to customers, industries, growth trends, environmental governance and resources. Accordingly, Armijo (2007) came to the conclusion that this group of countries does not form a homogeneous whole.
Furthermore, there are economic aspects of these
countries that should not be disregarded. Together, the BRICS countries (Brazil, Russia, India, China and
South Africa) account for a ifth of the economy in
the world and account for 43% of world population (Duarte, 2014). As a matter of fact, South Africa, with the highest growth potential, only became part of the group of countries in 2011, thus the letter “S” incorporated into the BRIC acronym, changing it to BRICS.
Besides its economic importance, the group will
greatly inluence world politics. According to Amorim
(2010), the BRICS, in addition to rapid economic
growth, hold signiicant land mass, natural resources
and considerable quantity and diversity of energy and substantial technological development
There is a concern about how these countries will develop, as mentioned in the work entitled “The Limits to Growth” by Meadows et al. (1972), if these countries consume the same level of resources as the current economic powers, the planet will reach a catastrophic situation.
According to Pao & Tsai (2010), to reduce carbon emissions without hurting economic growth, BRIC countries should increase investment in energy supply
and energy eficiency, and intensify conservation
policies to reduce energy waste.
According to World Bank data (Banco Mundial,
2013) in 2010, the energy consumption of the ive
BRICS countries was higher than the seven G7 countries; 4213.8 * 103 Ktoe against 3927.5*103 Ktoe,
respectively. It is therefore important to look into the nature and characteristics of this high consumption.
For that reason, this work uses the data envelopment
analysis, and from the energy slacks provided by
this tool the total-factor energy eficiency index was
calculated for each of the BRICS countries.
2.2 Data envelopment analysis
The data envelopment analysis technique (DEA) has been successfully employed to evaluate the relative
performance of a set of irms, usually known as Decision
Making Units (DMU), which use the same inputs to produce the same outputs (Ramanathan, 2006). The DEA has its origins in the work of Charnes et al.
(1978) and Banker et al. (1984), both based on Farrell
(1957), who proposed an empirical model to measure
the relative eficiency. According to Farrell (1957), it is more advisable to determine the eficiency of a irm or an administrative unit, comparing it to the best level of eficiency observed, than to compare it
to some unattainable ideal.
Thus, the DEA evaluates the relative eficiency of
a set of DMUs, which in this work is represented by the BRICS countries. This approach has the advantage of considering both multiple inputs and outputs that characterize a particular production process. In addition, the DEA allows DMUs to have immediate information
on their respective eficiency or ineficiency status,
which in turn will depend on the DEA model used (Oggioni et al., 2011). Each model, depending on the type of return to scale, on the frontier format and the
orientation chosen, will lead eficiency to a different
value, which should be construed in accordance with the hypotheses regarding the model used (Mariano, 2008).
Charnes et al. (1978), developed the first mathematical model for DEA called CCR, which adopted the Constant Return Scale (CRS) over the entire production line. Having constant return to scale means using the hypothesis that the inputs and outputs are proportional to each other, which means
that the eficient frontier format of the CCR model is
a straight line with an angle of 45 degrees. The CCR
model calculates the eficiency of a DMU dividing
its productivity by the productivity of the most productive DMU of a given set, without worrying about the scale.
The extent of the CCR model proposed by Banker, Charnes and Cooper, in 1984, formulated the BCC model, which features the Variable Return Scale (VRS). The BCC model compares only DMUs operating on
a similar scale. Thus, in this model, the eficiency of
a DMU is obtained by dividing its productivity by the highest productivity among the DMUs that have the same type return to scale. The frontier of the BCC model consists of a set of straight lines of various angles, which characterizes a linear frontier by parts.
where the DMU is expected to do less work, in terms of reducing the inputs and increasing the outputs, in
order to achieve eficiency. It is seen that the additive
model may be variant, variable return to scale, or invariant, with constant returns to scale.
However, the additive model does not calculate the performance index of the DMUs being compared; it
only allows indicating the eficient DMUs and goals of the ineficient DMUs. Therefore, the interpretation
of the results of this model should be carried out somewhat different from the BCC and CCR models,
where 100% indicates an eficient DMU. In the
additive model, the value of the objective function
represents the distance from the DMU to the eficient
frontier. Therefore, the DMU under consideration is
eficient when the result of the objective function is
zero, therefore the further away it is from zero, the
more ineficient is the DMU.
Because of this limitation in the additive model, some improvements have been proposed, such as the SBM model (Slacks-Based Measure). This model, which was introduced by Tone (2001), is quite similar to the additive model, since it also considers a simultaneous orientation to the inputs and outputs,
but provides, as a result, an eficiency value ranging
from zero to 100%. Thus, the results of this model, although they originate from the same assumptions of the additive model, may be interpreted similarly as the results of the CCR and BCC models.
It should be mentioned that besides allowing to measure the relative performance of the selected countries, this method also allows to calculate the slacks, which express how much each country should
increase or decrease each variable to achieve eficiency
compared to other countries. The slack expresses how far the current performance of the DMU in each variable is from its ideal performance, which can be symbolized by a virtual DMU lying on the
eficiency frontier (also referred to as benchmark).
This ideal performance can be considered a target
for the ineficient DMUs, which can be calculated
according to Expressions 1 and 2:
Target input= xj0 - Sj, para j = 1,2,3...n (1)
Target output = yi0 + Si, para i = 1,2,3...m (2) The relative slack can be determined from the current performance and goal, the percentage expressing the level of improvement needed for each variable in each country. The relative slack can be determined by Expression 3:
Relative slack = (Target – Current)/Current (3)
3 Method
In this work, emerging countries were selected (the BRICS group) in order to analyze the energy
eficiency based on the total factor productivity
perspective. Thus, the units were considered to meet the present study were Brazil, Russia, India, China, South Africa.
To achieve the goal proposed in this paper, we used a mathematical programming method known as data envelopment analysis (DEA). This method was used to construct an economic production
function to analyze the energy eficiency considering
a total factor structure. Thus, the energy is taken in conjunction with conventional inputs: workforce and capital. The latter is typically used in economic productivity analyses as inputs to produce an economic
output (GDP). For economy or region, it is preferred
that the GDP increase occurs while simultaneously decreasing the energy consumption, so that it reaches
the production eficiency. Therefore, the targets for GDP growth and eficiency in energy consumption
should be put together in order to sustain economic development (Hu & Wang, 2006).
Wu et al. (2012), Mandal (2010) and Watanabe & Tanaka (2007) indicate that analyzing energy efficiency without considering environmental
eficiency can lead to skewed results of the energy eficiency evaluation. The comparative analysis that
evaluates the environmental performance and energy
eficiency carried out by Wang et al. (2012), conirmed
that this bias will be seen if the undesirable output (CO2) is omitted in the evaluation. Thus, this work also considered the CO2 emission levels of BRICS, which is one of the most important undesired outputs of energy consumption. It should be noted that the CO2 emissions considered are the results from the burning of fossil fuels.
Therefore, this analysis used three input variables:
workforce, gross ixed capital and energy consumption;
and two output variables: GDP (desired output) and CO2 emissions (undesirable output). All variables were collected from the World Bank website, from 1993 to 2010, the period in which the data for all countries was available. Moreover, when measuring
the energy and environmental eficiency, our intention
was to reduce energy consumption, workforce and capital used as much as possible, while simultaneously increasing the desirable output (GDP). With regard to unwanted output (CO2 emissions), it is better when less emissions are generated. Therefore, in this paper, the unwanted output was modeled as an input, which consists of one of the DEA strategies for the treatment of undesirable outputs.
Accordingly, in this work it is observed that the simultaneous guidance for minimizing inputs and maximizing outputs is more appropriate. Therefore, for this study, we adopted the SBM variant model. This method also provides the values of each variable that countries should increase or decrease to achieve
are also known as slacks. Additionally, this model allows comparing countries that operate at different scales, implying that reductions or increases in inputs do not necessarily produce changes in the same proportion as outputs. Expressions 4 to 9 show the SBM variant model according to Tone (2001):
0 1
1
/ n
j j j
Min t S x
n
τ= −
∑
= (4)Subject to:
0 1
1
1 m /
i i i
t S y
m =
= +
∑
(5)1 z
k=
∑
xjk . λk + Sj =t. xj0, for j=1,2... n (6)1 z
k=
∑
yik . λk – Si =t. yj0, for i=1,2... m (7)1 z
k=
∑
λk =t (8)λk,, Sj and Si ≥ 0 and t > 0 (9)
Where:
λk: Participation of the DMU k for the goal of the
DMU under analysis;
xjk: Amount of input j of DMU k;
yik: Amount of output i of DMU k;
xj0: Amount of input j of DMU under analysis;
yi0: Amount of output i of DMU under analysis;
z: Number of unit assessed; m: Number of outputs; n: Number of inputs;
Si: Slack variable of output i;
Sj: Slack variable of input j.
t: linear adjustment variable.
According to Honma & Hu (2008) and Hu & Wang
(2006), eficiency is usually deined in terms of the
relationship in which the best practice is compared to
the actual operation. The energy eficiency indicator
should be the relationship between the energy that should ideally be consumed and the current energy consumption. The amount of total adjustments of the input “energy consumption” is considered as the ineffective portion of actual consumption. Thus, based on the energy gap settings obtained from the DEA, the percentage of energy that must be conserved can be calculated, while considering other factors. If the gap is equal to zero, i.e., if there is no adjustment for the amount of input “energy consumption”, then the
country has optimum eficiency for energy consumption
when its output is maximized. Therefore, the energy
eficiency of a country is set by the Expression 10, which is called the total-factor energy eficiency (TFEF) for the country i at time t, since the index is
built from the point of view of the total-factor yield.
_ _ ( , )
( , ) 1
_ sup _ ( , )
input energy slack i t
TFEE i t
Energy con tion current i t
= − (10)
The TFEE index represents the eficiency level
of energy consumption in a country. As the slack variable “energy consumption” represents how the country should reduce energy consumption to achieve the best practical level of this variable, the current energy consumption will be always greater than or
equal to the slack. This means that the TFEE index
is always between zero and 1. In this study the index is shown in the form of percentage.
With this panel data, it was deemed interesting to conduct a window analysis, which is a way to include the time factor within the DEA, according to Cooper et al. (2000). The window analysis consists of a structured method to combine DMU data related to several different years in the same application, and this is done by performing multiple DEA applications considering different combinations of years (window). Thus, it can be concluded that the window analysis is also an important way to avoid the problem of low quantities of DMUs, which according to Cooper et al. (2000) should be at least three times the sum of the number of inputs to the number of outputs.
Therefore, window analysis consists of separating the years being analyzed in different groups (windows), and from the data available, the size of each window and the number of windows to be constructed. This information can be obtained through expressions 11 and 12, where k is the number of periods and p is the window size, which is rounded up, if necessary.
_ _ _( ) ( 1) / 2
Size of window p = K+ (11)
_ _ 1
Number of windows= − +k p (12)
To illustrate how these formulas are used and the subsequent construction of windows for the analysis, which assesses the data available 1993-2010 (k = 18), the window size should be 10 and the number of windows must be 9, comprising, respectively, the data from (a) 1993-2002 (b) 1994-2003, (c) 1995-2004 (d) 1996-2005 (e) 1997-2006 (f) 1998-2007 (g) 1999-2008, (h) 2000-2009, (i) 2001-2010.
After constructing all windows, the DEA must be used for each of them, so that a table, which includes all data for each unit in each window, can be prepared later on. It should be noted that in this approach, the
and in all the windows, and the standard deviation of each DMU may also be calculated to verify the
stability of eficiency over time.
In this work, besides the result tables that incorporate
the eficiency obtained in each of the windows of
countries, tables which incorporated the results of the slacks of each variable for each DMU in each window were also prepared. Similarly, the end result of each slack variable for each DMU was the average slack that was achieved in all years in all windows.
4 Results and discussion
First, an analysis using the boxplot graphic was
performed to determine if the units used in this work are homogeneous. According to the results, one outlier was found, China. However, as DEA has no restrictions on the use of outliers, as an outlier can perform on equal terms with other DMUs, despite having a different performance, it was decided to keep China in the analysis in order to include all BRICS countries in the study.
From the application of the variant SBM Model of
DEA and window analysis, the behavior of the BRICS countries in 1993-2010 was observed, considering the
inputs workforce, gross ixed capital formation and
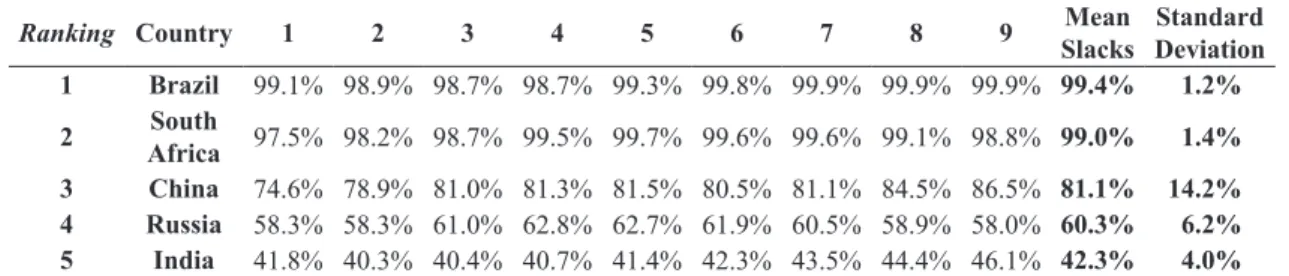
energy consumption and the outputs GDP (desired output) and CO2 emissions (undesirable output). Table 1 shows the rankings obtained.
The data envelopment analysis showed that Brazil
is the most eficient in reducing inputs and undesirable
outputs and increases GDP. Therefore, it can be assumed that increasing the inputs, this country can generate more GDP output and sustainable growth.
South Africa is second in the ranking. Although this country has the smallest inputs and outputs, it holds
one of the best positions in relation to the eficiency
index, and low standard deviation. Although S.A. is gaining ground internationally, national problems such as disease and violence still prevail.
China presented a good average eficiency level,
third in the ranking. It also achieved a fairly high standard deviation, which can be explained by the fact
that there were signiicant and rapid improvements
from one year to the next, which culminated in ensuring that the most recent year of each window
showed 100% performance in relation to the other years, which increased the variability.
Russia, second to last in the ranking, showed average input variables. However, for a country which in recent decades has become a globally isolated economy, it is in a good scenario.
Finally, India, last in the ranking, showed no
improvement or worsening over the years analyzed. Thus, it was concluded that the country has not
improved its eficiency in the use of its inputs for
GDP formation.
In order to better understand this result, an analysis of the slacks for each variable presented by the countries was carried out.
4.1 Analysis of slack variables
This topic enables analyzing the classiication
of countries in the ranking of total factor structure, according to the analysis of each variable through the slacks. To this end, a ranking (1-5) of the slack averages for each variable was built, indicating which country needed to change more the variable analyzed
to improve the relative eficiency (5), and which
country needed to change less the variable (1) in order
to increase eficiency of the other countries, in this
case appearing as benchmarking of this variable for the other members of the BRICS countries.
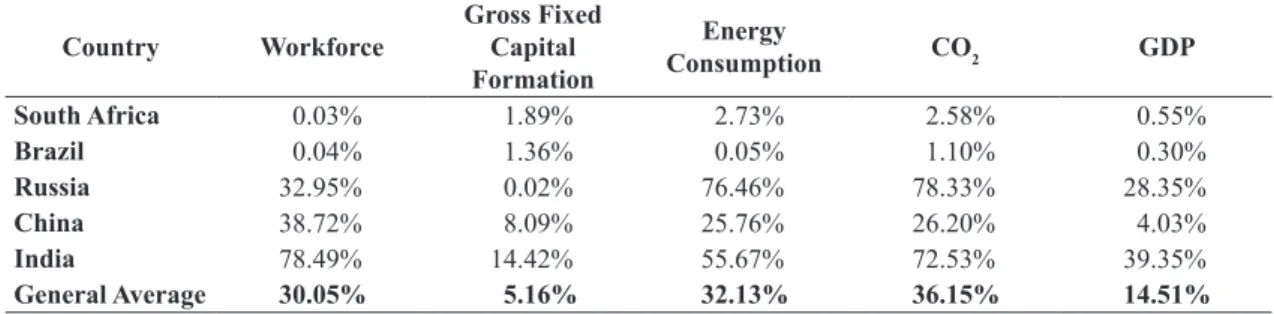
The overall mean eficiency of slacks in each
variable showed that the ranking of the variable slacks was: CO2 emissions (36.15%), energy consumption (32.13%), workforce (30.05%), GDP (14.51%) and
gross ixed capital formation (5.16%), respectively.
Table 2 shows the mean slacks for each variable in each country.
As observed, as the variable CO2 emissions generally showed the largest slacks for the countries, it should receive priority attention so that steps are taken to reverse the current trend. This result may indicate, among other things, that the BRICS need to invest more in renewable energy sources and measures to
improve energy eficiency, such as processes or more eficient technologies.
Energy eficiency measures are justiied because
the CO2 emissions considered in this work are related to fossil fuels. Therefore, actions intended to improve
Table 1. Total-factor eficiency of BRICS countries.
Ranking Country 1 2 3 4 5 6 7 8 9 Mean Slacks
Standard Deviation 1 Brazil 99.1% 98.9% 98.7% 98.7% 99.3% 99.8% 99.9% 99.9% 99.9% 99.4% 1.2%
2 South
the energy eficiency of countries would also result
in a decrease of emissions. Thus, it emphasizes the importance of the focus of this work on the energy consumption of each BRICS country. In addition, the variable energy consumption showed high slacks, and it was second in the ranking of slacks.
The analysis of the data collected from CO2 emissions showed that the level of CO2 emissions of the BRICS increases over the years. The slacks provided by the DEA enabled to present a ranking of the BRICS countries, as shown in Table 3, which indicates how much each country should reduce this
percentage variable to achieve the eficient frontier. The most eficient CO2 emissions, according to the
average of the slacks, are Brazil and South Africa, with averages of 1.10% and 2.58% respectively. Both maintain a slack of 0% in most of the years analyzed, especially in recent years of each window.
Despite these results, according to the Banco Mundial (2014), although Brazil has made progress in reducing deforestation and has become a leader in climate negotiations stating they would voluntarily and progressively reduce these emissions, it has faced
challenges in combining the beneits of agricultural
growth, environmental protection and sustainable development.
India, as well as Russia, second to last and last in
this variable slacks classiication, respectively, showed
higher average slacks. In addition, the analysis of each window shows that the mean slack ratio has increased in each window in recent years. With this data, it can be concluded that at a time when sustainability is sought, Russia and India are not improving their
eficiency over time, that is, seeking to reduce carbon
emissions while maintaining or increasing the GDP through better use of alternative energy sources or
energy eficiency measures.
May (2008) states that emissions are an obstacle to India’s development, since India’s production sector
relies heavily on coal. Nassif (2006) claims that
there is no evidence that this country seeks to ensure sustainable growth, which, according to the Banco Mundial (2014), is third in global carbon emissions.
On the other hand, in the pursuit to reduce emissions and focusing on the economy of their country, amid discussions on the future sales of Russian gas to Ukraine and to the European Union, Russia and China struck a billionaire gas supply contract. The agreement, effective for 30 years, establishes that the Russian Gazprom group will provide annually, from 2018, up to 38 billion cubic meters of natural gas to the neighboring country, according to the
National Corporation of China Petroleum (CNPC).
The deal is valued at 400 billion dollars (G1, 2014). China, in turn, is third in the ranking of mean CO2 emission slacks, averaging 26.20%. One of the most important aspects related to China’s economic growth is their dependence on thermal coal. Then came the
inding by the International Energy Agency that
China’s CO2 emissions would exceed that of the U.S. in 2010, this in fact occurred much earlier than planned, in 2007 (Instituto Carbono Brasil, 2007).
However, improvements are taking place, which
is relected in the high standard deviation of 0.2501.
According to the analysis, there is a considerable decrease in the percentage of the variable slack over the years, especially in recent years, with the mean
Table 2. Average slacks of BRICS countries.
Country Workforce
Gross Fixed Capital Formation
Energy
Consumption CO2 GDP
South Africa 0.03% 1.89% 2.73% 2.58% 0.55%
Brazil 0.04% 1.36% 0.05% 1.10% 0.30%
Russia 32.95% 0.02% 76.46% 78.33% 28.35%
China 38.72% 8.09% 25.76% 26.20% 4.03%
India 78.49% 14.42% 55.67% 72.53% 39.35%
General Average 30.05% 5.16% 32.13% 36.15% 14.51%
Table 3. CO2 Emissions.
Ranking Country 1 2 3 4 5 6 7 8 9 Mean Standard Deviation
1 Brazil 0.7% 1.8% 2.6% 2.4% 1.5% 0.3% 0.3% 0.3% 0.0% 1.10% 0.0218
2 South
Africa 4.4% 2.3% 2.8% 2.2% 1.6% 1.9% 1.9% 3.0% 3.1% 2.58% 0.0366
3 China 45.0% 35.2% 29.3% 24.6% 21.2% 22.2% 21.7% 15.1% 21.6% 26.20% 0.2501
4 India 73.0% 71.8% 70.5% 71.2% 72.2% 72.7% 73.3% 73.9% 74.1% 72.53% 0.0322
5 Russia 79.1% 78.3% 78.4% 77.7% 77.9% 78.0% 78.3% 78.4% 78.9% 78.33% 0.0112
slacks of this variable ranging from 45% in the irst
window to 21.6% in the second one.
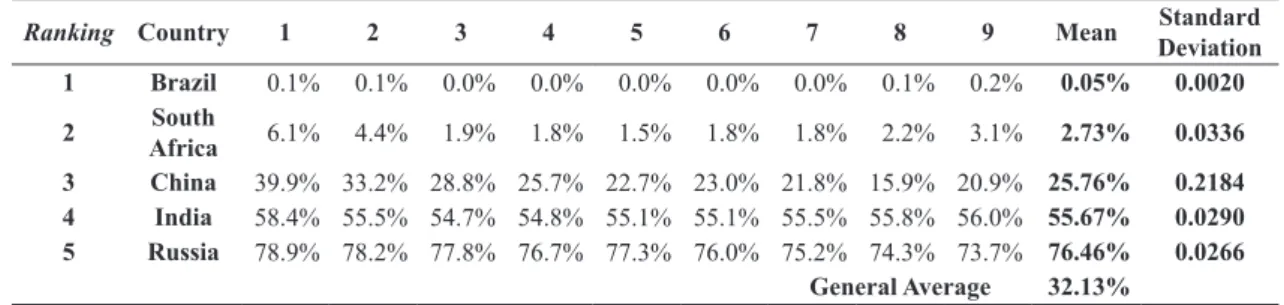
In Table 4 the slacks of the variable energy
consumption are classiied the same as the variable
CO2 emissions. This is explained by the expected positive correlation between these variables, since the annual CO2 emissions come from the burning of fossil fuels.
Thus, Brazil and South Africa lead the ranking of slacks for energy consumption, with an average 0.05% and 2.73% respectively. Over the years, energy
consumption in these countries was mostly eficient,
possibly due to the wide use of alternative energy
and/or increased awareness by the people.
China has improved this aspect and has been able to decrease its average slack. However, at the beginning of the study period, it was observed that its consumption increased, therefore it still is third in the ranking, with an average of 25.76%. However,
the last year of each window was eficient in relation
to this variable, 0% slack. This change in China’s energy consumption is seen in the standard deviation of 0.218, the highest among the BRICS countries for this variable.
However, India has increased the slack for this variable in each window in recent years, justifying the fourth place in the ranking with a slack average of 55.67% and standard deviation of 0.0209.
Finally, in Russia, the slacks for energy consumption
have decreased. However, at a very low rate, since
the difference between the irst and last years of each window do not differ signiicantly. Therefore, this
country is as last in the ranking with an average of 76.46% and a standard deviation of 0.0260.
GDP is the sum, in monetary terms, of all inal
goods and services produced in a given region over a given period. Its main objective is to measure the economic activity of a region. GDP counts only
inal goods and services, excluding all intermediate
consumer goods.
The analysis of the data collected in the 1993-2010 period showed a GDP increase in all countries except Russia, due to the fall of the Soviet Union. According to the data, Russia can regain progress in 1998.
Table 5 shows the average ranking of the slacks for the variable GDP from the DEA analysis.
In relation to GDP, Brazil and South Africa are
nearly eficient, with a considerable number of zero
slacks over the periods analyzed. Therefore, they
occupy the irst and second position in the ranking
of slacks, with an average of 0.30% and 0.55%, respectively, with standard deviation of 0.0083.
However, China is in third place in the ranking with a slacks average of 4.03% and standard deviation of 0.0481. It is seen that for the most recent year of each window, the GDP slack for that country is 0.
This inding is consistent with the analysis of the other
variables, which shows that this country has been
seeking eficiency with respect to the conversion of gross ixed capital formation, workforce and energy
consumption in GDP without increasing CO2 emissions. Russia ranks fourth, with a slack average of 28.35% and a standard deviation of 0.1689. The position could be better, if that country continued with the
performance seen in the irst three windows in which
the slacks for this variable decreased over time. However, the fourth window (1996-2005) showed that Russia is moving away from the GDP variable
Table 4. Energy Consumption.
Ranking Country 1 2 3 4 5 6 7 8 9 Mean Standard Deviation
1 Brazil 0.1% 0.1% 0.0% 0.0% 0.0% 0.0% 0.0% 0.1% 0.2% 0.05% 0.0020
2 South
Africa 6.1% 4.4% 1.9% 1.8% 1.5% 1.8% 1.8% 2.2% 3.1% 2.73% 0.0336
3 China 39.9% 33.2% 28.8% 25.7% 22.7% 23.0% 21.8% 15.9% 20.9% 25.76% 0.2184
4 India 58.4% 55.5% 54.7% 54.8% 55.1% 55.1% 55.5% 55.8% 56.0% 55.67% 0.0290
5 Russia 78.9% 78.2% 77.8% 76.7% 77.3% 76.0% 75.2% 74.3% 73.7% 76.46% 0.0266
General Average 32.13%
Table 5. PIB.
Ranking Country 1 2 3 4 5 6 7 8 9 Mean Standard Deviation
1 Brazil 0.4% 0.3% 0.9% 0.7% 0.4% 0.0% 0.0% 0.0% 0.1% 0.30% 0.0083
2 South
Africa 0.7% 0.7% 0.7% 0.1% 0.3% 0.4% 0.4% 0.6% 1.0% 0.55% 0.0083
3 China 1.6% 0.9% 0.8% 2.3% 4.2% 6.6% 7.9% 8.4% 3.6% 4.03% 0.0481
4 Russia 29.4% 27.8% 22.9% 20.5% 22.9% 26.4% 30.7% 35.6% 38.9% 28.35% 0.1689
5 Índia 43.0% 46.8% 47.9% 45.3% 42.0% 38.3% 33.4% 31.2% 26.2% 39.35% 0.1862
eficiency, since the slack increases at every recent
year of the window.
Finally, India, different from what it has shown
in other variables, shows improvements in the mean slacks in relation to GDP, with a decrease in recent years in a window, reaching zero slack in recent years, in windows 8 (2000-2009) and 9 (2001-2010).
This country ranks in ifth position, with an average
of 39.35% and the highest variability (0.1862) among the analyzed countries.
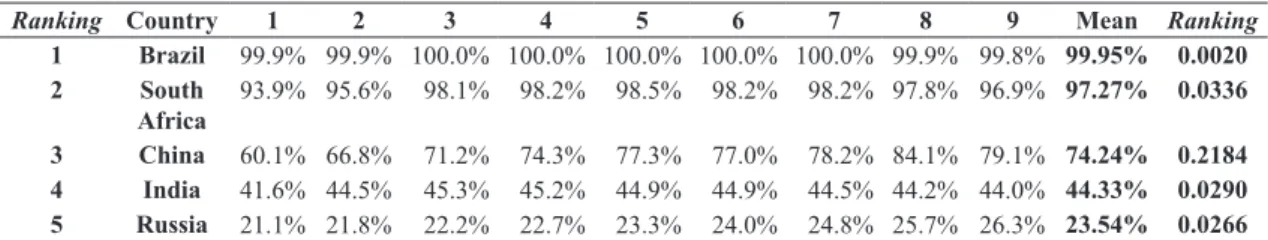
4.2 Total-factor energy eiciency index
With the DEA results, the total-factor energy
eficiency index (TFEE) was calculated from the
slacks of energy consumption and current energy consumption for each BRICS country in each window, as shown in Table 6.
According to the results presented, considering the variables analyzed in this work, Russia is the last
country in the ranking of the TFEE index. However,
consistent with what was observed in the slacks analysis of the variable energy consumption, Table 4 can verify that this country grew over the periods
analyzed, with the average TFEE index ranging above 21.1% in the irst window (1993 to 2002) to
26.3% in the last window (2001-2010).
India is second to last in the TFEE ranking, showing
that although this country has outperformed Russia, it does not show large variability, indicating no
signiicant improvement or worsening, maintaining similar levels in the TFEE index over the years analyzed. Note that the irst window is the one with
the highest percentage difference compared to the other windows.
The third in the performance ranking is China,
which grew in the TFEE index according to the
most recent periods contemplated in the windows. The performances averages went from 60.11% in
window 1, to 79.14% in window 9. Signiicant growth
can be seen over the years. It is noteworthy that the variability of that country was relatively large when compared with those of other countries, and the standard deviation was 21.84%. Therefore, we conclude that China has brought about improvements in recent years in relation to its ability to transform energy, workforce and capital into GDP without increasing CO2 emissions. However, it should be noted that this
is the country that most consumes fossil fuel energy and emits more carbon dioxide. Thus, their growth sustainably is possible, but challenging.
South Africa, according to Table 6, had the second highest variability compared to the average performance (standard deviation of 3.36%). However, although it is still much lower when compared to China, it
increased in the TFEE index, from 93.9% in the irst
window, to 96.9% in the last window.
However, the good positioning of Brazil, when compared to the BRICS countries, may be the result
of support mechanisms for energy eficiency promoted
by the federal government. Of the national programs implemented in previous decades and still in operation,
the most important ones are the National Program for
Energy Conservation - PROCEL (since 1985), the
rationalization National Program for Oil and Natural Gas Derivatives Use - CONPET (since 1991) and mandatory energy eficiency programs administered
by the distribution utilities companies and supervised
by ANEEL.
Today, there are two other instruments to promote
more eficient technologies. One is the Law 9991 of July 24, 2000, determining that concessionaires and
licensees of public services of electricity distribution are required to annually apply an amount of at least 0.75% of its net operating revenue in research and development of the electricity sector and at least 0.25%
in end-use energy eficiency programs (Brasil, 2013).
Another instrument is the Law 10.295, of October 17, 2001, under which the Executive Power determines
maximum levels of speciic energy consumption or minimum energy eficiency of machinery manufactured
or marketed in the country, based on relevant technical indicators (Brasil, 2013).
Therefore, although in that country investments
in energy eficiency programs have been marginal
compared with the investments allocated to promote available options for increasing the energy supply
(production/import, transport and distribution), Brazil
has the potential to reverse this situation in the future, depending on initiatives such as the inclusion of new
energy eficiency programs in the national energy
planning, competing with the increasing energy supply options (Brasil, 2007).
Moreover, it should be noted that the Ten Year Plan for Energy Expansion (PDE 2012-2021) foresees
intense expansion of energy eficiency measures in
Table 6.Ranking TFEE-BRICS.
Ranking Country 1 2 3 4 5 6 7 8 9 Mean Ranking
1 Brazil 99.9% 99.9% 100.0% 100.0% 100.0% 100.0% 100.0% 99.9% 99.8% 99.95% 0.0020
2 South
Africa
93.9% 95.6% 98.1% 98.2% 98.5% 98.2% 98.2% 97.8% 96.9% 97.27% 0.0336
3 China 60.1% 66.8% 71.2% 74.3% 77.3% 77.0% 78.2% 84.1% 79.1% 74.24% 0.2184
4 India 41.6% 44.5% 45.3% 45.2% 44.9% 44.9% 44.5% 44.2% 44.0% 44.33% 0.0290
this country in the coming years. The EPE forecast (EPE, 2012) projects a savings of 24.693 × 10³tep of total energy by 2021. The projections speciically
related to electricity consumption indicate that 48 TWh per year will be saved by the end of this period, which corresponds to a hydro-electric power plant with installed capacity of 10.000MW or three Xingó power plants.
5 Conclusion
Energy is one of the essential components for social and economic development of a nation and must be
closely linked to sustainable, eficient and safe use
of energy from ecological and more economically viable approaches for future short and long-term partnerships.
However, there are numerous problems that modern society must face when seeking to ensure a sustainable energy supply while seeking to reduce energy use. The rapid increase in global energy consumption makes the problem even more complicated. The energy crises that many countries have experienced have shown how societies are vulnerable to geopolitical
and climatic inluences on their supplies.
In this study, the comparison between the BRICS
countries was performed by constructing an eficiency
index, using the DEA technique, which measured the
eficiency of countries in gross ixed capital formation,
workforce and energy consumption by economic growth without harming the environment through increased CO2 emissions. As a result, considering the variables used, this study showed that Brazil had the
highest total-factor eficiency (99.36%), followed by
South Africa, China, Russia and India.
Also, to better understand the results of the
eficiency analysis, the slacks of each variable were
analyzed. This analysis showed that Brazil appeared as a benchmark for other countries in the variables: GDP, energy consumption and CO2 emissions. Another highlight was the South Africa, always among the
irst positions in the ranking of the slacks variables.
It should be noted that the slacks cannot be interpreted as a rigid target, as it is only an indication
of which variable is more detrimental to the eficiency
of countries in relation to others, from the point of view of productivity. Therefore it may be, for example, that there is no possibility to increase or decrease the variables, as indicated by the slacks, considering the current structure of the country and its economic scenario.
In addition to analyzing the slacks, provided by the DEA, the variables considered in this work were also used to calculate the Total-factor Energy
Eficiency index (TFEE). Brazil was the country
that presented the highest index within the BRICS, followed by South Africa, China, India and Russia.
This way, we achieved the research goal by showing which BRICS countries have the highest
TFEE index, considering a total-factor structure,
providing information on benchmark countries within the BRICS group and how Brazil stands in this scenario.
However, the index proposed in this paper has limitations, mainly related to the heterogeneity of the countries compared. Thus, the interpretation of this index requires taking into account the special features in each country, the social, economic and environmental dimensions.
Thus, according to the results, Brazil is a good reference of sustainable practices, therefore it should be further examined, but India may be worthy of further attention with respect to improvements.
In addition, based on the factors analyzed, there is a possibility to guide the allocation of attention and government resources by means of incentive
policies to implement energy eficiency measures in
the countries which ranked in low positions. The objective of this study was to contribute to qualitative and quantitative information regarding the development of BRICS countries to achieve economic growth without harming the environment and with the least amount of production factors. The results can be valuable, and can also be used as guidelines to determine public policies with appropriate strategies
to improve the eficiency of countries considering
the context of sustainability.
References
Almeida, P.R. (2009). O papel dos BRICS na economia mundial. In Cebri-Icone-Embaixada Britânica Brasília. Comércio e Negociações Internacionais para Jornalistas (pp. 57-65). Rio de Janeiro: Cebri.
Amorim, C. (2010). ¿Existe realmente el BRIC?. Economía Exterior, (52), 23-28.
Armijo, L. E. (2007). The BRICS countries (Brazil, China, Russia and China) as analytical category: mirage or insight? Asian Perspective, 31(4), 7-42.
Banco Mundial. (2013). Apresenta diversas informações relativas aos países. Recuperado em 17 de janeiro de 2013, de http://www.worldbank.org/.
Banco Mundial. (2014). Recuperado em 16 de abril de 2014, de www.worldbank.org.
Banker, R. D., Charnes, A., & Cooper, W. W. (1984). Some models for estimating technical and scale inefficiencies in data envelopment analysis. Management Science, 30(9), 1078-1092. http://dx.doi.org/10.1287/mnsc.30.9.1078.
Braga, C. (2007). Contabilidade ambiental: ferramenta para a gestão da sustentabilidade. São Paulo: Atlas. Brasil. Ministério de Minas e Energia - MME. (2007). Matriz
Energética Nacional 2030. Brasília: EPE. Recuperado em 22 de março de 2013, de http://www.mme.gov.br. Brasil. Palácio do Planalto. Presidência da República.
(2013). Apresenta todo o material legislativo produzido na história do Brasil. Recuperado em 21 de agosto de 2013, de http://www2.planalto.gov.br/presidencia/ legislacao.
Charnes, A., Cooper, W. W., Golany, B., Seiford, L., & Stutz, J. (1985). Foundations of data envelopment analysis for Pareto-Koopmans efficient empirical production functions. Journal of Econometrics, 30(1-2), 91-107. http://dx.doi.org/10.1016/0304-4076(85)90133-2. Charnes, A., Cooper, W. W., & Rhodes, E. (1978). Measuring
the efficiency of decision making units. European Journal of Operational Research, 2(6), 429-444. http://dx.doi. org/10.1016/0377-2217(78)90138-8.
Coelli, T., Prazada, R. D. S., & Battese, G. E. (1998). An introduction to eficience and productivity analysis. Massachussets: Kluer Academic Pulishers.
Cooper, W. W., Seiford, L. M., & Tone, K. (2000). Date Envelopment Analysis: a comprehensive Text with models, applications, reference and DEA-Solver software. Norwell: Kluwer Academic Publishers.
Duarte, L. (2014). Banco dos BRICS pode ser veículo para ampliar inluência da China no mundo. Recuperado em 27 de janeiro de 2015, de http://www.bbc.co.uk/ portuguese/noticias/2014/07/140713_brics_china_ld.
Empresa de Pesquisa Energética - EPE. (2012). Plano Decenal de Expansão de Energia – PDE 2021. Recuperado em 13 de setembro de 2011, de http://www.epe.gov.br. Farrell, M. J. (1957). The measurement of productive
efficiency. Journal of the Royal Statistical Society. Series A (General), 120(3), 253-281. http://dx.doi. org/10.2307/2343100.
G1. (2014). China e Rússia assinam acordo histórico de gás natural. Recuperado em maio de 2014, de http:// g1.globo.com/mundo/noticia/2014/05/china-e-russia-assinam-acordo-historico-de-gas-natural.html. Honma, S., & Hu, J. L. (2008). Total-factor energy efficiency
of regions in Japan. Energy Policy, 36(2), 821-833. http://dx.doi.org/10.1016/j.enpol.2007.10.026. Hu, J. L., & Wang, S. C. (2006). Total-factor energy efficiency
of regions in China. Energy Policy, 34(17), 3206-3217. http://dx.doi.org/10.1016/j.enpol.2005.06.015.
Instituto Carbono Brasil. (2007). China ultrapassa EUA como maior emissor de CO2. Recuperado em abril
de 2014, de http://www.institutocarbonobrasil.org.br/ reportagens_carbonobrasil/noticia=197643.
Intergovernmental Panel on Climate Change - IPCC. (2007). Climate Change 2007: Mitigation. Contribution
of Working Group III to the Fourth Assessment Report of the Intergovernmental Panel on Climate Change. In B. Metz, O. R. Davidson, P. R. Bosch, R. Dave, L. A. Meyer (Eds). Cambridge: Cambridge University Press. Leonova, T., Eigel, M., & Nataliya, M. (2007). Bric
countries: chalanges of decade. In 2007 International conference of Management Science & Engineering (pp. 20-22). Harbin, China.
Lucon, J., & Goldemberg, O. (2007). Energia e meio ambiente no Brasil. Estudos Avançados, 21(59), 7-20.
Mandal, S. K. (2010). Do undesirable output and environmental regulation matter in energy efficiency analysis? Evidence from Indian Cement Industry. Energy Policy, 38(10), 6076-6083. http://dx.doi.org/10.1016/j. enpol.2010.05.063.
Mariano, E. B. (2008). Sistematização e Comparação de Técnicas, Modelos e Perspectivas não paramétricas de análise de Eiciência Produtiva (Dissertação de mestrado). Escola de Engenharia de São Carlos, Universidade de São Paulo, São Carlos.
May, P. H. (2008). Como superar as condições entre crescimento e sustentabilidade? Inovações institucionais nos BRICS. In G. Dupas. Meio ambiente e crescimento econômico: tensões estruturais. São Paulo: Ed. UNESP. Meadows, D. H., et al. (1972). The limits to growth. New
York: Universe Books.
Mukherjee, K. (2008). Energy use efficiency in US manufacturing: a nonparametric analysis. Energy Economics, 30(1), 76-96. http://dx.doi.org/10.1016/j. eneco.2006.11.004.
Mukherjee, K. (2010). Measuring energy efficiency in the context of an emerging economy: the case of Indian manufacturing. European Journal of Operational Research, 201(3), 933-941. http://dx.doi.org/10.1016/j. ejor.2009.04.012.
Narayan, P. K., Smyth, R., & Prasad, A. (2007). Electricity consumption in G7 countries: a panel cointegration analysis of residential demand elasticities. Energy Policy, 35(9), 4485-4494. http://dx.doi.org/10.1016/j. enpol.2007.03.018.
Nassif, A. (2006). A economia indiana no período 1950-2004. Da estagnação ao crescimento acelerado: lições para o Brasil? (Texto para Discussão, No. 107). Rio de Janeiro: BNDES.
Niu, S., Ding, Y., Niu, Y., Li, Y., & Luo, G. (2011). Economic growth, energy conservation and emissions reduction: A comparative analysis based on panel data for 8 Asian-Pacific countries. Energy Policy, 39(4), 2121-2131. http://dx.doi.org/10.1016/j.enpol.2011.02.003. Oggioni, G., Riccardi, R., & Toninelli, R. (2011).
consumption and economic growth in BRIC countries. Energy Policy, 38(12), 7850-7860. http://dx.doi. org/10.1016/j.enpol.2010.08.045.
Ramanathan, R. (2006). A multi-factor efficiency perspective to the relationships among world GDP, energy consumption and carbon dioxide emissions. Technological Forecasting and Social Change, 73(5), 483-494. http://dx.doi.org/10.1016/j.techfore.2005.06.012.
Selvakkumaran, S., & Limmeechokchai, B. (2013). Energy security and co-benefits of energy efficiency improvement in three Asian countries. Renewable & Sustainable Energy Reviews, 20, 491-503. http://dx.doi. org/10.1016/j.rser.2012.12.004.
Tone, K. (2001). A slacks-based measure of efficiency in data envelopment analysis. European Journal of Operational Research, 130(3), 498-509. http://dx.doi. org/10.1016/S0377-2217(99)00407-5.
Wang, K., Wei, Y. M., & Zhang, X. (2012). A comparative analysis of China’s regional energy and emission performance. Which is the better way to deal with undesirable outputs? Energy Policy, 46, 574-584. http:// dx.doi.org/10.1016/j.enpol.2012.04.038.
Wang, K., Wei, Y. M., & Zhang, X. (2013). Energy and emissions efficiency patterns of Chinese regions: A multi-directional efficiency analysis. Applied Energy, 104, 105-116. http://dx.doi.org/10.1016/j.apenergy.2012.11.039.
Watanabe, M., & Tanaka, K. (2007). Efficiency analysis of Chinese industry: a directional distance function approach. Energy Policy, 35(12), 6323-6331. http:// dx.doi.org/10.1016/j.enpol.2007.07.013.