Nutritional assessment in children
under 10 in Ferros, Minas Gerais
AVALIAÇÃO DO ESTADO NUTRICIONAL DE CRIANÇAS MENORES DE 10 ANOS NO MUNICÍPIO DE FERROS, MINAS GERAIS
EVALUACIÓN DEL STATUS NUTRICIONAL DE NIÑOS CON MENOS DE 10 AÑOS EN LA CIUDAD DE FERROS, ESTADO DE MINAS GERAIS
1 Nurse. Student of the Master’s Program in Health and Nursing, School of Nursing at Federal University of Minas Gerais. Belo Horizonte, MG, Brazil. [email protected] 2 Nurse with the Family Health Program in the municipality of Ferros, Minas Gerais. Ferros, MG, Brazil. [email protected]
O
RIGINAL
A
R
TICLE
RESUMO
A sociedade brasileira vivencia, além da des-nutrição e fome, problemas relacionados à obesidade – a transição nutricional. Este tra-balho é um estudo transversal com amostra de 1322 crianças menores de 10 anos, resi-dentes no município de Ferros, Minas Ge-rais, e cadastradas no SISVAN. Observou-se que 20,7% das crianças apresentaram algu-ma alteração nutricional (10,1% risco nutri-cional, 3,8% desnutrição e 6,7% sobrepeso). Fatores de risco para o desenvolvimento de desnutrição foram pesquisados: baixo peso ao nascer, RP=3,57, IC 95% (1,96-6,52); bai-xa estatura RP=19,36, IC 95% (11,53-32,52); aleitamento materno ausente RP=2,23, IC 95% (1,19-4,18); renda familiar de até R$ 95, RP = 2,39, IC 95% (1,10-5,16). Destaca-se maior prevalência de sobrepeso em relação à desnutrição. Enquanto a população rural apresentou maior prevalência de desnutri-ção e risco nutricional, a urbana destacou-se pelo sobrepeso. Esdestacou-ses resultados são im-portantes para mostrar que intervenções nutricionais são necessárias e devem consi-derar os problemas específicos apontados.
DESCRITORES
Transtornos da nutrição infantil. Desnutrição.
Obesidade.
Transição nutricional. Avaliação nutricional.
Mariana Santos Felisbino-Mendes1, Mirelle Dias Campos2, Francisco Carlos Félix Lana3
ABSTRACT
Brazil is going through problems with obe-sity as well as malnutrition and starvation – the nutritional transition. This is a cross sectional study with a sample of 1322 chil-dren under 10 years of age, residents in Ferros, Minas Gerais, Brazil, enrolled in SISVAN. Results showed that: 20.7% of chil-dren had nutritional disorder (10.1% nutri-tional risk, 3.8% malnourished and 6.7% overweight risk). Malnutrition risk factors were also identified: low birth-weight, RP=3.57, IC 95% (1.96-6.52); stunting, RP=19.36, IC 95% (11.53-32.52); no breast-feeding, RP=2.23, IC 95% (1.19-4.18); fam-ily income below R$ 95, RP=2.39, IC 95% (1.10-5.16). Prevalence for overweight was higher than for malnutrition. While the ru-ral population presented higher prevalence for nutritional risk and malnutrition, in the urban area there was higher prevalence of risk for overweight. These results show the need for specific nutritional interventions according to the specific issues identified.
KEY WORDS Child nutrition disorders. Malnutrition.
Obesity.
Nutritional transition. Nutritional assessment
RESUMEN
La sociedad brasileña experimenta, más allá de la desnutrición y el hambre, problemas relacionados con la obesidad -la transición nutricional-. Este trabajo es un estudio trans-versal, fue realizado sobre una muestra de 1322 niños con menos de 10 años residentes en Ferros, Minas Gerais, registrados en el SISVAN. Se observó que el 20,7% de los niños presentaba alguna alteración nutricional (10,1% riesgo nutricional, 3,8% desnutrición y 6,7% sobrepeso). Fueron investigados fac-tores de riesgo para el desarrollo de la desnu-trición: bajo peso al nacer, RP = 3,57, IC 95% (1,96-6,52); baja estatura, RP = 19,36, IC 95% (11,53-32,52); ausencia de amamantamien-to, RP = 2,39, IC 95% (1,10-5,16). Es destacable la prevalencia del sobrepeso respecto de la desnutrición. Mientras la población rural pre-sentó mayor prevalencia de desnutrición y riesgo nutricional, la urbana se destacó por el sobrepeso. Estos resultados son importan-tes para demostrar que las acciones nutricionales son necesarias y deben enfocar-se en los problemas específicos detectados.
DESCRIPTORES
Transtornos de la nutrición del niño. Desnutrición.
Obesidad.
INTRODUCTION
Despite a worldwide reduction in child malnutrition, it is currently the most important public health problem in developing countries. It is a complex disease, originated from many causes and rooted in poverty(1).
Malnutrition occurs when the body does not receive the nutrients required for its physiologic metabolism, which occurs when food intake is not adequate in either quantity or quality. Most cases, however, have a secondary cause: the intake of food that is poor in basic nutrients, i.e., they result from insufficient food intake or hunger(2-3).
Malnutrition is directly or indirectly responsible for high rates of morbidity and mortality, mainly in younger chil-dren (first years of life) experiencing an accelerated growth rate(4). Some epidemiologic data reflect the magnitude of
malnutrition according to this context: 12 million deaths of children younger than five years old reported every year in developing countries, mainly due to avoidable causes, around 60% are related to malnutrition(4).
Improvements in life conditions and healthcare quality throughout the years have caused a decrease in national child malnutri-tion rates. Prevalence, measured by weight/ age deficit in children younger than five years old for the national surveys carried out in 1974-1975, 1989 and 1996, were 18.4%, 7.1% and 5.7%, respectively(5).
In 2002, the prevalence of chronic mal-nutrition in this age bracket was 7% and 2% for severe malnutrition(6). In 2005, a world
prevalence of child malnutrition was esti-mated in 29%; the African continent holds the
highest rate, 33.8%, followed by Asia with 29.9% and Latin America with 9.3%(7).
Despite the significant reduction of child malnutrition prevalence, millions of Brazilian children currently suffer from the consequences of this morbidity, especially those in rural areas and in the poorest regions of the country. Malnutrition repercussions are systemic, affecting the body as a whole, and, in children, may hinder appropriate growth and development(4).
Hence, when addressing malnutrition, its multiple eti-ologies must be considered. In addition to specific cures for malnourished children, interventions in the family and with community leaders are necessary within a multidisci-plinary work, in an attempt to promote health(4).
In addition to malnutrition and hunger, Brazilian soci-ety currently experiences obesity-related problems. Such a scenario represents a transitional nutritional phase; in other words, changes in food intake patterns of individuals due to dietary changes caused by socio-economic changes and the influence of the media(8).
The nutritional transition, in general, is characterized by the passage from malnutrition to obesity. Obesity has shown an important prevalence in several population sub-groups in almost all Latin American countries(9-10).
Obesity is a result of a diet rich in fats and sugar, namely Eastern diet parallel to a progressive decrease in physical activities(8). Child obesity is directly related to obesity at
adult age. In addition, atherosclerosis and high blood pres-sure are pathologic processes related to obesity and initi-ated during childhood, as well as dyslipidemia, diabetes, orthopedic problems, sleep apnea, biliary lithiasis and food intake disorders(4). Obese children can develop low
self-esteem, affecting school development and social relations, as well as long-term psychological consequences(4).
Hence, as malnutrition, obesity is also an important pub-lic health problem justifying a preventive approach that should be initiated in childhood.
OBJECTIVES
The National Program of Nutritional and Food Surveillance – SISVAN in Brazilian acro-nyms – of the Department of Health in the municipality of Ferros, Minas Gerais, Brazil, the Municipal Health Department organized a process of data collection targeting the population of children under 10 years old. The research allows for the identification of this population’s nutritional profile, resulting on grounds to support interventions and, at the same time, the implementation and pro-vision of this information system to basic healthcare.
Therefore, the objective of this study was to analyze the nutritional profile of children younger 10 years old living in the municipality of Ferros/MG, based on the data collected for SISVAN, so as to identify social groups that are more vulnerable to malnutrition and being overweight.
METHOD
This is a cross-sectional study whose sample consists of children registered in SISVAN, ages from 0 and 9 years and 11 months, of both genders, living in urban or rural areas of the municipality of Ferros, Minas Gerais.
The municipality of Ferros is located in the region of Itabira/ MG, 174 Km away from the capital Belo Horizonte. It is di-vided into six districts in addition to the urban area. It has four Family Health Teams (FHT I, II, III, IV). The FHT IV covers the Urban Area, and the other three, cover the Rural Area. Public Basic healthcare services in the municipality include the Mayor Moacyr Dias Lage Health Center, located in the municipal seat, and other rural service stations in the other districts. Around 64% of the population lives in the Rural Area (11).
In addition to malnutrition and hunger, Brazilian
society currently experiences obesity-related problems. Such
a scenario represents a transitional nutritional
The Basic Care Information System (SIAB in Brazilian acronyms) was used to learn about the universe of chil-dren between 0 and 9 years and 11 months old registered in SISVAN. Data prior to registration showed a universe of 1,766 children.
On 08/16/2006, the SISVAN registry began a strong ef-fort to reactivate the program in the municipality. For this study, children with registration files logged before 02/30/ 2007 were considered, corresponding to 1,322 children. Registration was a result of a partnership among academic nursing professionals who underwent the Supervised In-ternship in Basic Health Services – Nursing School, Rural Internship Mode of the Federal University of Minas Gerais, with the Municipal Health Department of Ferros and multi-professional teams of the FHT municipalities.
The following information were obtained from the SISVAN registration files: anthropometric data (height and weight), birth and the child’s data (weight at birth, gesta-tional age, breastfeeding) demographic and socio-economic data (age, gender, residence, district, family Support Pro-gram benefit provision) to evaluate the presence or not of risk factors for malnutrition. Other data were collected with the same purpose from the Basic Care Information System of the municipality and the children’s medical records in the healthcare services in order to complement the data analysis (educational level of mothers, FHT team, number of people living in the house, vaccine records).
The anthropometric method was used to obtain the weight and height of the children wearing light clothes. Excess clothes such as jackets and shoes were taken off. The weight was mea-sured with a scale. Weighing children younger than two years was performed with a previously-calibrated mechanical pedi-atric scale, according to their availability in the service and. An appropriately calibrated platform mechanical scale was used for children between 2 and 9 years and 11 months old. The weight was measured until the closest to 0.1 Kg. Children younger than two years were measured by a horizontal an-thropometer for their height, and children older than two years were measured with vertical anthropometer, in cm(12).
Anthro-pometric measures were carried out by trained FHT team pro-fessionals. Children holding the Ministry of Health’s child card (provided by the maternity at birth, and used to follow their growth and development) had their weight and height regis-tered in the growth curve. Whenever they showed alregis-tered registry, a child development appointment was booked with a team nurse. Those without a child card had their values com-pared to a NCHS (National Center of Health Statistics) table and the same procedure was carried out whenever alterations were identified.
Based on measures of weight and height, the child’s nutritional status was evaluated according to NCHS tables, internationally adopted by the WHO and alleged by SISVAN/ MS, considering the child’s gender and age (in months). According to the corresponding percentage in the anthro-pometric data, the child was then diagnosed as eutrophic,
under nutritional risk, malnourished, or under the risk of being overweight.
Nutritional rates used to evaluate children’s nutritional status were: weight according to age, height according to age and weight according to height(12). In the case of abnormal
indexes, immediate procedures were adopted as guidelines for mothers or legal guardians regarding food intake; appoint-ments with the nursing team for the next month or in fifteen days to follow-up the child’s growth and development.
Also, it is important to state that in this evaluation, the index of weight according to age was used as the main value in the malnutrition diagnosis; however, other ratios were also considered as parameters. When altered, they deter-mined irregularities of the child’s nutritional status.
In the evaluation of weight according to age, weight equal to or higher than 97 percent determines the risk of overweight in a child; weight equal to or higher than 10 and less than 97 percent characterizes the child as eutrophic; those with less than 10 and equal to or higher than 3 percent suggest nutritional risk situation; and less than 3 percent represent malnutrition(13).
In the evaluation of height according to age, 3 percent is the limit for considering a child as low height, since 3% of the reference population demonstrated lower height to what is considered normal(13). It indicates the accumulative effect
of adverse situations on child development, a more sensible indicator to evaluate quality of life in a population(13).
The weight according to the height index is the most sen-sible index to diagnose overweight. It expresses the harmony between body mass and height. When the percentage is higher or equal to 97, it indicates risk of being overweight, and when it is lower than 3, severe malnutrition. The preva-lence of low weight according to height in our environment is low, around 5%. An isolated interpretation cannot occur, because weight can be adjusted to a deficient height.
The data obtained were registered in the SISVAN records by technicians at the epidemiology sector of the municipality and, afterwards, extracted from the information system by the nursing professionals with the purpose of building a data base to analyze it with the aid of a statistical program. The EPI-INFO 6.0 software was used to determine nutritional alter-ation frequencies and associated factors. Tests such as the X2 and the bivariate analysis were used to verify associations between possible risk factors. The prevalence ratio was calcu-lated with a confidence interval of 95% and p-value< 0.05.
was proposed and approved by the Municipal Health De-partment of Ferros, Minas Gerais, Brazil.
RESULTS
Data from the SISVAN related to 1,322 children were collected, corresponding to 74.9% of the population in this age bracket for this study, registered in SIAB in August 2006.
Data collection coverage reached values above 80% in some Family Health Teams, except for FHT I, which delayed registra-tion due to operaregistra-tional problems in the registry process.
Description of the population under study
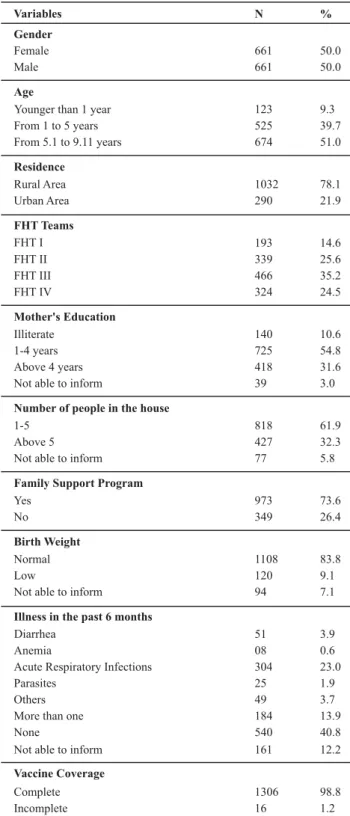
Of the 1,322 children registered, 661 (50.0%) were male and 661 (50.0%) were female. The age bracket of 5 years and 1 month to 9 years and 11 months was the most preva-lent, represented by 51.0% of the studied population. Re-garding the place of residence, 78.1% lived in the rural area, while 21.9% were from the urban area.
The illiteracy rate among mothers was 10.6% and most of them had only had four years of education (65.4%). The aver-age number of dwellers per residence was five, and 32.3% of the families had more people living in the same residence. It is important to point out that 73.6% of the studied population received the Family Support Program, a fact that illustrates their low income. Low weight prevalence at birth was 9.1%.
Another aspect evaluated in these children was the pres-ence of clinical intercurrpres-ences in the past six months. For those children under 6 months, they were inquired if they had been ill prior to the registry date. The municipality re-ported an excellent result (98%) on vaccine coverage.
Maternal breastfeeding information is prioritized by SISVAN/MS. Regarding the progressive breastfeeding in the first six months of age, 11.0% of children demonstrated that they were not even breastfed..Among those that were breastfed, the average breastfeeding time was seven months.
It is well-known that exclusive breastfeeding is best for children in the first six months of life. Only 32 out of 75 children within that age (42.7%) experienced it. Breastfeed-ing can occur up to two years of age as a complement to child food intake. After the first six months of life, new types of food are introduced until the child becomes used to the same diet as the rest of the family. From all 176 children in this age bracket, only 63 (35.8%) had complementary breastfeeding, characterizing a very low rate.
Weaning is recommended after two years of age in case the child is still under maternal breastfeeding. A concern-ing factor was that 36.4% of children under maternal breast-feeding were older than two years old. In other words, even at that age, they are still being fed only by maternal milk and water, tea and juice. Also, 33.1% of these children (older than 2 years) received maternal milk as a complement.
Table 1 - Characterization of the population under study - Ferros,
Minas Gerais - March - 2007
Variables N %
Gender
Female 661 50.0
Male 661 50.0
Age
Younger than 1 year 123 9.3
From 1 to 5 years 525 39.7
From 5.1 to 9.11 years 674 51.0
Residence
Rural Area 1032 78.1
Urban Area 290 21.9
FHT Teams
FHT I 193 14.6
FHT II 339 25.6
FHT III 466 35.2
FHT IV 324 24.5
Mother's Education
Illiterate 140 10.6
1-4 years 725 54.8
Above 4 years 418 31.6
Not able to inform 39 3.0
Number of people in the house
1-5 818 61.9
Above 5 427 32.3
Not able to inform 77 5.8
Family Support Program
Yes 973 73.6
No 349 26.4
Birth Weight
Normal 1108 83.8
Low 120 9.1
Not able to inform 94 7.1
Illness in the past 6 months
Diarrhea 51 3.9
Anemia 08 0.6
Acute Respiratory Infections 304 23.0
Parasites 25 1.9
Others 49 3.7
More than one 184 13.9
None 540 40.8
Not able to inform 161 12.2
Vaccine Coverage
Complete 1306 98.8
Incomplete 16 1.2
Nutritional Alterations
index (6.7%). Regarding the Weight/Height index, a good indicator of acute malnutrition, 5.3% demonstrated nutri-tional alterations, composing 34% of malnourished children.
Table 2 - Distribution of the nutritional status of children under 10
years according to the Index - Ferros, Minas Gerais - March, 2007
Nutritional Status N %
Height/Age Index
Suitable 1140 86.2
Low height 88 6.7
Above 97 percent 92 7.0
Missing 02 0.2
Total 1322 100
Weight/Height Index
Eutrophic 1156 87.4
Acute Malnutrition 70 5.3
Overweight risk 94 7.1
Missing 02 0.2
Total 1322 100
Weight/Age Index
Eutrophic 1049 79.3
Nutritional Risk 134 10.1
Malnutrition 50 3.8
Overweight Risk 89 6.7
Total 1322 100
Finally, the Weight/Age index, used to classify the final infantile nutritional status, demonstrated that 20.7% of children showed some type of nutritional alteration, 10.1% nutritional risk, 3.8% malnutrition and 6.7% overweight risk.
Possible risk factors
Table 3 shows the significant risk factors researched (p-value< 0.05), as the rural area contains the higher number of children in risk of malnutrition and malnourished, and the urban area has a higher prevalence of obese children (9.7%). The FHT III team demonstrated a higher prevalence for nutritional risk and malnutrition, 12.7% and 5.6%, re-spectively, and Team IV, in the urban area, a higher preva-lence of child obesity (9.3%). Children born with low weight demonstrated higher prevalence of malnutrition (11.7%), as well as those with low height (33.0%).
Among the malnourished children in this study (n=50; 3.8%), 34.0% can be characterized as having acute malnu-trition, and the rest as having chronic malnutrition. More-over, 58% of these children have low height – in other words, a longitudinal growth beneath the normality rate for that age, reflecting the high prevalence of chronic malnutrition in this population.
Table 3 - Possible risk factors to nutritional status alterations Ferros, Minas Gerais - March, 2007
E NR M OWR
Possible Risk Factors/
Nutritional Status N % N % N % N % p-Value
Residence 0.000
Rural Area 809 78.4 120 11.6 42 4.1 61 5.9
Urban Area 240 82.8 14 4.8 08 2.8 28 9.7
Number of people in the house 0.028
Less or equal to 5 665 81.3 66 8.1 26 3.2 61 7.5
More than 5 327 76.6 57 13.3 20 4.7 23 5.4
FHT Team 0.000
Team I 162 83.9 17 8.8 04 2.1 10 5.2
Team II 259 76.4 40 11.8 11 3.2 29 8.6
Team III 361 77.5 59 12.7 26 5.6 20 4.3
Team IV 267 82.4 18 5.6 09 2.8 30 9.3
Family Support Program 0.024
Yes 775 79.7 101 10.4 42 4.3 55 5.7
No 274 78.5 33 9.5 08 2.3 34 9.7
Weight at birth 0.000
Low Weight (< 2.500 grams) 90 75.0 13 10.8 14 11.7 03 2.5
Normal Weight (>2.500 grams) 890 80.3 106 9.6 32 2.9 80 7.2
N/A 69 73.4 15 16.0 04 4.3 06 6.4
Currently Breastfeeding 0.049
Yes 121 73.8 17 10.4 12 7.3 14 8.5
No 928 80.1 117 10.2 38 3.3 75 6.5
Height/Age Index 0.000
Normal 966 84.7 94 8.2 21 1.8 59 5.2
Low height 22 25.0 37 42.0 29 33.0 00 0.0
Higher or equal to 97 percent 61 64.9 03 3.2 00 0.0 30 31.9
Weight/Height Index 0.000
Eutrophic 972 84.2 108 9.4 32 2.8 42 3.6
Acute Malnutrition 30 42.9 23 32.9 17 24.2 00 0.0
Overweight Risk 47 48.9 01 1.1 01 1.1 47 48.9
Finally, risk factors for the development of malnutrition were found: low weight at birth, PR=3.57, CI 95% (1.96-6.52); low height PR= 19.36, CI 95% (11.53-32.52); living in the dis-trict of Cubas PR= 2.26, CI 95% (1.24-4.11); belonging to FHT team III, PR= 1.99, CI 95% (1.16-3.43); absent maternal breast-feeding PR=2.23, CI 95% (1.19-4.18); and family income of up to 95 reais, PR = 2.39, CI 95% (1.10-5.16). Therefore, it is suggested that children who presented these factors in their lives had higher chances (PR) of developing malnutrition than those without those factors (p-value<0.05). The other fac-tors demonstrated here were not statistically relevant.
Table 4 - Prevalence Ratio for Risk Factors - Ferros, Minas Gerais
- March, 2007
Malnutrition Risk Factors
RP (IC95%)
p-Value*
Low Weight at birth 3.57 (1.96-6.52) 0.000
Low height 19.36 (11.53-32.52) 0.000
Living in Cubas 2.26 (1.24-4.11) 0.006
Belonging to FHT III 1.99 (1.16-3.43) 0.017
Absent maternal breastfeeding 2.23 (1.19-4.18) 0.020
Receiving up to R$95.00
(Family Support Program) 2.39 (1.10-5.16) 0.036 More than 5 people living in
the house
1.47 (0.83-2.61) 0.238
Mother's Education < 4 years 0.93 (0.51-1.71) 0.945
*p-value: Yates corrected and Fisher Exact 2-tailed
DISCUSSION
Results demonstrated that the sample is homogeneous regarding gender. As for the age, individuals were grouped according to the following age brackets: less than 1 year; from 1 to 5 years; and from 5 and 1 month to 9 and 11 months. This division was based on the importance of this factor in the life of the child in each age bracket (growth, development milestones, socialization, breastfeeding, among others), in addition to being used in most studies involving children’s nutritional status.
The educational profile of mothers was also investigated, because it is seen as a potential factor that leads to malnu-trition. Various studies point out that the mother’s lack of information contributes directly or indirectly to her nutri-tional status, morbidity and mortality(3,13-16,19). The
educa-tional level of mothers in the municipality was observed to be poor. No significant associations with this factor were found; however, during the child development appoint-ments and registry, a high amount of misinformation was observed, especially in those mothers with children under nutritional alterations. It is known that such misinforma-tion is related to the educamisinforma-tional level.
Vaccine coverage was verified in order to evaluate the Municipal Health Department efforts to achieve the tar-gets established by the Integrated and Negotiated
Pro-gramming. Also, good vaccine coverage is considered to significantly contribute to improve children’s quality of life and health.
Regarding maternal breastfeeding, the results found show the need for improving the maternal breastfeeding profile of the municipality. A suitable attendance of the prenatal phase and the fifth day appointment can improve this scenario, since the data show great misinformation. Nurses, during the child’s growth and developmental at-tendance appointments, and in operational groups can in-sidiously act by informing and contributing for the improve-ment of maternal breastfeeding profile.
The malnutrition rate found in Ferros was lower to the national rate of 5.8%, also close to the values for the south-eastern region. The nutritional risk demonstrated an im-portant prevalence and, in many studies, it is considered as light malnutrition. Also, when alterations are grouped, the prevalence of nutritional disorders was high. The preva-lence of overweight risk is demonstrated as being higher than malnutrition.
A similar study in the rural area of Guatemala found a much higher prevalence (7.6%) of malnutrition(14) and some
strongly associated socio-economic factors to this result, akin to this study. In Porto Alegre, high prevalence for mal-nutrition and mal-nutritional risk was found in a district of the municipality (38.1% and 61.9%, respectively)(17).
A higher prevalence for general overweight risk, mal-nutrition, and the differences between these alterations was found in the rural and urban population. The rural popula-tion demonstrated a higher prevalence of malnutripopula-tion and nutritional risk, while the urban population demonstrated a higher risk prevalence to overweight. This is an impor-tant finding, since it can be confirmed by the nutritional transition that has possibly reached the urban area already, but not the rural area in the municipality. It also shows the coexistence of two opposite and severe nutritional prob-lems, relevant to public health. Other studies(10) found
simi-lar results in Pelotas, Rio Grande do Sul.
A study using IBGE (Brazilian Institute of Geography and Statistics) data showed that the lower the income, the higher the prevalence of malnutrition over obesity. And the higher the income, the higher the prevalence of obesity over malnutrition(8), as well as other studies(10), supporting
An increased prevalence of obesity risk was found in a study with schoolchildren in the municipality of Franca, São Paulo, supporting the findings in this study(18).
Other indexes such as height/age and weight/height were used in addition to the diagnosed nutritional alterations ac-cording to the weight/age index (malnutrition, nutritional risk and overweight risk). The first is an important param-eter since it detects low height, the indicator for a multi-faced privation with prevalence currently considered as a suitable indicator to express the quality of a population’s conditions of life, and of chronic malnutrition(1,3).
The normal share of genetically small children varies between 2 and 3%(16). It is a low value when compared to
the Brazilian rate (10.4%), similar to the Center-South re-gion (5.6%) and very low when compared to the Northeast region (17.9%)(8). In a study in Pelotas, 25.9%, 14.4% and
3.5% were found respectively for the height/age, weight/ age and weight/height indexes(14).
In the specific case of height deficit, the most probable cause is an association between a deficient diet and the oc-currences of previous infections, reflecting the past life of the child, especially the dietary conditions and morbidity(13).
Eighty-eight children (6.7%) showed lower height than expected for their age, and among them, 29 also demon-strated alterations in the weight/age indexes. Of the total malnourished children, 58% had chronic malnutrition. Therefore, in addition to having their growth and develop-ment compromised, in some way, on a long term basis, these children are currently nutritionally compromised, characterizing a high chronic malnutrition rate.
The weight/height index holds a complementary fea-ture. It is highly sensitive to overweight and able to de-tect acute malnutrition. When analyzing the weight/age index compared to the weight/height index, approximately one third of the malnourished population (34%, n=17) have acute malnutrition. These findings support the value of chronic malnutrition found in this study. Hence, among malnourished children, the chronic malnutrition and acute malnutrition proportions indicated by complementary in-dexes agree; around 58% and 34%, respectively. From this total of 50 malnourished individuals, only 04 (8%) were not detected by the complementary indexes used in the study to classify chronic and acute scenarios. The value for overweight was very close to the one tracked by the
weight/age index, also demonstrating accordance among data(12).
In São Paulo, a study performed in five cities also found a prevalence of obesity higher than low height and malnu-trition(18). The phenomenon described as nutritional
tran-sition shows the coexistence of the same community pre-senting malnutrition and overweight/obesity(19). Many
stud-ies point out those children who are affected by chronic malnutrition can potentially become obese in adult life(3,19).
Also, specific and non-specific risk factors strongly as-sociated to malnutrition can be observed. Some of these factors are highly related to socio-economic conditions sup-porting the idea that poverty is the fundamental cause of insufficient food intake. A good example is the low weight at birth, a variable that is almost always associated to poor life conditions, deficient food intake and maternal poor nutrition(20).
Another important factor in this scenario was the rela-tively increased risk for those that receive Family Support Program aid. Considering this data, it is possible to infer that the benefit would be directly related to those who re-ally need it; in other words, it is being well applied.
CONCLUSION
The possibility of determining the real growth of the children in this study is limited due do the cross-sectional study design. A longitudinal study could allow for the vis-ibility of changes in growth on a long-term basis, better indicated for growth patterns.
These results point out the importance and need of the nutritional surveillance program guiding health services to an active investigation of this population’s nutritional sta-tus, not restricted to service users. It is necessary to ac-knowledge the fundamental role of the mothers of chil-dren with nutritional alterations and of health profession-als. These subjects, in a partnership, can develop strategies and find solutions for the suitable control of the nutritional status of the municipality’s children.
Also, it clearly illustrates the nutritional transition that has already reached the urban area of the studied munici-pality. The findings of this study are important to signal the fact that nutritional interventions must deal with the prob-lems pointed out, especially in municipalities with similar characteristics to the one observed in this study.
REFERENCE
1. Monte CMG. Desnutrição: um desafio secular à nutrição infan-til. J Pediatr. 2000;76 Supl 3:S285-97.
2. Leão E, Corrêa EJ, Mota JAC, Viana MB. Pediatria ambulatorial. 4ª ed. Belo Horizonte: COOPMED; 2005.
4. Alves CRL, Viana MRA. Saúde da família: cuidando de crianças e adolescentes. Belo Horizonte: COOPMED; 2003.
5. Taddei JAAC, Rodrigues EM, Leite MG, Colugnati FAB, Sigulem DM. Estudos populacionais em nutrição e saúde. In: Anais da 49ª Reunião Anual da SBPC; 1997; Belo Horizonte, BR. Belo Horizonte: SBPC; 1997. p.173-6.
6. Fundo das Nações Unidas para a Infância (UNICEF). Panorama: Brasil - Estatísticas 2004 [texto na Internet]. [citado 2007 dez. 20]. Disponível em: http://www.unicef.org/spanish/ infobycountry/brazil_statistics.html
7. Mackey M, Montgomery JMA. Plant biotechnology can enhance food security and nutrition in the developing world part 1. Nutr Today. 2004;39(1):52-8.
8. Monteiro CA. Velhos e novos males da saúde no Brasil: a evo-lução do país e de suas doenças. 2ª ed. São Paulo: Hucitec/ Nupens/USP; 2000.
9. Kac G, Velásquez-Meléndez G. A transição nutricional e a epidemiologia da obesidade na América Latina. Cad Saúde Pú-blica. 2003;19 Supl. 1:S4-5.
10. Barros AJD, Victora CG, Santos IS, Matijasevich A, Araújo CL, Barris FC. Infant malnutrition and obesity in three population-based birth cohort studies in Southern Brazil: trends and differences. Cad Saúde Pública. 2008;24 Supl. 3:S417-26. 11. Ferros. Secretaria Municipal de Saúde. Sistema de
Informa-ção da AtenInforma-ção Básica (SIAB). Ferros (MG); 2005.
12. Fagundes AA, Barros DC, Duar HA, Sardinha LMV, Pereira MM, Leão MM. Vigilância alimentar e nutricional – SISVAN: orienta-ções básicas para coleta, processamento, análise de dados e infor-mações em serviços de saúde. Brasília: Mistério da Saúde; 2004.
13. Brasil. Ministério da Saúde. Secretaria de Políticas de Saúde. Departamento de Atenção Básica. Saúde da Criança: acom-panhamento do crescimento e desenvolvimento infantil. Brasília; 2002.
14. Post CLA, Victora CG, Barros AJD. Entendendo a baixa preva-lência de déficit de peso para estatura em crianças brasileiras de baixo nível socioeconômico: correlação entre índices an-tropométricos. Cad Saúde Pública. 2000;16(1):73-82. 15. Sereebutra P, Solomons N, Aliyu MH, Jolly PE.
Sociodemo-graphic and environmental predictors of childhood stunting in rural Guatemala. Nutr Res. 2006;26(1):65-70.
16. Monteiro CA, Benício MHD, Konno SC, Silva ACF, Lima ALL, Conde WL. Causas do declínio da desnutrição infantil no Bra-sil, 1996-2007. Rev Saúde Pública. 2009;43(1):35-43. 17. Cuervo MRM, Aerts DRGC, Halpern R. Nutritional status
surveillance of children in a health district in southern Brazil. J Pediatr. 2005;81(4):325-31.
18. Cano MAT, Pereira CHC, Silva CCC, Pimenta JN, Maranha PS. Estudo do estado nutricional de crianças na idade escolar na cidade de Franca-SP: uma introdução ao problema. Rev Ele-trônica Enferm [periódico na Internet]. 2005 [citado 2007 dez. 15];7(2):[cerca de 6 p.]. Disponível em: http://www.fen.ufg.br /revista/revista7_2/pdf/ORIGINAL_05.pdf