ORIGINAL ARTICLE
Generalized Anxiety Disorder (GAD) and Comorbid Major Depression
with GAD Are Characterized by Enhanced Nitro-oxidative
Stress, Increased Lipid Peroxidation, and Lowered Lipid-Associated
Antioxidant Defenses
Michael Maes1,2,3,4 &Kamila Landucci Bonifacio1&Nayara Rampazzo Morelli1&Heber Odebrecht Vargas1& Estefânia Gastaldello Moreira1&Drozdstoy St. Stoyanov3&Décio Sabbatini Barbosa1&André F. Carvalho5,6& Sandra Odebrecht Vargas Nunes1
Received: 11 February 2018 / Revised: 30 March 2018 / Accepted: 13 April 2018 #Springer Science+Business Media, LLC, part of Springer Nature 2018
Abstract
Accumulating evidence shows that nitro-oxidative pathways play an important role in the pathophysiology of major depressive disorder (MDD) and bipolar disorder (BD) and maybe anxiety disorders. The current study aims to examine superoxide dismutase (SOD1), catalase, lipid hydroperoxides (LOOH), nitric oxide metabolites (NOx), advanced oxidation protein products (AOPP), malondialdehyde (MDA), glutathione (GSH), paraoxonase 1 (PON1), high-density lipoprotein cholesterol (HDL), and uric acid (UA) in participants with and without generalized anxiety disorder (GAD) co-occurring or not with BD, MDD, or tobacco use disorder.Zunit-weighted composite scores were computed as indices of nitro-oxidative stress driving lipid and protein oxidation. SOD1, LOOH, NOx, and uric acid were significantly higher and HDL and PON1 significantly lower in participants with GAD than in those without GAD. GAD was more adequately predicted by increased SOD + LOOH + NOx and lowered HDL + PON1 composite scores. Composite scores of nitro-oxidative stress coupled with aldehyde and AOPP produc-tion were significantly increased in participants with comorbid GAD + MDD as compared with all other study groups, namely MDD, GAD + BD, BD, GAD, and healthy controls. In conclusion, GAD is characterized by increased nitro-oxidative stress and lipid peroxidation and lowered lipid-associated antioxidant defenses, while increased uric acid levels in GAD may protect against aldehyde production and protein oxidation. This study suggests that increased nitro-oxidative stress and especially increased SOD1 activity, NO production, and lipid peroxidation as well as lowered HDL-cholesterol and PON1 activity could be novel drug targets for GAD especially when comorbid with MDD.
* Michael Maes
https://scholar.google.com.br/
citations?user=1wzMZ7UAAAAJ&hl=pt-BR&oi=ao
Kamila Landucci Bonifacio [email protected] Nayara Rampazzo Morelli [email protected] Heber Odebrecht Vargas [email protected] Estefânia Gastaldello Moreira [email protected] Drozdstoy St. Stoyanov [email protected] Décio Sabbatini Barbosa [email protected]
André F. Carvalho [email protected] Sandra Odebrecht Vargas Nunes [email protected]
1 Health Sciences Graduation Program, Health Sciences Center, State
University of Londrina, Londrina, Parana, Brazil
2 Department of Psychiatry, Faculty of Medicine, Chulalongkorn
University, Bangkok, Thailand
3 Department of Psychiatry, Medical University of Plovdiv and
Technological Center for Emergency Medicine, Plovdiv, Bulgaria
4 School of Medicine, IMPACT Strategic Research Centre, Deakin
University, PO Box 281, Geelong, VIC 3220, Australia
5 Department of Psychiatry, University of Toronto, Toronto, ON,
Canada
Keywords Generalized anxiety disorder .Major depressivedisorder .Bipolardisorder . Oxidativeand nitrosativestress .Immune . Inflammation
Introduction
There is evidence that activated nitro-oxidative stress path-ways may participate in anxiety and anxiety disorders (Hassan et al.2014; Bulut et al.2013). Animal models of anxiety are accompanied by multiple indices of nitro-oxidative stress including elevated generation of reactive ox-ygen radicals (ROS) and nitrogen species (RNS), including nitric oxide (NO) production; increased lipid peroxidation with formation of aldehydes, such as malondialdehyde (MDA); and lowered antioxidant enzymes including catalase and glutathione peroxidase (GPx) (Rammal et al. 2008; Hovatta et al.2005; Kumar and Chanana2017; Haider et al.
2015; Hassan et al.2013). There are only few emerging data in anxiety disorders, especially in generalized anxiety disorder (GAD) in humans. For example, Emhan et al. (2015) and Ercan et al. (2017) reported that patients with GAD demon-strate significantly higher total oxidant status and oxidative stress index than normal controls. Increased levels of lipid hydroperoxides (LOOH) in GAD, indicating increased lipid peroxidation, were reported by Bulut et al. (2013). Moreover, Emhan et al. (2015) found that GAD is accompanied by lowered total antioxidant status, suggesting that oxidative stress may play a role in GAD. Other studies found lowered levels of specific antioxidants or antioxidant enzymes in GAD, including lowered free sulfhydryl groups and paraoxo-nase 1 (PON1), namely CMPAase activities (Bulut et al.2013; Kaya et al.2013). The results in social and simple phobias and panic disorder are more controversial (Atmaca et al.2004; Hagan et al.2015; Cengiz et al.2015; Atasoy et al.2015; Gul et al. 2013). Patients with anxiety disorders also show lowered levels of uric acid than controls (Black et al.2018). Nevertheless, it remains unclear how specific aspects of the nitro-oxidative pathways ranging from antioxidant defenses to SOD activity, ROS production, lipid peroxidation, and the generation of aldehydes and oxidation protein products are differently altered in anxiety disorders or GAD.
There is a strong comorbidity between mood and anxiety disorders (Maes et al.1994b; Merikangas et al.2007) with the 12-month and lifetime prevalence of anxiety being as high as 57.5–59.2% (Culpepper2008; Fava et al.2000). Among pa-tients with major depression (MDD), prevalent anxiety disor-ders are social phobia (27.0%), simple phobia (16.9%), panic disorder (14.5%) and GAD (10.6%) (Fava et al. 2000). Interestingly, GAD is thought to belong to the mood disorders spectrum especially being related to MDD (Mennin et al.
2008). Among patients with bipolar disorder (BD), comorbid anxiety disorders may occur in up to 75% of individuals
(Hawke et al.2013) with a high prevalence of GAD, social (13.3%), and specific phobias (10.8%) and panic disorder (16.8%) (Hawke et al.2013; Nabavi et al.2015; Otto et al.
2004; Annigeri et al.2011; Peng and Jiang2015).
There is now abundant evidence that both MDD and BD are characterized by lowered lipid-associated antioxidant de-fenses which protect against damage to lipids, including atten-uated activities of lecithin cholesterol acyltransferase (LCAT), glutathione peroxidase (GPx), and PON1 and lowered plasma concentrations of vitamin E, high-density lipoprotein (HDL)-cholesterol, and coenzyme Q10 (Maes et al. 1994a, 1997,
1999a,2000,2009; Sobczak et al.2004; Tsuboi et al.2006; Bortolasci et al.2014a; Nunes et al.2015; Moreira et al.2017; Liu et al.2015). Secondly, these attenuated antioxidant de-fenses may contribute to increased generation of ROS and damage to lipids as measured with LOOH and oxidative indi-ces of damage to lipid membranes (Peet et al.1998; Maes et al.1996,1999a,2011a,b; Moylan et al. 2014; Liu et al.
2015). Thirdly, findings in depression also show elevated pro-duction of inducible NO synthase (iNOS) and NO, which together with increased ROS may increase the potential to form peroxynitrite (Gałecki et al. 2012; Maes 2008; Maes et al.2011b). Fourthly, different papers and meta-analyses report increased MDA or thiobarbituric acid reactive sub-stances (TBARS) in MDD and BD (Bilici et al. 2001; Khanzode et al.2003; Ozcan et al.2004; Maes et al.2011a; Liu et al.2015; Mazereeuw et al.2015; Andreazza et al.2008; Brown et al.2014).
Fifthly, patients with depression also show increased plas-ma levels of advanced oxidation protein products (AOPP), as observed in prenatal depression and depression due to chronic apical periodontitis (Gomes et al. 2017; Roomruangwong et al.2017). A recent meta-analysis shows elevated levels of uric acid in patients with BD as compared with MDD patients and healthy controls (Bartoli et al.2016). Uric acid is a major antioxidant in human blood, although increased levels may have pro-oxidant effects in the cell (Sautin and Johnson
2008). Nevertheless, there are no data whether the co-occurrence of mood and anxiety disorders is accompanied by more aberrations in nitro-oxidative pathways.
nitrosative stress (O&NS) pathways and that the co-occurrence with mood disorders is associated with further in-creases in these pathways.
Subjects and Methods
Participants
In this cross-sectional study, we recruited 172 participants, 91 without and 81 with DSM-IV-TR anxiety disorders, namely generalized anxiety disorder (GAD), social phobia, simple phobia, and panic disorder. The study included 46 patients with GAD and 126 without GAD. All subjects were Brazilian, all ethnicities (self-declared), aged 20 to 63 years, and of both genders. They were outpatients ad-mitted to the Psychiatry Department at the University Hospital of the State University of Londrina (UEL), Parana, Brazil, or healthy volunteers recruited by word of mouth from the same catchment area. We included individ-uals with any of these four anxiety disorders, MDD, BD, and tobacco use disorder (TUD). One hundred and five of the participants had co-occurring BD (n= 68) or MDD (n= 37). The BD and MDD patients were all in (partial) remission and the index episode was not of (hypo)manic polarity. We excluded healthy controls and patients when they had other axis-1 DSM-IV-TR disorders, including au-tism, schizophrenia, schizo-affective disorder, substance abuse, and psycho-organic syndromes. We also excluded controls and patients with neuroinflammatory and neuro-degenerative disorders (including multiple sclerosis, Alzheimer’s disease, Parkinson’s disease) and subjects with immune-inflammatory disorders, including psoriasis, rheumatoid arthritis, chronic obstructive pulmonary dis-ease, cancer, chronic kidney disdis-ease, systemic lupus ery-thematosus, type 1 diabetes, hepatitis B and C virus, and HIV infection. Also, controls and patients treated with im-munoregulatory drugs such as glucocorticoids, nonsteroi-dal antiinflammatory drugs, interferon, herbal, antioxidant, and omega-3 polyunsaturated fatty acid supplements were excluded. Pregnant women were not allowed to participate in this study. Some participants were treated with antide-pressants (n= 44), lithium (n= 26), atypical antipsychotics (n= 32) or anticonvulsant mood stabilizers (n= 33). All participants gave written informed consent to take part in the current study, whose experimental procedures were previously approved by the Research Ethics Committee at UEL (protocol number: CAAE 34935814.2.0000.5231).
Methods
The clinical diagnoses of anxiety disorders, MDD, BD, and nicotine dependence or TUD were made by a research
psychiatrist using the diagnostic criteria of the Diagnostic and Statistical Manual of Mental Disorders, 4th Edition, Text Revision(DSM-IV-TR) and a validated Portuguese ver-sion of the structured clinical interview for DSM-IV interview (SCID) axis I (Del-Ben et al.2001; APA2000). A structured interview comprised socio-demographic (marital status, self-declared ethnicity, years of education, employment status) and clinical (number of previous depressive, hypomanic, and man-ic episodes) data. The Hamilton Anxiety Rating Scale A) and the 17-item Hamilton Depression Rating Scale (HAM-D) were employed to measure severity of anxiety and depres-sion, respectively (Hamilton1959,1960). The Young Mania Rating Scale (YMRS) was used to measure severity of manic symptoms (Vilela et al.2005). We used the Alcohol, Smoking, and Substance Involvement Screening Test (ASSIST) to as-sess misuse of alcohol and hypnotics (WHO Assist Working Group.2002; Henrique et al.2004). Body mass index (BMI) was computed according to weight (in kg) divided by square of height (in m2).
Assays
Peripheral fasting (12 h) blood was sampled at 8 a.m. the same day as the diagnosis was made and clinical data were collected. We measured the activities of SOD, CAT, and PON1 and the concentrations of LOOH, NOx, MDA, uric acid, reduced glutathione (GSH), HDL-cholesterol, and AOPP. SOD1 activity in erythrocytes was determined using the pyrogallol method described by Marklund and Marklund (1974). This technique is based on the inhibition of pyrogallol self-oxidation by SOD in aqueous solution. The assay was conducted in a spectrophotometer Helios A, Thermo Spectronic (Waltham, MA, USA) at 420 nm and 37 °C. During 5 min, variation in optical density (OD) was recorded every minute. The level of SOD that inhibited 50% of the pyrogallol oxidation was defined as one unit of enzymatic activity. The results were expressed U/mg of hemoglobin (Hb). Measurement of CAT activity was esti-mated through the difference between the initial reading and the reading conducted 30 s after the addition of 200 mM H2O230% at 240 nm in a microplate reader
(mod-el EnSpire, PerkinElmer, USA) with the temperature main-tained at 25 °C. CAT values are expressed as units per milligram of Hb. LOOH are assayed by chemilumines-cence (CL-LOOH) (Gonzalez et al. 1991; Panis et al.
adaptation of the technique described by Navarro-Gonzalvez et al. (1998). This method is based on the re-duction of the nitrate present in the sample to nitrite by oxidation-reduction reactions mediated by the system cadmium-copper reagent. Thereafter, Griess reagent was added to induce diazotization, forming a colored complex and subsequent detection at 540 nm. The quantification of NOx was made in a microplate reader Asys Expert Plus, Biochrom (Holliston, MA, USA). NOx concentrations were expressed in molars. MDA levels were measured through complexation with two molecules of thiobarbituric acid (TBA) using MDA estimation through high-performance liquid chromatography (HPLC Alliance e2695, Waters’, Barueri, SP, Brasil) (Bastos et al. 2012). Experimental conditions included the use of a column Eclipse XDB-C18 (Agilent, USA), mobile phase consisting of 65% phosphate buffer (50 nM pH 7.0) and 35% HPLC grade methanol, flow rate of 1.0 mL/min, tem-perature of 30 °C, and wavelength of 532 nm. MDA con-centration in the samples was quantified based on a cali-bration curve and is expressed in millimoles of MDA per milligram of proteins. HDL cholesterol was measured by enzymatic colorimetric method in an automated clinical chemistry system (Dimension RXL, Siemens, USA). GSH was measured with a kinetic/colorimetric method using hemolysate (diluted 1/40) as the sample following the technique described by Tietze (1969) and Anderson (1985). Uric acid was measured by an U.V. enzymatic method (direct equilibrium uricase method) in an automat-ed clinical chemistry system (Dimension RXL, Siemens, USA). PON1 status (i.e., PON1 total activity and PON1 Q192R polymorphism) was measured using three kinetic assays (Richter et al.2009) conducted in a microplate read-er (EnSpire, Pread-erkinElmread-er, USA). To stratify individuals in the functional genotypes for the PON1 Q192R polymor-phism (QQ, QR, and RR), the substrates used were phenyl acetate (PA, Sigma, USA) under high salt condition and 4-(chloromethyl)phenyl acetate (CMPA, Sigma, USA), which is an alternative to the use of the toxic paraoxon. PON1 total activity was determined by the rate of hydro-lysis of phenyl acetate under low salt condition at 270 nm and 25 °C. The activity was expressed in units per milliliter based on the phenyl acetate molar extinction coefficient of 1.31 mmol/L/cm. In the present study, we adjusted PON1 activity values for the genotypes and used the residualized values in subsequent analyses. AOPP was quantified using the method described by Hanasand et al. (2012) in a mi-croplate reader, PerkinElmer, model EnSpire (Waltham, MA, USA) at a wavelength of 340 nm. AOPP concentra-tion was expressed in molars of equivalent chloramine T. All interassay CV values for all assays were < 7%.
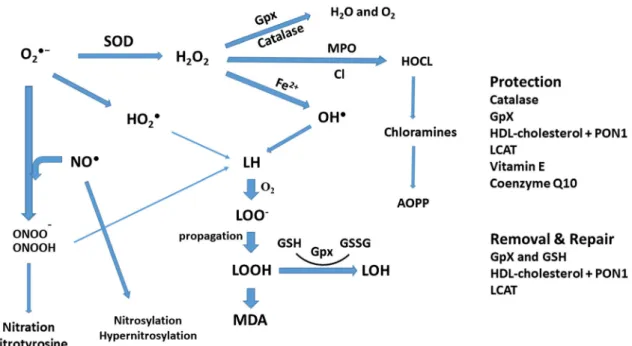
Figure1 shows the paths from superoxide formation to lipid peroxidation and aldehyde and AOPP formation. In
order to examine these pathways and the antioxidant defenses (CAT, GSH, PON1, HDL-cholesterol), we computed compos-ite scores reflecting different parts of the pathways.
Use ofzUnit-Weighted Composite Scores
Using the separate O&NS biomarkers, one may estimate the separate activities of antioxidant enzymes (SOD1, catalase, PON1) and products of lipid peroxidation (LOOH), aldehyde production (MDA), and protein oxidation (AOPP). Nevertheless, these values do not allow to examine the bal-ance between pro-oxidant and antioxidant profiles as well as the pathways from ROS production to nitro-oxidative dam-age. In order to estimate pro-oxidative/antioxidant balances and the activity of nitro-oxidative pathways, we have comput-edzunit-weighted composite scores. The advantage of using composite scores was explained previously using cytokine and nitro-oxidative data (Maes et al. 1998,1999b; Kubera et al.2001; Sowa-Kućma et al.2017,2018; Guimarães et al.
2017; Moraes et al.2018). Recently, we have summarized the rationale to computezunit-weighted composite scores (Maes and Carvalho2018). For example, to estimate the combined protective effects of PON1 and HDL-cholesterol (see the BIntroduction^andBDiscussion^sections), we have comput-ed a composite score aszvalue of PON1 (zPON1) +z HDL-cholesterol. Since both data are expressed in different units, it is not possible to use a simple sum of both factors. Both variables however become comparable after standardization for example using aztransformation, which is the actual value of the measurement in relation to the standard deviation of the sample. Another advantage is that the computed z
unit-weighted composite score indicates the location of a patient (or a group of patients) in thez(zPON1 +zHDL-cholesterol) data distribution with mean = 0 and SD = 1. In the present study, we computed the followingzcomposite scores:
a) zSOD1 + LOOH computed asztransformation of SOD values (zSOD1) +zLOOH. SOD is an antioxidant en-zyme which partitions superoxide radicals into oxygen and hydrogen peroxides (Fukai and Ushio-Fukai2011; McCord and Edeas 2005; Hayyan et al. 2016). Importantly, SOD1 mRNA is constitutively expressed and is additionally regulated by (patho)physiological fac-tors (Zelko et al.2002; Miao and St Clair2009). SOD1 expression is stimulated by hydrogen peroxide, nitric ox-ide, arachidonic acid, and T cell-mediated mechanisms (Zelko et al.2002; Harris1992; Terrazzano et al.2014). Moreover, the SOD1 promotor has a nuclear factor (NF)-κB site which is responsive to the PI3K/Akt path-way (Rojo et al.2004). Thus, while SOD1 functions as an antioxidant mediating superoxide (O2●−) dismutation it is
immune activation. Depending on the activity of catalase and GPx and Fe2+levels (see Fig.1), this may contribute
to elevated production of hydroxyl (OH●) radicals (Girotti
1998). Hydrogen peroxides and hydroxyl radicals induce the formation of LOOH, which is mainly derived from cholesterol and unsaturated phospholipids (Girotti
1998). Therefore, the sumzLOOH +zSOD reflects ROS (e.g., hydrogen peroxide + hydroxyl radical production) driving lipid peroxidation.
b) zSOD + LOOH + NOx computed aszSOD +zLOOH +
zNOx. This z-based composite score reflects peroxide, peroxyl, and hydroxyl production coupled with the pro-duction of NO, which together with superoxide increases the potential to form peroxynitrite (Girotti1998; Pacher et al.2007). Therefore, this score reflects ROS + RNS production or nitro-oxidative stress leading to lipid (and protein) oxidation.
c) z(zSOD +zLOOH +zNOx) +zMDA computed as
z(zSOD +zLOOH +zNOx) +zMDA. MDA is the end product of lipid peroxidation. Therefore, this score re-flects the path from ROS/RNS (nitro-oxidative stress) to lipid peroxidation and ultimately aldehyde production (Maes et al.2011a).
d ) z(zSOD +L OOH +N Ox) +zAOPP computed as z(zLOOH +zSOD +zNOx) +zAOPP. This z unit-weighted composite score reflects the path from in-creased ROS/RNS production leading to protein oxida-tion (AOPP) via increased ROS and peroxynitrite pro-duction coupled with increased myeloperoxidase (MPO) activity and hypochlorous acid production (Witko-Sarsat et al.1996).
e) z(zSOD +zLOOH +zNOx) +z(MDA + AOPP) computed asz(zLOOH +zSOD +zNOx) +z(MDA +zAOPP). This is an integrate index of nitro-oxidative stress leading to lipid peroxidation with aldehyde formation and protein oxidation.
f) zCAT + GSH computed as zCAT +zGSH. This z unit-weighted composite score reflects part of the antioxidant defenses against lipid peroxidation. Catalase and GPx cat-alyze the decomposition of peroxides into oxygen and water, while GPx (and GSH, which maintains GPx levels) degrades LOOH into the harmless LOH.
g) zHDL + PON1 computed aszHDL-cholesterol +zPON1. This score reflects lipid-associated antioxidant defenses through HDL-cholesterol and PON1 activity which pro-tects against lipid peroxidation and may remove lipid per-oxides and aldehydes from the circulation.
Fig. 1 Increased superoxide (O2●−) is frequently associated with
activated superoxide dismutase (SOD) activity. SOD catalyzes O2●−into
peroxides (H2O2). Catalase and also glutathione peroxidase (Gpx)
acti-vate the decomposition of H2O2into water and oxygen. In the presence of
Fe2+(the Fenton reaction), highly reactive hydroxyl radicals (OH●) are
formed which coupled with peroxynitrite (ONOO−) and perhydroxyl
rad-icals (HO2●) damage lipid membranes, thereby generating fatty acid
rad-icals which react with oxygen to form lipid peroxy (LOO−) radicals. The
latter in turn react with other lipids thereby generating lipid hydroperox-ides (LOOH). This further damages lipid membranes, and consequently, aldehydes are formed including malondialdehyde (MDA). Increased myeloperoxidase (MPO) activity may generate the very reactive
hypochlorous acid (HOCl), which may lead to damage to proteins includ-ing the generation of advanced oxidation protein products (AOPPs). Increased nitric oxide production (NO) coupled with increased O2●−
gen-erates peroxynitrite (ONOO−) which leads to lipid peroxidation.
Moreover, increased NO and peroxynitrite production may damage pro-teins through formation of nitrotyrosine (through nitration) and NO ad-ducts (through nitrosylation), respectively (Roomruangwong et al.2018; Morris et al.2017). Antioxidant defenses protect against lipid peroxida-tion and may repair and remove lesions, including glutathione peroxidase (Gpx), catalase,L-lecithin/cholesterol acyltransferase (LCAT),
h) zsum5OX−zsum4ANTIOX computed as z(zSOD +
zLOOH +zNOx +zMDA +zAOPP)−z(z HDL-choles-terol +zPON1 +zGSH +zCAT). This composite score re-flects the balance between overall nitro-oxidative stress and antioxidant defenses.
i) zUric acid was introduced in the analysis as a separate
variable because uric acid may act as an antioxidant and pro-oxidant.
Statistical Analyses
We used analyses of variance (ANOVAs) to compute differ-ences in scale variables between diagnostic groups and anal-yses of contingency tables (χ2tests) to assess differences in
nominal variables between diagnostic groups. Results of mul-tiple comparisons were p-corrected for false discovery rate according to Benjamini and Hochberg (1995). We employed binary logistic regression analyses to assess the most signifi-cant predictors of diagnosis, e.g., GAD as dependent variable and no GAD as reference group. Odds ratios and 95% confi-dence intervals are computed and Nagelkerke values are employed as effect size estimates. We used multivariate GLM analysis with the nitro-oxidative stress biomarkers as dependent variables and diagnosis as primary explanatory var-iable, while adjusting the data for sex, age, BMI, education, and TUD. Consequently, we used tests for between-subject effects to assess the effects of explanatory variables on the separate O&NS biomarkers. We computed model-derived es-timated marginal means to assess differences among diagnos-tic categories. In order to analyze the comorbidity between mood and GAD (or anxiety disorders), we use multivariate GLM analyses to examine differences in the biomarkers among the study groups with or without GAD (or anxiety disorders) yielding six study groups, namely (a) controls, (b) GAD, (c) BD, (d) BD + GAD, (e) MDD, and (f) MDD + GAD. IBM SPSS Windows version 22, Statistica 8, and Stata were used to analyze all data. Statistical significance was set at 0.05, two-tailed.
Results
Descriptive Statistics
Table1 shows the demographic and clinical data in partici-pants with and without GAD. After p-correction for false dis-covery rate, we found higher HAM-D and HAM-A scores in GAD patients as compared with those without GAD, while there were no differences in the YMRS score. There was a significant association between GAD and simple and social phobias and mood disorders (either BD or MDD), but not between GAD and panic disorder or TUD. There were no
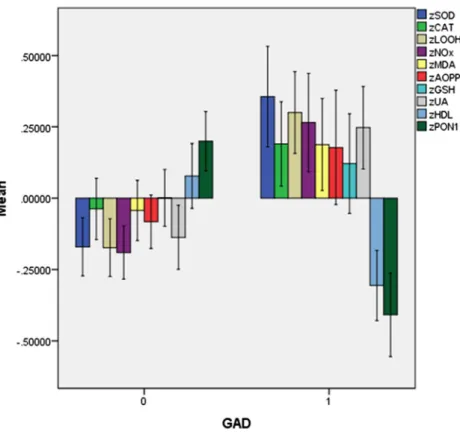
significant differences in age, sex, education, BMI, and em-ployment and marital status, and number of depressive and (hypo)manic episodes between both groups. Table 1 shows also the raw data for the 10 biomarker measurements and the results of univariate ANOVAs. We want to stress that these raw data are not interpretable because the results were not adjusted for age, sex, BMI, TUD, and the presence of mood disorders. Below we will present the adjusted data. Figure2
shows thez-transformed values of these 10 O&NS biomarkers
(unadjusted data) in participants with and without GAD. The intercorrelation matrix among the 10 O&NS bio-markers showed that there were significant and positive cor-relations (without p-correction) between CAT and GSH (r= 0.385, p< 0.001, n= 143), SOD1 and MDA (r= 0.331,
p< 0.001,n= 146), LOOH and AOPP (r= 0.253,p< 0.001,
n= 149), SOD1 and GSH (r= 0.277,p= 0.001,n= 143), uric acid and AOPP (r= 0.478,p< 0.001,n= 147), and PON1 and HDL-cholesterol (r= 0.296,p< 0.001,n= 149). There were significantly inverse correlations between LOOH and PON1 (r=−0.206, p= 0.012, n= 149) and uric acid and HDL-cholesterol (r=−0.321,p< 0.001,n= 0.152). There were al-so significant and negative correlations between zHDL+ PON1 and zSOD + LOOH (r=−0.195,p= 0.018,n= 145),
zSOD + LOOH + NOx (r=−0.229, p= 0.007, n= 137),
z(zSOD +zLOOH +zNOx) +zMDA (r=−0.247, p= 0.004,
n= 136), z(zSOD +zLOOH +zNOx) +zAOPP (r=−0.345, p< 0.001,n= 137), AOPP (r=−0.293,p< 0.001, n= 149) and z(zSOD +zLOOH +zNOx) +z(MDA + AOPP) (r=−
0.356,p< 0.001,n= 136).
Differences in O&NS Biomarkers Among Patients
with and without GAD
We have examined whether the effects of GAD were still present after considering the effects of severity of anxiety and severity of mood disorders by entering HAM-A and HAM-D and YMRS, respectively. Multivariate GLM analysis no. 2 shows that HAM-A has a significant effect on the biomarkers and that the effects of GAD and GAD × TUD remained sig-nificant. Tests for between-subject effects show that HAM-A score is positively associated with LOOH (F= 8.48, df = 1/ 106,p= 0.004; partial eta squared = 0.074) and AOPP (F= 7.40, df = 1/106, p= 0.008; partial eta squared = 0.065). Multivariate GLM analysis no. 3 shows that HAM-D, but
not YMRS, has a significant effect on the 10 biomarkers, while the effects of GAD and GAD × TUD remained signif-icant. Tests for between-subject effects show that the HAM-D score is positively associated with LOOH (F= 5.38, df = 1/ 114, p= 0.022; partial eta squared = 0.045) and AOPP (F= 20.10, df = 1/114,p< 0.001; partial eta squared = 0.150).
We also performed similar multivariate GLM analyses with the presence of other anxiety disorders (social phobia, simple phobia, or panic disorder) (F= 1.50, df = 10/108,p= 0.148) and all anxiety disorders combined (GAD, social phobia, sim-ple phobia, or panic disorder) (F= 1.91, df = 10/107,p= Table 1 Socio-demographic, clinical, and biomarker data in participants with and without generalized anxiety disorders (GAD)
Variables No GAD (n= 126) GAD (n= 46) F df pb
Age (years) 43.0 (11.4) 42.3 (10.7) 0.12 1/170 0.728
Sex (F/M) 94/32 35/11 0.04 1 0.842
Education (years) 11.5 (5.5) 10.3 (4.2) 1.66 1/169 0.199 Body mass index (kg/m2) 26.5 (5.0) 26.4 (4.2) 0.01 1/163 0.919
Employment status (no/yes) 51/74 22/24 0.68 1 0.410 Single/married/separated + widowed 32/70/24 6/27/13 3.72 2 0.156 HAM-D 6.1 (6.0) 10.2 (7.2) 14.08 1/170 < 0.001 (0.005)
YMRS 1.4 (2.6) 1.6 (2.3) 1.35 1/170 0.643
HAMA 10.2 (8.6) 17.1 (12.0) 16.0 1/159 < 0.001 (0.005) Number depressive episodes 2.9 (4.3) 4.2 (4.8) 2.43 1/161 0.121 Number manic episodes 2.2 (4.8) 3.9 (6.4) 3.33 1/170 0.070 Social phobia (no/yes) 122/4 36/10 15.53 1 < 0.001 (0.005) Simple phobias (no/yes) 108/18 25/21 18.91 1 < 0.001 (0.005) Panic disorder (no/yes) 107/19 38/8 0.14 1 0.712 No mood disorders/BD/MDD 59/44/23 8/24/14 12.36 2 0.002 (0.008) Tobacco use disorder (no/yes) 57/69 20/26 0.04 1 0.837 Antidepressants (no/yes) 87/31 27/17 2.35 1 0.125 Antipsychotics (no/yes) 98/20 32/12 2.16 1 0.142
Lithium (no/yes) 101/16 34/10 1.94 1 0.164
Mood stabilizers (no/yes) 94/23 34/10 0.19 1 0.667 SOD1 (U/mg Hb) 92.8 (38.0) 112.5 (44.0) 7.11 1/145 0.009 LOOH (RLU × 106)a 1504 (1115) 1808 (1039) 2.33 1/147 0.129
CAT (U/mg Hb) 59.4 (14.9) 63.1 (13.2) 1.91 1/144 0.169 GSH (mM/gHb) 5.64 (1.03) 5.77 (1.18) 0.40 1/141 0.530 Uric acid (mg/dL)a 4.54 (1.44) 4.93 (1.36) 2.25 1/151 0.136
MDA (mmol/mg protein)a 63.5 (21.6) 67.8 (22.0) 1.20 1/147 0.275
AOPP (μM) 77.8 (42.5) 89.3 (47.3) 1.80 1/148 0.182
NOx (μM)a 6.2 (2.7) 7.7 (4.8) 6.19 1/148 0.014
PON1 (U/L) 213.3 (55.4) 183.8 (53.7) 8.76 1/148 0.004 HDL (mg/dL) 49.8 (16.5) 44.6 (10.6) 3.60 1/157 0.060
All results are shown as mean (±SD).F: results of analyses of variance;χ2: results of analyses of contingency tables
BDbipolar disorders,MDDmajor depression,SODsuperoxide dismutase,LOOH lipid hydroperoxides,CATcatalase,GSHglutathione,MDA
malondialdehyde,AOPPadvanced oxidation protein products,NOxnitric oxide metabolites,PON1paraoxonase 1,HDLhigh-density lipoprotein cholesterol
aThese data are processed in Ln transformation
0.051) as explanatory variables (and using the same independent variables as shown in Table2) but could not find significant effects on the 10 biomarkers. This indicates that GAD, but not the other anxiety disorders, has a significant impact on the O&NS biomarkers.
Differences in Composite Scores Among Patients
with and without GAD
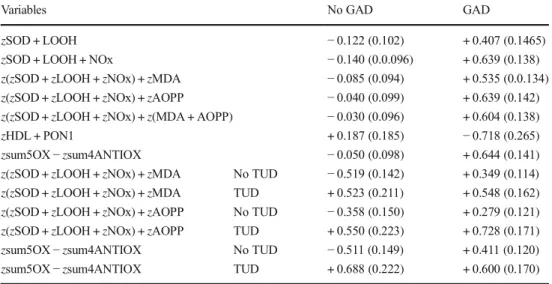
Table4, regression no. 2, shows the results of a multivar-iate GLM analysis with the nine composite scores as de-pendent variables and anxiety disorders as primary explan-atory variables, while adjusting for sex, age, education, TUD, BMI, and diagnosis (controls versus MDD versus BD). There was a significant effect of GAD (regression no. 1) on the composite scores. Table5shows the model-generated estimated marginal mean values in both subjects with and without GAD.zSOD + LOOH,zSOD + LOOH + NOx, z(zSOD +zLOOH +zNOx) +zMDA, z(zSOD +
zLOOH +zNOx) +zAOPP, z(zSOD +zLOOH +zNOx) +
z(MDA + AOPP), and zsum5OX−zsum4ANTIOX were significantly higher andzHDL + PON1 significantly lower in participants with GAD than in those without GAD. Figure3 shows the different composite scores in subjects with GAD versus those without GAD.
We have also adjusted the differences between GAD and non-GAD subjects for effects of severity of illness. Multivariate analysis no. 2 shows that HAM-A has no signif-icant effect on the composite scores, while the effects of GAD and GAD × TUD remained significant. Multivariate analysis no. 3 shows that HAM-D, but not YMRS, has a significant effect on the composite scores, while the effects of GAD and GAD × TUD remain significant. There were significant ef-fects of the HAM-D on z(zSOD+zLOOH+zNOx) +zAOPP (F= 13.17, df = 1/114,p= 0.001, partial eta squared = 0.104) and z(zSOD+zLOOH+zNOx) +z(MDA + AOPP) (F= 5.07, df = 1/114, p= 0.025, partial eta squared = 0.043). We also performed a multivariate GLM analyses with the presence of any other anxiety disorder (social phobia, simple phobia or panic disorder) as explanatory variable but could not find a significant effect on the composite scores (F= 2.05, df = 7/ 111,p= 0.054).
Interaction Patterns Between Mood and Anxiety
Disorders
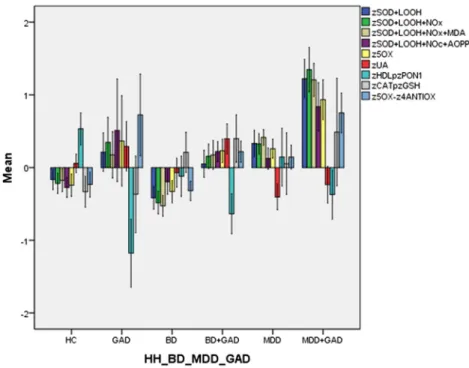
In order to examine the co-occurrence between mood and GAD, we used multivariate GLM analyses to examine the effects of diagnosis on the biomarkers, namely six study samples divided into controls, GAD, BD, BD + GAD, Fig. 2 Measurements (inz
MDD, and MDD + GAD. Figure4 shows the biomarkers in these six study groups. Multivariate GLM analysis (with sex, BMI, TUD, age, and education as extraneous variables) showed that there was a significant effect of diagnosis (F= 2.04, df = 35/565, p< 0.001; partial eta squared = 0.112) with highly significant between-subject effects on all scores, except zCAT + GSH and uric acid. Post-hoc analyses (at p< 0.05) indicate that patients with comorbid MDD + GAD have significantly higherzSOD +
LOOH, zSOD + LOOH + NOx, z(zSOD +zLOOH +
zNOx) +zMDA, z(zSOD +zLOOH +zNOx) +zAOPP,
z(zSOD +zLOOH +zNOx) +z(MDA + AOPP) values as compared with the other five study groups. Figure 4
shows that when GAD is present, these nitro-oxidative indices are higher than in subjects without GAD. Participants with MDD + GAD show more profound ab-errations in these indices as compared with the other five study groups.
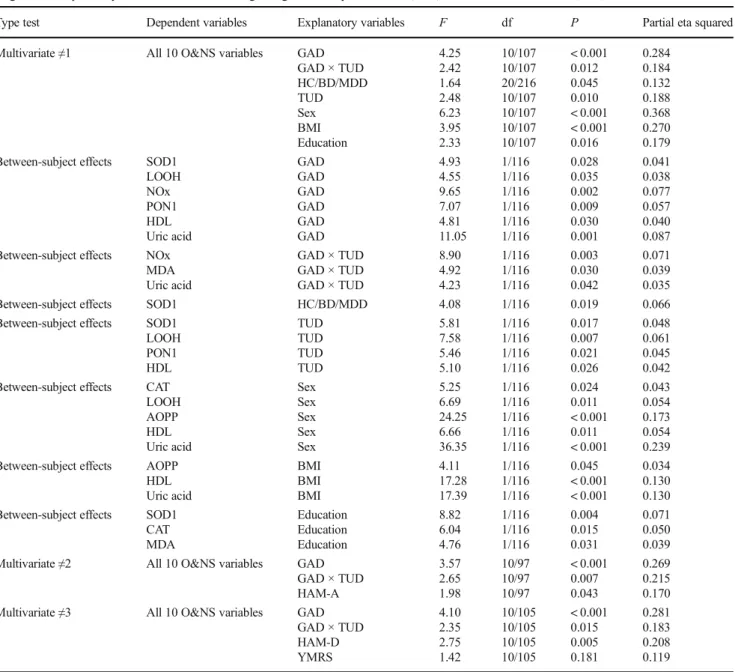
Table 2 Results of multivariate general linear model (GLM) analysis with nine oxidative and nitrosative stress biomarkers as dependent variables and diagnoses as explanatory variables, while controlling for age, sex, body mass index (BMI), and tobacco use disorder (TUD)
Type test Dependent variables Explanatory variables F df P Partial eta squared
Multivariate≠1 All 10 O&NS variables GAD GAD × TUD HC/BD/MDD TUD Sex BMI Education 4.25 2.42 1.64 2.48 6.23 3.95 2.33 10/107 10/107 20/216 10/107 10/107 10/107 10/107 < 0.001 0.012 0.045 0.010 < 0.001 < 0.001 0.016 0.284 0.184 0.132 0.188 0.368 0.270 0.179 Between-subject effects SOD1
LOOH NOx PON1 HDL Uric acid GAD GAD GAD GAD GAD GAD 4.93 4.55 9.65 7.07 4.81 11.05 1/116 1/116 1/116 1/116 1/116 1/116 0.028 0.035 0.002 0.009 0.030 0.001 0.041 0.038 0.077 0.057 0.040 0.087 Between-subject effects NOx
MDA Uric acid
GAD × TUD GAD × TUD GAD × TUD
8.90 4.92 4.23 1/116 1/116 1/116 0.003 0.030 0.042 0.071 0.039 0.035 Between-subject effects SOD1 HC/BD/MDD 4.08 1/116 0.019 0.066 Between-subject effects SOD1
LOOH PON1 HDL TUD TUD TUD TUD 5.81 7.58 5.46 5.10 1/116 1/116 1/116 1/116 0.017 0.007 0.021 0.026 0.048 0.061 0.045 0.042 Between-subject effects CAT
LOOH AOPP HDL Uric acid Sex Sex Sex Sex Sex 5.25 6.69 24.25 6.66 36.35 1/116 1/116 1/116 1/116 1/116 0.024 0.011 < 0.001 0.011 < 0.001 0.043 0.054 0.173 0.054 0.239 Between-subject effects AOPP
HDL Uric acid BMI BMI BMI 4.11 17.28 17.39 1/116 1/116 1/116 0.045 < 0.001 < 0.001 0.034 0.130 0.130 Between-subject effects SOD1
CAT MDA Education Education Education 8.82 6.04 4.76 1/116 1/116 1/116 0.004 0.015 0.031 0.071 0.050 0.039 Multivariate≠2 All 10 O&NS variables GAD
GAD × TUD HAM-A 3.57 2.65 1.98 10/97 10/97 10/97 < 0.001 0.007 0.043 0.269 0.215 0.170 Multivariate≠3 All 10 O&NS variables GAD
GAD × TUD HAM-D YMRS 4.10 2.35 2.75 1.42 10/105 10/105 10/105 10/105 < 0.001 0.015 0.005 0.181 0.281 0.183 0.208 0.119
GADgeneralized anxiety disorder,HC/BD/MDDhealthy controls/bipolar disorder/major depression,HAM-AHamilton Anxiety Rating Scale score,
HAM-DHamilton Depression Rating Scale score,YMRSYoung Mania Rating Scale,SODsuperoxide dismutase,CATcatalase,LOOHlipid hydroper-oxides,NOxnitric oxide metabolites,MDAmalondialdehyde,AOPPadvanced oxidation protein products,HDLhigh-density lipoprotein cholesterol,
A similar GLM analysis performed on the 9 O&NS bio-markers (see Fig.5for the unadjusted means inz transforma-tion) shows that diagnosis has a significant effect (F= 1.90, df = 50/545,p< 0.001, partial eta-squared = 0.143) and that SOD1 is significantly increased in MDD + GAD versus all other study groups (protected post-hoc analyses atp< 0.05).
Effects of Extraneous and Confounding Variables
Table2, regression no. 1, shows that TUD, mood disorders, sex, BMI, and education have significant effects on the 10 biomarkers. Age was not significant in the multivariate GLM analysis no. 1 of Table2 (F= 1.06, df = 10/106, p= 0.396). Tests for between-subject effects show that TUD has a significant effect on SOD1, LOOH, PON1 and HDL-cho-lesterol. The model-generated estimated marginal means in Table3show that SOD1 and LOOH are higher, and PON1
and HDL-cholesterol are lower in individuals with TUD as compared with those without TUD.
Tables2and3show significant effects of sex on LOOH, AOPP, and uric acid (higher in males) and CAT and HDL-cholesterol (higher in females). Table 2 shows also a high impact of BMI with a partial eta squared of 0.270. Tests for between-subject effects and parameter estimates show that BMI was significantly and positively associated with uric acid (F= 17.39, df = 1/114,p< 0.001; partial eta squared = 0.130)
and negatively with HDL-cholesterol (F= 17.83, df = 1/114,
p< 0.001; partial eta squared = 0.133). Tests for between-subject effects and parameter estimates show that years of education is significantly associated with SOD1 (inversely), CAT (positively), and MDA (inversely). There was also a significant effect of mood disorders on the O&NS biomarkers. However, these data will be presented in another paper on differences among BD and MDD.
We have also adjusted the results for treatment with psy-chotropic medications and use of alcohol and hypnotics. Thus, treatment with lithium (F= 1.63, df = 10/98,p= 0.109), mood stabilizers (F= 0.70, df = 10/98), atypical antipsychotics (F= 0.60, df = 10/99,p= 0.808), and use of alcohol (F= 1.30, df = 10/105,p= 0.238) and hypnotics (F= 0.51, df = 10/105,p= 0.880) was not associated with O&NS biomarkers and did not change the results shown in Table2. Nevertheless, there was a very modest but significant effect of antidepressants (F= 1.94, df = 10/99, p= 0.048) although tests for between-subject ef-fects showed only a significant effect on GSH values (F= 5.40, df = 1/108,p= 0.048, with lower levels in subjects using antidepressants than in those without, i.e., mean (± SD) z
values were−0.359 (± 0.207) versus 0.193 (± 0.142).
A similar pattern of associations was found between the composite scores and the confounder variables: TUD, GAD × TUD, sex, BMI, and education, were significant in predicting the composite scores. Subjects with TUD showed significantly higher values of different composite score as compared to non-TUD subjects, namely zSOD + LOOH
(F= 13.69, df = 1/116, p< 0.001; partial eta squared = 0.105), zSOD + LOOH + NOx (F= 6.72, df = 1/116, p= 0.011; partial eta squared = 0.055), z(zSOD +zLOOH + zNOx) +zMDA (F= 7.66, df = 1/116, p= 0.008; partial eta squared = 0.060), z(zSOD +zLOOH +zNOx) +zAOPP (F= 5.51, df = 1/116, p= 0.021; partial eta squared = 0.045),
z(zSOD +zLOOH +zNOx) +z(MDA + AOPP) (F= 7.20, df = 1/116,p= 0.008; partial eta squared = 0.058),zsum5OX
−zsum4ANTIOX (F= 5.82, df = 1/116,p= 0.017; partial eta squared = 0.098), whilezHDL + PON1 is significantly lower (F= 8.22, df = 1/116,p= 0.005; partial eta squared = 0.066) in those with TUD. Also, the GAD × TUD interaction was sig-nificant and showed sigsig-nificantly higher z(SOD+zLOOH+
zNOx) +zMDA, z(zSOD+zLOOH+zNOx) +zAOPP, and
zsum5OX−zsum4ANTIOX values in GAD subjects than in those without GAD but only in subject without TUD and not Table 3 Estimated marginal mean (SE) values (expressed inzvalues)
obtained by GLM analysis no. 1 in Table2
Variables No GAD GAD
SOD1 −0.110 (0.113) + 0.309 (0.162) LOOH −0.071 (0.108) + 0.313 (0.155) NOx −0.105 (0.11) + 0.505 (0.169) PON1 + 0.211 (0.121) −0.327 (0.74) HDL + 0.003 (0.111) −0.404 (0.160)
Uric acid + 0.006 (0.100) + 0.563 (0.144) Variables No GAD GAD NOx No TUD −0.288 (0.179) + 0.895 (0.266) NOx TUD + 0.078 (0.143) + 0.114 (0.203) MDA No TUD −0.302 (0.165) + 0.288 (0.243) MDA TUD + 0.324 (0.133) + 0.126 (0.193) Uric acid No TUD −0.004 (0.152) + 0.891 (0.227) Uric acid TUD + 0.016 (0.123) + 0.235 (0.174) Variables No TUD TUD
SOD1 −0.140 (0.160) + 0.339 (0.124) LOOH −0.141 (0.153) + 0.382 (0.118) PON1 + 0.191 (0.172) −0.307 (0.133) HDL + 0.021 (0.158) −0.422 (0.122) Variables Females Males CAT + 0.138 (0.110) −0.312 (0.177) LOOH −0.106 (0.099) + 0.348 (0.158) AOPP −0.227 (0.103) + 0.673 (0.165) HDL + 0.033 (0.102) −0.434 (0.163)
Uric acid −0.208 (0.092) + 0.777 (0.147)
GADgeneralized anxiety disorder,TUDtobacco use disorder,SOD su-peroxide dismutase,CATcatalase,LOOHlipid hydroperoxides,NOx ni-tric oxide metabolites,MDAmalondialdehyde,AOPPadvanced oxida-tion protein products,HDLhigh-density lipoprotein cholesterol,PON1
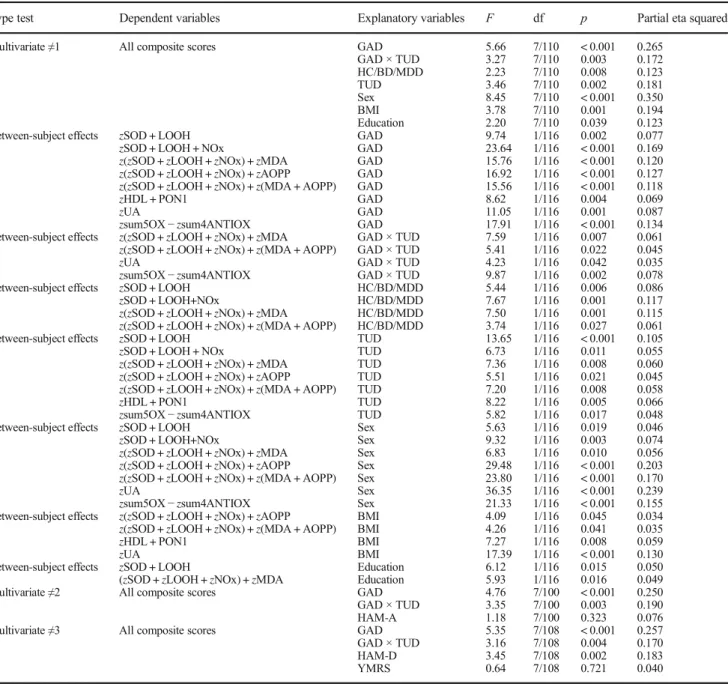
Table 4 Results of multivariate general linear model (GLM) analysis with the oxidative and nitrosative stress composite scores as dependent variables and diagnoses as explanatory variables, while controlling for age, sex, body mass index (BMI), education, and tobacco use disorder (TUD)
Type test Dependent variables Explanatory variables F df p Partial eta squared
Multivariate≠1 All composite scores GAD
GAD × TUD HC/BD/MDD TUD Sex BMI Education 5.66 3.27 2.23 3.46 8.45 3.78 2.20 7/110 7/110 7/110 7/110 7/110 7/110 7/110 < 0.001 0.003 0.008 0.002 < 0.001 0.001 0.039 0.265 0.172 0.123 0.181 0.350 0.194 0.123 Between-subject effects zSOD + LOOH
zSOD + LOOH + NOx
z(zSOD +zLOOH +zNOx) +zMDA z(zSOD +zLOOH +zNOx) +zAOPP z(zSOD +zLOOH +zNOx) +z(MDA + AOPP) zHDL + PON1
zUA
zsum5OX−zsum4ANTIOX
GAD GAD GAD GAD GAD GAD GAD GAD 9.74 23.64 15.76 16.92 15.56 8.62 11.05 17.91 1/116 1/116 1/116 1/116 1/116 1/116 1/116 1/116 0.002 < 0.001 < 0.001 < 0.001 < 0.001 0.004 0.001 < 0.001 0.077 0.169 0.120 0.127 0.118 0.069 0.087 0.134 Between-subject effects z(zSOD +zLOOH +zNOx) +zMDA
z(zSOD +zLOOH +zNOx) +z(MDA + AOPP) zUA
zsum5OX−zsum4ANTIOX
GAD × TUD GAD × TUD GAD × TUD GAD × TUD
7.59 5.41 4.23 9.87 1/116 1/116 1/116 1/116 0.007 0.022 0.042 0.002 0.061 0.045 0.035 0.078 Between-subject effects zSOD + LOOH
zSOD + LOOH+NOx
z(zSOD +zLOOH +zNOx) +zMDA z(zSOD +zLOOH +zNOx) +z(MDA + AOPP)
HC/BD/MDD HC/BD/MDD HC/BD/MDD HC/BD/MDD 5.44 7.67 7.50 3.74 1/116 1/116 1/116 1/116 0.006 0.001 0.001 0.027 0.086 0.117 0.115 0.061 Between-subject effects zSOD + LOOH
zSOD + LOOH + NOx
z(zSOD +zLOOH +zNOx) +zMDA z(zSOD +zLOOH +zNOx) +zAOPP z(zSOD +zLOOH +zNOx) +z(MDA + AOPP) zHDL + PON1
zsum5OX−zsum4ANTIOX
TUD TUD TUD TUD TUD TUD TUD 13.65 6.73 7.36 5.51 7.20 8.22 5.82 1/116 1/116 1/116 1/116 1/116 1/116 1/116 < 0.001 0.011 0.008 0.021 0.008 0.005 0.017 0.105 0.055 0.060 0.045 0.058 0.066 0.048 Between-subject effects zSOD + LOOH
zSOD + LOOH+NOx
z(zSOD +zLOOH +zNOx) +zMDA z(zSOD +zLOOH +zNOx) +zAOPP z(zSOD +zLOOH +zNOx) +z(MDA + AOPP) zUA
zsum5OX−zsum4ANTIOX
Sex Sex Sex Sex Sex Sex Sex 5.63 9.32 6.83 29.48 23.80 36.35 21.33 1/116 1/116 1/116 1/116 1/116 1/116 1/116 0.019 0.003 0.010 < 0.001 < 0.001 < 0.001 < 0.001 0.046 0.074 0.056 0.203 0.170 0.239 0.155 Between-subject effects z(zSOD +zLOOH +zNOx) +zAOPP
z(zSOD +zLOOH +zNOx) +z(MDA + AOPP) zHDL + PON1
zUA BMI BMI BMI BMI 4.09 4.26 7.27 17.39 1/116 1/116 1/116 1/116 0.045 0.041 0.008 < 0.001 0.034 0.035 0.059 0.130 Between-subject effects zSOD + LOOH
(zSOD +zLOOH +zNOx) +zMDA EducationEducation 6.125.93 1/1161/116 0.0150.016 0.0500.049 Multivariate≠2 All composite scores GAD
GAD × TUD HAM-A 4.76 3.35 1.18 7/100 7/100 7/100 < 0.001 0.003 0.323 0.250 0.190 0.076 Multivariate≠3 All composite scores GAD
GAD × TUD HAM-D YMRS 5.35 3.16 3.45 0.64 7/108 7/108 7/108 7/108 < 0.001 0.004 0.002 0.721 0.257 0.170 0.183 0.040
GADgeneralized anxiety disorder,HC/BD/MDDhealthy controls/bipolar disorder/major depression,HAM-AHamilton Anxiety Rating Scale score,
HAM-DHamilton Depression Rating Scale score,YMRSYoung Mania Rating Scale,SODsuperoxide dismutase,CATcatalase,LOOHlipid hydroper-oxides,NOxnitric oxide metabolites,MDAmalondialdehyde,AOPPadvanced oxidation protein products,UAuric acid,GSHglutathione,HDL high-density lipoprotein cholesterol,PON1paraoxonase 1
zSOD + LOOH: computed asztransformed value of SOD (zSOD) +zLOOH
zSOD + LOOH + NOx:zSOD +zLOOH +zNOx
z(zSOD +zLOOH +zNOx) +zMDA: computed asz(zSOD +zLOOH +zNOx) +zMDA
z(zSOD +zLOOH +zNOx) +zAOPP: computed asz(zSOD +zLOOH +zNOx) +zAOPP
z(zSOD +zLOOH +zNOx) +z(MDA + AOPP): computed asz(zSOD +zLOOH +zNOx) +z(MDA + AOPP)
zHDL + PON1: computed aszHDL-cholesterol +zPON1
zUA:zuric acid
Table 5 Estimated marginal mean (SE) values (expressed inz
values) obtained by GLM analy-sis no. 1 in Table4
Variables No GAD GAD
zSOD + LOOH −0.122 (0.102) + 0.407 (0.1465)
zSOD + LOOH + NOx −0.140 (0.0.096) + 0.639 (0.138)
z(zSOD +zLOOH +zNOx) +zMDA −0.085 (0.094) + 0.535 (0.0.134)
z(zSOD +zLOOH +zNOx) +zAOPP −0.040 (0.099) + 0.639 (0.142)
z(zSOD +zLOOH +zNOx) +z(MDA + AOPP) −0.030 (0.096) + 0.604 (0.138)
zHDL + PON1 + 0.187 (0.185) −0.718 (0.265)
zsum5OX−zsum4ANTIOX −0.050 (0.098) + 0.644 (0.141)
z(zSOD +zLOOH +zNOx) +zMDA No TUD −0.519 (0.142) + 0.349 (0.114)
z(zSOD +zLOOH +zNOx) +zMDA TUD + 0.523 (0.211) + 0.548 (0.162)
z(zSOD +zLOOH +zNOx) +zAOPP No TUD −0.358 (0.150) + 0.279 (0.121)
z(zSOD +zLOOH +zNOx) +zAOPP TUD + 0.550 (0.223) + 0.728 (0.171)
zsum5OX−zsum4ANTIOX No TUD −0.511 (0.149) + 0.411 (0.120) zsum5OX−zsum4ANTIOX TUD + 0.688 (0.222) + 0.600 (0.170)
GADgeneralized anxiety disorder,TUDtobacco use disorder,SODsuperoxide dismutase,CATcatalase,LOOH
lipid hydroperoxides,NOxnitric oxide metabolites,MDAmalondialdehyde,AOPPadvanced oxidation protein products,GSHglutathione,HDLhigh-density lipoprotein cholesterol,PON1paraoxonase 1
z(zSOD +zLOOH +zNOx) +zMDA: computed asz(zSOD +zLOOH +zNOx) +zMDA
z(zSOD +zLOOH +zNOx) +zAOPP: computed asz(zSOD +zLOOH +zNOx) +zAOPP
zsum5OX−zsum4ANTIOX: computed asz(zSOD +zLOOH +zNOx +zMDA +zAOPP)−z(z HDL-cholester-ol +zPON1 +zGSH +zCAT)
Fig. 3 Measurements (inz-transformations) of nitro-oxidative stress in-dices in participants with (1) and without (0) generalized anxiety dis-order. SOD superoxide dismutase, CAT catalase, LOOH lipid hydroper-oxides, NOx nitric oxide metabolites, MDA malondialdehyde, AOPP advanced oxidation protein products, GSH glutathione, UA uric acid, HDL high-density lipoprotein cholesterol, PON1 paraoxonase 1.
zSOD + LOOH: computed asz transformed value of SOD (zSOD) +
zLOOH. zSOD + LOOH + NOx: zSOD +zLOOH +zNOx. zSOD +
LOOH + NOx + MDA: computed as z(zSOD +zLOOH +zNOx) +
zMDA. zSOD + LOOH + NOx + AOPP: computed as z(zSOD +
zLOOH +zNOx) +zAOPP. z5OX: computed as z(zSOD +zLOOH +
zNOx) +z(MDA + AOPP).zHDL + PON1: computed asz HDL-choles-terol +zPON1.zCAT + GSH: computed aszCAT +zGSH.zUA:zuric acid. z5OX−z4ANTIOX: computed asz(zSOD +zLOOH +zNOx +
in those with TUD. Males showed significantly higher values of composite score as compared to females, namelyzSOD + LOOH (F= 5.63, df = 1/116,p= 0.019; partial eta squared = 0.046), zSOD + LOOH + NOx (F= 9.32, df = 1/116, p= 0.003; partial eta squared = 0.074), z(zSOD +zLOOH +
zNOx) +zMDA (F= 6.83, df = 1/116, p= 0.010; partial eta squared = 0.056), z(zSOD +zLOOH +zNOx) +zAOPP (F= 29.48, df = 1/116, p< 0.001; partial eta squared = 0.203),
z(zSOD +zLOOH +zNOx) +z(MDA + AOPP) (F= 23.80, df = 1/116,p< 0.001; partial eta squared = 0.170),zsum5OX Fig. 4 Measurements (inz
-transformations) of eight nitro-oxidative stress indices in healthy controls (HC), subjects with gen-eralized anxiety disorder (GAD), bipolar disorder (BD), comorbid BD with GAD (BD + GAD), major depression (MDD), and comorbid MDD with GAD (MDD + GAD). See legends to Fig.3for abbreviations
−zsum4ANTIOX (F= 21.33, df = 1/116,p< 0.001; partial eta squared = 0.155), and uric acid (F= 36.35, df = 1/116,
p< 0.001; partial eta squared = 0.239).
There were significant and positive associations between BMI and composite scores, namely z(zSOD +zLOOH +
zNOx) +zAOPP (F= 4.09, df = 1/116, p= 0.045; partial eta
squared = 0.034), z(zSOD +zLOOH +zNOx) +z(MDA + AOPP) (F= 4.26, df = 1/116,p= 0.041; partial eta squared = 0.035), and negative association withzHDL+PON1 (F= 7.27,
df = 1/116,p= 0.008; partial eta squared = 0.059). Education was significantly inversely associated with two composite scores, namely zSOD+LOOH (F= 6.12, df = 1/116, p=
0.015; partial eta squared = 0.050) andz(zSOD+zLOOH+
zNOx) +zMDA (F= 5.93, df = 1/116, p= 0.016; partial eta squared = 0.049).
Best Predictions of O&NS Biomarkers
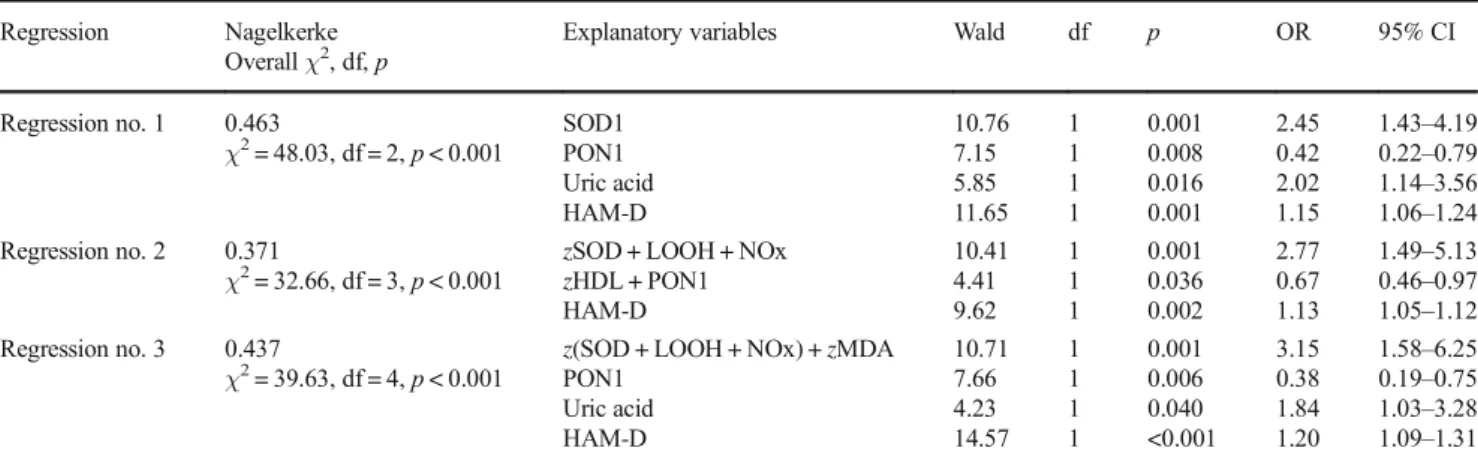
In order to assess the most adequate prediction of GAD, we have carried out binary logistic regression analysis with GAD as dependent variable, no GAD as reference group, and the O&NS biomarkers, age, sex, TUD, HAM-D, and HAM-A as explanatory variables (Table6). Using the 10 O&NS bio-markers, we found that GAD was significantly associated with SOD1, uric acid, and HAM-D (all positively) and with PON1 (inversely); 79.8% of all cases were correctly classified with a sensitivity of 58.1% and a specificity of 88.5%. Using the composite scores, we detected thatz(SOD + LOOH + NOx) and HAM-D (positively) andzHDL+PON1 (inversely) were associated with GAD. Using both the 10 measurements and
the composite scores showed thatz(SOD + LOOH + NOx) +
zMDA, uric acid and HAM-D (all positively), and PON1 (inversely) were significantly associated with GAD. All par-ticipants (79.8%) were correctly classified with a sensitivity of 51.6% and a specificity of 91.0%.
Discussion
The main finding of this study is that GAD is accompanied by increased SOD1 activity and LOOH, NOx, and uric acid levels and lowered PON1 activity and HDL-cholesterol levels and by changes in different composite scores indicating in-creased nitro-oxidative stress with lipid peroxidation and lowered lipid-associated antioxidant defenses. These findings extend those of previous reports showing that individuals with GAD have a higher total antioxidant status and oxidative stress index and lower antioxidant levels (Emhan et al.2015; Ercan et al.2017). Our results that LOOH is increased in GAD corroborate the study by Bulut et al. (2013), but the findings on lowered PON1 activity do not. PON1 activity may be de-termined using different substrates, and the rate of hydrolysis of some substrates is influenced by the PON1 Q192R poly-morphisms. Because of this, it is strongly recommended that PON1 total plasmatic activity be determined using phenyl acetate, a substrate which hydrolysis is not influenced by the Q192R polymorphism (Billecke and Teiber2011; Jarvik et al.
2000). Differently from our results, Bulut et al. (2013) did not find decreased PON1 total plasmatic activity (named AREase activity by the authors) but reported decreased activity against
Table 6 Results of binary regression analyses with generalized anxiety disorder (GAD) as dependent variable and nitro-oxidative biomarkers, demographic, and clinical data as explanatory variables
Regression Nagelkerke Overallχ2, df,p
Explanatory variables Wald df p OR 95% CI
Regression no. 1 0.463
χ2= 48.03, df = 2,p< 0.001
SOD1 PON1 Uric acid HAM-D
10.76 7.15 5.85 11.65
1 1 1 1
0.001 0.008 0.016 0.001
2.45 0.42 2.02 1.15
1.43–4.19 0.22–0.79 1.14–3.56 1.06–1.24 Regression no. 2 0.371
χ2= 32.66, df = 3,p< 0.001
zSOD + LOOH + NOx
zHDL + PON1 HAM-D
10.41 4.41 9.62
1 1 1
0.001 0.036 0.002
2.77 0.67 1.13
1.49–5.13 0.46–0.97 1.05–1.12 Regression no. 3 0.437
χ2= 39.63, df = 4,p< 0.001
z(SOD + LOOH + NOx) +zMDA PON1
Uric acid HAM-D
10.71 7.66 4.23 14.57
1 1 1 1
0.001 0.006 0.040 <0.001
3.15 0.38 1.84 1.20
1.58–6.25 0.19–0.75 1.03–3.28 1.09–1.31
ORodds ratio,95% CI95% confidence intervals,SOD1superoxide dismutase,PON1paraoxonase1,HAM-DHamilton Depression Rating Scale score
zSOD + LOOH: computed asztransformed value of SOD (zSOD) +zLOOH
zSOD + LOOH + NOx:zSOD +zLOOH +zNOx
z(zSOD +zLOOH +zNOx) +zMDA: computed asz(zSOD +zLOOH +zNOx) +zMDA
paraoxon (named paraoxonase activity by the authors), a sub-strate that is influenced by the polymorphism and must be adjusted by the PON Q192R genotype.
In addition, our study found higher SOD1 activity and no significant changes in catalase activity between participants with and without GAD. SOD1 is an antioxidant enzyme that protects against the moderately reactive superoxide radicals and catalyzes the partition of superoxide radicals into oxygen and hydrogen peroxides (Fukai and Ushio-Fukai 2011; McCord and Edeas2005). Catalase and GPx may further de-grade peroxides into H2O but when Fe++ ions (or heavy
metals) are present, peroxides are converted to the very reac-tive hydroxyl radicals, which may damage lipids, proteins, and DNA (Fukai and Ushio-Fukai2011; McCord and Edeas
2005). Therefore, our results that SOD1 and LOOH levels are increased in GAD, without changes in catalase, indicate that GAD is accompanied by elevated hydroxyl radical produc-tion, which in part may be explained by enhanced SOD1 activity. Increased generation of hydroxyl radicals may cause lipid peroxidation (formation of LOOH) from unsaturated phospholipids and cholesterol (Girotti1998). Thus, while SOD1 protects against the effects of increased superoxide rad-icals through the dismutation of superoxide radrad-icals, SOD is a major source of hydrogen peroxide production (Fukai and Ushio-Fukai2011; McCord and Edeas2005; Hayyan et al.
2016). The latter may lead, depending on the activity of cata-lase and GPx and Fe2+levels, to increased production of more reactive hydroxyl radicals and consequently lipid peroxida-tion. Some data, however, suggest that the Fenton reaction may be of minor importance in the production of hydroxyl radicals (Saran et al.2000). Under stress conditions, however, an excess of Bsuperoxide releases free iron from iron-containing molecules,^ which may participate in the Fenton reaction and the production of hydroxyl radicals (Valko et al.
2007). Most importantly, SOD1 overexpression may cause oxidative injuries to cells and even cell death, mediated by elevated production of hydrogen peroxides (Xing et al.
2002). As such, SOD1 may have a triphasic effect: (a) low SOD1 activity increases susceptibility to oxidative stress, (b) moderately increased SOD1 levels have protective effects, and (c) very high SOD1 may cause oxidative damage to cells mediated by increased hydrogen peroxide levels (Xing et al.
2002). All in all, it appears that in GAD, the combination of increased SOD1 and unaltered catalase activity is insufficient to remove oxygen radicals and protect lipids against lipid peroxidation.
Importantly, SOD1 mRNA expression is elevated by nitro-oxidative stress (e.g., nitric oxide and hydrogen perox-ides), T cell-mediated mechanisms, endotoxin, and pro-inflammatory cytokines such as tumor necrosis factor (TNF)-α (Harris1992; Terrazzano et al. 2014; Zelko et al. 2002; Miao and St Clair2009; Rojo et al.2004; Marikovsky et al.2003). This is important as mood disorders and GAD
are characterized by activated immune-inflammatory path-ways (Maes 2008; Michopoulos et al. 2017). Therefore, the activated immune-inflammatory processes in those ill-nesses may play an important role in the SOD1 activation observed in our study. Moreover, increased SOD1 expres-sion may contribute to inflammation by increasing the pro-duction of TNF-αand metalloproteinases (Marikovsky et al. 2003), although lowered SOD1 activity yields also pro-inflammatory effects (Ishigami et al. 2011). Finally, there are many more links between immune and redox systems explaining the tight connection between both systems in mood disorders (Moylan et al. 2014), including increased MPO levels, a major multifunctional player in innate and acquired immunity (Arnhold and Flemmig2010).
Our study also observed increased NOx levels and an in-creased composite score SOD + LOOH + NOx in GAD, indi-cating that increased NO production coupled with superoxide radicals has increased the propensity to form peroxynitrite which, in turn, together with hydroxyl radicals may cause lipid peroxidation (Girotti1998; Pacher et al.2007). Therefore, the higher values of this composite score in GAD show that this condition is accompanied by increased nitro-oxidative stress (elevated ROS + RNS generation), which has caused lipid peroxidation.
Our study found that GAD is associated not only with lowered PON1 activity, but also with lowered HDL-cholesterol concentrations, while GSH and catalase are not significantly altered. In fact, lowered values of thezPON1 + HDL and increasedzSOD + LOOH + NOx composite scores were the most significant predictors of GAD, suggesting that both increased nitro-oxidative stress and attenuated lipid-associated antioxidant defenses participate in the pathophysi-ology of GAD. Following PON1 production in the liver, PON1 is secreted into the peripheral blood and is integrated into HDL molecules and then activated during HDL matura-tion (Gugliucci and Menini2015; Huang et al.2013). The anchored PON1, in turn, protects HDL from oxidation by hydrolyzing phospholipid or cholesteryl ester hydroperoxides (Watson et al. 1995). This functional HDL-PON1 binding may explain the significant positive correlations between both molecules found in the present study. Moreover, PON1 activ-ity protects against lipid and LDL oxidation and stimulates the ability of HDL to enhance cholesterol efflux from macro-phages (Gugliucci and Menini 2015; Efrat and Aviram
inflammation-associated production of ROS/RNS may down-regulate the protective effects of PON1/HDL thereby inducing lipid peroxidation and MDA formation, which may further damage lipids (Gugliucci and Menini 2015). In addition, PON1 may dampen MPO activity and as a consequence lowered PON1 activity may further enhance MPO activity thereby increasing peroxynitrite and hypochlorous acid, which may cause increased AOPP production. These recipro-cal interactions between PON1 binding to HDL and ROS/ RNS production explain the significant and inverse correla-tions found in the present study between loweredzHDL + PON1 scores and indices of nitro-oxidative stress and damage to lipids and proteins.
Moreover, our results show that GAD may be accom-panied by a moderate increase in aldehyde, but not AOPP, production. In nonsmokers, but not in smokers, we found that MDA and the composite score (SOD + LOOH + NOx) + MDA were significantly higher in individuals with GAD than in those without. This suggests that the well-known effects of TUD on nitro-oxidative pathways (Nunes et al.2013) may blur a moderate association be-tween GAD and MDA. MDA is a highly reactive alde-hyde, which may damage cells, proteins, and DNA theby causing inflammatory, genotoxic, and cytotoxic re-sponses (Maes et al. 2011a). Aldehydes are mainly gen-erated by hydroxyl radicals and increased peroxynitrite production contributing to lipid hydroperoxide chain re-actions. Increased AOPP formation is the consequence of increased hypochlorous acid stress via increased MPO activity coupled with elevated peroxide production, via SOD and peroxynitrite production (Huang et al. 2013). Phrased differently, GAD appears to be accompanied by relevant increases in ROS/RNS or nitro-oxidative stress, while there are only moderate or no changes in their con-sequences, namely enhanced aldehyde and AOPP forma-tion. By inference, it appears that patients with GAD have some protection against these consequences of activated nitro-oxidative processes. One explanation is that the for-mation of hydroxyl radical and peroxynitrite is inhibited by increased levels of uric acid (Regoli and Winston
1999), which is generated by xanthine oxidase together with superoxide and NO radicals (Kuppusamy and Zweier 1989). The latter two radicals, in turn, generate peroxynitrite and hydroxyl radicals, which are scavenged by uric acid with a potency similar to ascorbic acid and Trolox (Regoli and Winston 1999). Therefore, increased uric acid levels may be regarded as a beneficial compen-satory mechanism in response to oxidative stress (Soltani et al. 2013). Nevertheless, following reactions with oxi-dants (including peroxynitrite), uric acid may form reac-tive intermediates or urate radicals, which are proinflam-matory and pro-oxidants thereby contributing to cardio-vascular disease, hypertension, and metabolic syndrome
(Gersch et al. 2009; Soltani et al. 2013). Based on this knowledge, it may be suggested that increased xanthine oxidase activity may occur in GAD.
A second major finding is that the co-occurrence between MDD and GAD is characterized by significant additive effects on nitro-oxidative pathways, resulting in more activated path-ways in this co-occurrence. Thus, the presence of GAD in major depression signals an increased nitro-oxidative burden in an illness that is already characterized by increased nitro-oxidative stress (seeIntroductionand Figs.4 and 5). These findings could explain that the co-occurrence of GAD and MDD may predict poorer outcomes than GAD or MDD alone, including effects on quality of life (Zhou et al. 2017). Moreover, our findings may have important consequences for comorbid medical illness in depression and GAD. For example, the high comorbidity between depression and car-diovascular disorder and metabolic syndrome may be ex-plained by increased nitrosative stress, lipid peroxidation, and lowered antioxidant defenses (Maes et al. 2011c; de Melo et al.2017). There is also a high comorbidity between GAD and cardiovascular disorder (Tully and Cosh 2013; Martens et al.2010) and metabolic syndrome (Carroll et al.
2009). Thus, activated nitro-oxidative stress pathways com-bined with lowered antioxidant defenses in GAD and espe-cially in GAD + MDD may explain at least in part the in-creased co-occurrence between GAD and these medical dis-orders. Our findings on the biological underpinnings of the comorbidity between anxiety and mood disorders further un-derscore that psychiatric classifications should be revised based on knowledge from translational neuroscience, espe-cially neuroimmunology (Stoyanov2017).
A third major finding of this study revolves around severity of depression being associated with O&NS biomarkers and GAD. Firstly, severity of depression (and to a lesser extent also severity of anxiety) was significantly and independently from diagnoses of GAD and mood disorders associated with LOOH, AOPP, and different composites scores. Thus, it ap-pears that lipid peroxidation and AOPP formation are sensi-tive to increased severity of depression. Previously, it was shown that in mood disorders various O&NS biomarkers, including TBARS (Maes et al. 2011a; Sowa-Kućma et al.
activity, lipid peroxidation, NOx levels, and aldehyde forma-tion (TBARS/MDA). Such shared pathways may explain the strong comorbidity between GAD and depression (see the BIntroduction^ section). There is some evidence that, based on similarities in the areas of demographics, phenomenology, genetics, and childhood environment, GAD shows a strong overlap with mood disorders, especially depression (Mennin et al.2008; Hettema2008). Therefore, it was proposed that GAD may belong to the mood disorders spectrum and should be reclassified in the same diagnostic category as major de-pression (Mennin et al.2008). Nevertheless, comorbidity, treatment, personality, life events, and biomarker data are more mixed and showed also clear differences (Hettema
2008). Also, the current study showed that GAD was accom-panied by increased nitro-oxidative stress and uric acid levels and a moderately increased aldehyde production, but no sig-nificant changes in AOPP levels. Mood disorders, on the other hand, are characterized by enhanced nitro-oxidative pathways and highly increased aldehyde and AOPP production, while some papers report lowered uric acid in depression (Maes et al. 2011a; Liu et al. 2015; Mazereeuw et al. 2015; Andreazza et al. 2008; Brown et al. 2014; Gomes et al.
2017; Wen et al. 2012). In fact, higher levels of uric acid may be associated with a lower risk of depression (Wium-Andersen et al.2017). This is interesting given that the current study found that GAD is accompanied by increased uric acid levels. Nevertheless, the hypothesis is that in both GAD and depression uric acid may exert protective effects and that
increased levels of uric acid in GAD may perhaps explain why aldehyde production and protein oxidation are less severe in GAD as compared with depression.
The fourth finding of this study is that patients with other anxiety disorders, namely simple and social phobia or panic disorder, do not show significant changes in nitro-oxidative pathways. These findings extend those of Hagan et al. (2015) who could not find associations between phobic anxiety and oxidative stress. Nevertheless, a few reports showed increased pro- and antioxidant levels in social phobia (Atmaca et al.
2004) and increased MDA but lower PON1 activity and GPx-1 and PON1 192AA polymorphisms in panic disorders (Gul et al. 2013; Cengiz et al.2015; Atasoy et al. 2015). Nevertheless, even in the general population, individuals often have one or more anxiety disorders in a lifetime although they not necessarily co-occur at a same given moment (Craske et al.2017). Thus, our study shows that there are no cross-sectional additive effects of other anxiety disorders increasing nitro-oxidative pathways in BD and MDD.
Another finding is that the nitro-oxidative pathways mea-sured here are modulated by sex, nicotine dependence, and years of education. Thus, males show higher LOOH, AOPP, and uric acid levels, but lower catalase and HDL-cholesterol levels. These findings corroborate those of previous research reporting that plasma peroxides and ROS production are higher in males than females (Maes et al. 2010; Katalinic et al. 2005). There are now some studies showing that smoking may decrease PON1 activities (Haj Mouhamed et al. 2012; Souza-Nogueira et al. 2016) and HDL-cholesterol levels (He et al. 2013; Nunes et al. 2015; Bortolasci et al.2014b). There is also a significant effect of smoking and tobacco use disorder on the nitro-oxidative path-ways with increased SOD and LOOH levels, but lower HDL-cholesterol and PON1 activities. van der Vaart et al. (2004) and Donohue (2006) found strong effects of smoking on O&NS pathways. Based on our results, we may conclude that the effects of smoking on lipid-associated antioxidants and lipid peroxidation may contribute to the pathophysiological underpinnings of GAD. Previously, it has been reviewed that smoking and nicotine dependence may increase the risk of GAD (Moylan et al.2015) and that there is a significant co-morbidity between GAD and TUD (Fluharty et al. 2016). Finally, also education has a very modest effect on nitro-oxidative pathways. Thus, years of education was significant-ly associated with SOD1 (inversesignificant-ly), CAT (positivesignificant-ly), and MDA (inversely), suggesting that years of education may pro-tect against ROS generation and lipid peroxidation with alde-hyde production. It is probably that the effects of education may be explained by a healthier lifestyle in more educated individuals improving antioxidant defenses through better nu-trition and exercise (Lobo et al.2010; Moylan et al.2013).
The findings of our study should be interpreted with regard to limitations. Firstly, this study has a cross-sectional design Table 7 Comparison of nitro-oxidative pathways among patients with
depression (previous studies) and generalized anxiety disorder (GAD) (the current study)
Depression GAD
Biomarkers
Superoxide dismutase ↑ ↑
Peroxides ↑ ?
Catalase 0 0
Lipid hydroperoxides ↑ ↑
Nitric oxide metabolites ↑ ↑
Malondialdehyde ↑↑ ↑
Advanced oxidation protein products ↑↑ 0
High-density lipoprotein cholesterol ↓ ↓
Paraoxonase 1 ↓ ↓
Reduced glutathione ↓ 0
Uric acid ↓ ↑
Pathways
Nitro-oxidative stress ↑↑ ↑↑
Lipid peroxidation ↑↑ ↑↑
Aldehyde formation ↑↑ ↑↑
Protein oxidation ↑↑ 0