Association Between Central Obesity, Triglycerides and Hypertension
in a Rural Area in Brazil
Adriano Marçal Pimenta1, Gilberto Kac2, Andrea Gazzinelli1, Rodrigo Corrêa-Oliveira3, Gustavo Velásquez-Meléndez1 Departamento de Enfermagem Materno-Infantil e Saúde Pública, Escola de Enfermagem, Universidade Federal de Minas Gerais, Belo Horizonte, MG1, Departamento de Nutrição Social e Aplicada, Instituto de Nutrição Josué de Castro, Universidade Federal do Rio de Janeiro, Rio de Janeiro, RJ2, Laboratório de Imunologia, Centro de Pesquisas René Rachou, Instituto Oswaldo Cruz, Belo Horizonte, MG3 - Brazil
Mailing address: Gustavo Velásquez-Meléndez •
Avenida Alfredo Balena, 190 - 30130-100 - Belo Horizonte, MG - Brazil E-mail: [email protected]
Manuscript received May 22, 2007; revised manuscript received September 14, 2007; accepted October 17, 2007.
Summary
Background: Hypertension represents a serious public health problem and is one of the most frequent causes of morbidity around the world.
Objective: To estimate the prevalence of hypertension and its risk factors in a rural community located in the north-eastern state of Minas Gerais, Brazil.
Methods: A cross-sectional study was carried out in 2004 in the Virgem das Graças Village, a rural community located the Jequitinhonha Valley. The sample consisted of 287 males and females aged between 18 to 88 years. Hypertension
ZDVGHILQHGDFFRUGLQJWR-RLQW1DWLRQDO&RPPLWWHHFULWHULDV\VWROLFEORRGSUHVVXUHPP+JDQGRUGLDVWROLFEORRG SUHVVXUH PP+J VXEMHFWV DOUHDG\ UHFHLYLQJ DQWLK\SHUWHQVLYH WUHDWPHQW ZHUH FRQVLGHUHG WR EH K\SHUWHQVLYH
Bivariate analysis was performed to test the relationship between the independent variables and hypertension. Logistic regression was used to adjust for confounding and to identify interactions. The strength of association was measured using Odds Ratio (OR) and its 95% confidence intervals [CI (95%)].
Results: The crude prevalence of hypertension was 47.0% [CI (95%): 41.1 – 53.0], the age-standardized prevalence was 43.2% [CI (95%): 35.7 – 50.7], while the schooling-standardized prevalence was 44.1% [CI (95%): 43.9 – 44.3]. Age, triglycerides, waist circumference and sex were found to be independent risk factors for hypertension according to multivariate analysis.
Conclusion: The findings provide important evidence concerning the hypertension as a public health problem and its association with dyslipidemia and abdominal obesity in the rural area of Minas Gerais. (Arq Bras Cardiol 2008; 90(6): 386-392)
Key words: Hypertension, rural population, epidemiology, dyslipidemias, obesity.
south-eastern and south regions of the country4. Some authors state that 20% of Brazilian adults suffer from AH, whilst the prevalence of the disease amongst individuals living in urban areas is apparently within the range 22.3% to 43.9% based on the criteria of the Joint National Committee (JNC)2. Considering that only a few studies concerning the prevalence of AH in rural areas of Brazil have been performed to date4, we have investigated the prevalence of this condition amongst the inhabitants of a rural community situated in the Jequitinhonha Valley, Minas Gerais (MG), Brazil.
Methods
The study was approved by the Ethical Committee on Research of Universidade Federal de Minas Gerais in accordance with the Declaration of Helsinki and Resolution 196/96 of the National Health Counci1. All of the individuals who took part in the study were informed about the objectives of the research and their rights as participants, and voluntarily signed an appropriate form of consent.
A cross-sectional and population-based study was conducted
Introduction
Arterial hypertension (AH) represents a serious public health problem and is one of the most frequent causes of morbidity in both industrialised and developing countries, especially in urban centres1. AH is associated with cardiac insufficiency, renal diseases and diabetes, and is also a component of metabolic syndrome2. More significantly, however, AH is strongly related to other cardiovascular diseases, being associated with 40% of stroke and 25% of ischemic heart diseases. In fact, cardiovascular diseases are the main causes of death worldwide, being responsible for 30% of case-fatality rate3.
in the village of Virgem das Graças located in the municipality of Ponto dos Volantes, north-eastern Brazil. In 2001, a survey of the community revealed 685 inhabitants of which 408
LQGLYLGXDOVZHUH\HDUVROG:HH[FOXGHGSDUWLFLSDQWV
by the following reasons: 7 pregnants, 3 with medical or surgical impediments, 55 individuals were outside at moment of survey and 56 with non-adherence to the study procedures. This resulted in a final sample of 287 individuals.
Researches appropriately trained, conducted the interviews following a structured questionnaire relating to social, demographic and lifestyle aspects of the subjects. At the end of the interview, a clinical evaluation was performed that included anthropometrical measurements (body weight, stature, waist circumference – WC, hip circumference – HC) carried out according to standard recommendations5. Measurements were carried out in triplicate and the mean values recorded.
The body composition of each subject was assessed using an RJL bio-impedance analyser (BIA – 101 Q; RJL Systems, Detroit) and was calculated using Cyprus software version 1.2 as supplied with the instrument. Body fat levels in excess of 25% for males or 30% for females were used as cut-off points for defining obesity6.
Body mass index (BMI) was calculated from the expression: BMI = weight (kg) / stature2 (m) and categorised according to the cut-off points established by the World Health Organization (WHO)7, Abdominal obesity was diagnosed using the criteria proposed by WHO.7 The waist to hip circumference ratio (WHR ) was calculated from the expression: WHR = WC / HC and categorised according to WHO recommendations7.
Blood samples (5 mL) were collected from each subject by venous puncture following a fasting period of 12 h. Aliquots of the serum and plasma obtained by the centrifugation of each sample were appropriately treated and stored in vials maintained at 4oC until required by the laboratory for biochemical analysis. Colorimetric enzymatic methods were employed for the determination of total cholesterol (TC), triglycerides (TG) and glucose using a Roche Cobas Mira Plus analyser. The concentration of high density lipoprotein-cholesterol (HDL-C) was also determined by colorimetric enzymatic assay following precipitation of the low density lipoprotein-cholesterol (LDL-C) and very low density lipoprotein-cholesterol (VLDL-C) fractions with phosphotungstic acid and magnesium chloride. The levels of LDL-C were calculated by application of the Friedewald equation. LDL-C = TC – (HDL-C + TG/5)
Dyslipidemia and hyperglycaemia were classified according to applicable Brazilian consensus.
Blood pressure was determined by an indirect method using a mercury sphygmomanometer and following the recommendations of the JNC2. Measurements were taken three times for each subject with an interval of 2 min between readings. On the basis of the mean values, subjects were classified as hypertensive when the arterial systolic pressure
ZDVPP+JDQGRUWKHDUWHULDOGLDVWROLFSUHVVXUHZDV
90 mmHg and/or the individual was using anti-hypertensive drugs regularly. In the present study, AH was defined as a dependent variable.
Initially, the population participating in the study (n = 287) was compared with respect to demographic, social and economic characteristics with the non-participating population (n = 121), and the differences between the two groups were identified using Pearson’s F2test. Because the final sample tended to be older and have more years of formal education, age and schooling standardized prevalences of AH were calculated using direct standardization technique employing Epidat software (OPAS/OMS) version 3.0. Standard population consisted of the rural adult inhabitants of Minas Gerais, whose data were available from the 2000 Census conducted by the
Instituto de Geografia e Estatística (IBGE).
Potential relationships between the prevalence of AH and covariables of interest were examined through bivariate analyses, and all covariables that showed significance at p < 0.20 were included in the final model. Variables were adjusted using step-by-step multivariate logistic regression. Odds ratio (OR) and the respective 95% confidence interval [CI (95%)] were determined in order to test the strength of the relationship between a variable and AH. The level of statistical significance was established at 5% (p < 0.05). The data were compiled and analysed using the Statistical Package for Social Sciences (SPSS) program version 10.0.
Results
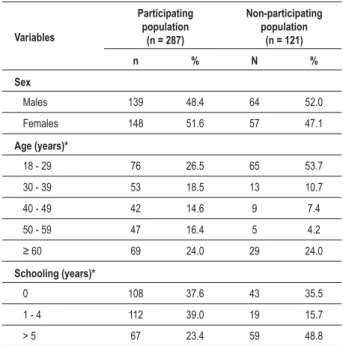
The demographic, social and economic characteristics of both the participating and the non-participating groups of the adult population of Virgem das Graças are shown in Table 1. As can be seen, the later group was younger and had more schooling.
Table 1 - Comparison of demographic, social and economic
FKDUDFWHULVWLFVEHWZHHQWKHSDUWLFLSDWLQJDQGWKHQRQSDUWLFLSDWLQJ
population
Variables
Participating population
(n = 287)
Non-participating population
(n = 121)
n % N %
Sex
Males 139 48.4 64 52.0
Females 148 51.6 57 47.1
Age (years)*
18 - 29 76 26.5 65 53.7
30 - 39 53 18.5 13 10.7
40 - 49 42 14.6 9 7.4
50 - 59 47 16.4 5 4.2
69 24.0 29 24.0
Schooling (years)*
0 108 37.6 43 35.5
1 - 4 112 39.0 19 15.7
> 5 67 23.4 59 48.8
,QGLFDWHVVLJQL¿FDQWGLIIHUHQFHEHWZHHQJURXSVDFFRUGLQJWRWKH3HDUVRQȤ
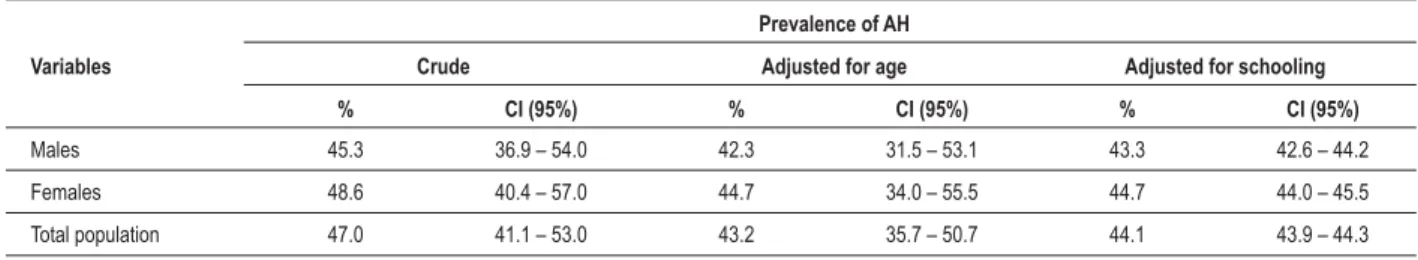
AH was diagnosed in 47.0% [CI (95%) = 41.1 – 53.0] of those individuals who participated in the present study, with no significant differences by sex (Table 2).
Both, age and schooling standardized prevalences of AH were lower than crude prevalence, respectively, 43.2% [CI (95%) = 35.7 – 50.7] and 44.1% [CI (95%) = 43.9 – 44.3].
The prevalence of AH remained, however, similar amongst males and females.
Table 3 shows that there were significant differences between male and female subjects regarding smoking and alcohol consumption, with the highest levels being observed for males. Amongst females, AH was associated with age,
Table 2 - Crude and adjusted prevalence of hypertension by sex
Variables
Prevalence of AH
Crude Adjusted for age Adjusted for schooling
% CI (95%) % CI (95%) % CI (95%)
Males 45.3 36.9 – 54.0 42.3 31.5 – 53.1 43.3 42.6 – 44.2
Females 48.6 40.4 – 57.0 44.7 34.0 – 55.5 44.7 44.0 – 45.5
Total population 47.0 41.1 – 53.0 43.2 35.7 – 50.7 44.1 43.9 – 44.3
&,FRQ¿GHQFHLQWHUYDO
Table 3 -%LYDULDWHGHPRJUDSKLFVRFLDOHFRQRPLFDQGOLIHVW\OHULVNIDFWRUVDVVRFLDWHGZLWKK\SHUWHQVLRQ
Variables
Males Females
Population
(%) AH (%) OR CI (95%) ȢYDOXH
Population
(%) AH (%) OR CI (95%) ȢYDOXH
Age (years) 0.014* < 0.001*
18 –29 24.5 32.4 1.00 28.4 11.9 1.00
30 – 39 19.4 37.0 1.23 0.43 – 3.55 17.6 57.7 10.09 2.99 – 34.03
40 – 49 15.8 36.4 1.19 0.39 – 3.69 13.5 50.0 7.40 2.06 – 26.64
50 – 59 17.3 66.7 4.18 1.37 – 12.71 15.5 52.2 8.07 2.33 – 27.94
23.0 56.3 2.69 0.99 – 7.32 25.0 81.1 31.71 9.14 – 110.09
Skin colour 0.345 0.029
White 36.0 40.0 1.00 43.9 38.5 1.00
Non-white 64.0 48.3 1.40 0.69 – 2.83 56.1 56.6 2.09 1.08 – 4.05
Schooling
(years) 0.225* < 0.001*
21.6 40.0 1.00 25.0 21.6 1.00
1 - 4 41.7 37.9 0.92 0.37 – 2.26 36.5 46.3 3.12 1.21 – 8.06
0 36.7 56.9 1.98 0.79 – 4.95 38.5 68.4 7.85 3.00 – 20.54
Alcohol
ingestion† 0.424 0.131
No 71.2 47.5 1.00 91.2 46.7 1.00
Yes 28.8 40.0 0.74 0.35 – 1.55 8.8 69.2 2.57 0.75 - 8.75
Smoking† 0.627 0.375
No 37.4 40.4 1.00 79.7 45.8 1.00
Former
smoker 29.5 46.3 1.27 0.56 – 2.91 8.1 58.3 1.66 0.50 – 5.53
Yes 33.1 50.0 1.48 0.66 – 3.29 12.2 61.1 1.86 0.67 – 5.14
Menstruation < 0.001
Yes – 56.1 32.5 1.00
No – 43.9 69.2 4.67 2.32 – 9.39
25RGGVUDWLR&,FRQ¿GHQFHLQWHUYDOȡRIOLQHDUWHQGHQF\3HDUVRQȤWHVW,QGLFDWHVVLJQL¿FDQWGLIIHUHQFHEHWZHHQPDOHDQGIHPDOHJURXSVDFFRUGLQJ
skin colour, and schooling, and was also positively related with menopause. The prevalence of AH tended to increase with age and with fewer years of schooling. In the male population, however, AH was significantly associated only with age, especially amongst 50 to 59 year old individuals [OR = 4.18; CI (95%) = 1.37 – 12.71], although the frequency of AH generally tended to increase after 40 years of age.
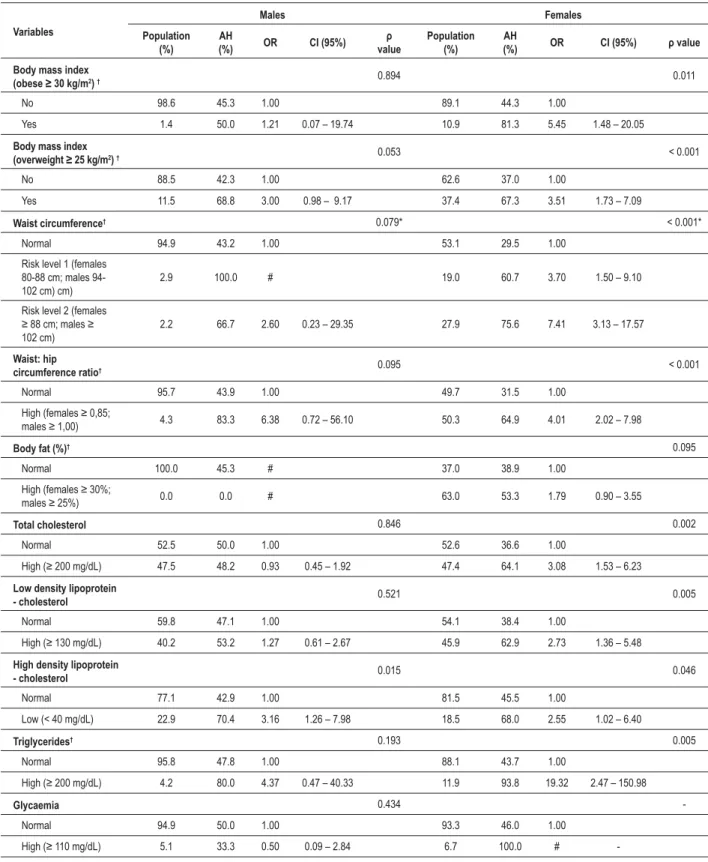
As is demonstrated in Table 4, obesity was more prevalent amongst the female population, and all covariables, except for body fat percentage, were associated with AH: the prevalence of AH tended to increase with WC. Amongst the male population, no associations between AH and the various covariables were established.
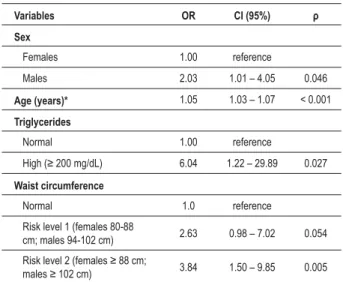
All of the biochemical variables measured, except for glycaemia, were found to be associated with prevalence of AH amongst women, whilst HDL-C was the only variable associated with prevalence of AH amongst men. Furthermore, the prevalence of hypertriglyceridemia was higher in female (Table 4). The results of the multivariate analysis regarding are shown in Table 5. Age [OR = 1.05; CI (95%) = 1.03 – 1.07], high levels of triglycerides [OR = 6.04; CI (95%) = 1.22 – 29.89], WC [risk level 2; OR = 3.84; CI (95%) = 1.50 – 9.85] and sex [male; OR = 2.03; CI (95%) = 1.01 – 4.05] remained independently associated with AH adjusting for potentially confounding variables.
Discussion
The results of the present study indicate that AH is a serious health problem within the community of Virgem das Graças (MG, Brazil) since the prevalence of the disease amongst the adult population studied was 47.0% [CI (95%) = 41.1 – 53.0]. Whilst this frequency is similar to that reported for the population of Alfenas, MG, Brazil (47.43%)8, it is much higher than that observed in the rural town of Cavunge located in the north-eastern state of Bahia, Brazil (36.5%)9, and is higher than values from other Latin American countries such as Argentina (39.8%)10, Chile (38.5%)11, Ecuador (36.0%)12 and Mexico (21.9%)13.
The prevalence of AH could be overestimated. We detected differences in age and schooling between the population who participated in the study and the non-participating individuals. Normally, this type of potential selection flaw would represent a limitation of the study since young individuals from rural communities often tend to migrate to urban centres seeking better opportunities and life conditions. However, in the present study, this bias was reduced by correcting the observed AH frequency with respect to the age and schooling distributions of the total population using a direct standardisation method. Following correction, the prevalence of AH still remained somewhat high at 43.2% [CI (95%) = 35.7 – 50.7] for age standardization and 44.1% [CI (95%) = 43.9 – 44.3] for schooling standardization, but this rates were similar to that found in Brazilian urban centres such as Araraquara (43.1%)14 and Cotia (44.0%)15, both located in the southeastern State of São Paulo.
The prevalence of AH in Virgem das Graças was directly associated with age for both men and women, as shown by bivariate and multivariate analysis. Increased arterial pressure in
older individuals is normally associated with the development of arteriosclerosis and the consequent malfunction of the arteries, resulting in isolated systolic AH2.
Multivariate analysis revealed that the prevalence of AH was higher amongst men than women, which corroborates literature reports4, although the prevalence of AH was highest amongst women of 60 years and above. Hildretch and Saunders16 have previously shown that AH is more frequent in men aged between 45 and 50 years, but that the prevalence amongst women increases above this age range. The high prevalence of AH amongst older women (> 60 years) is possibly initiated by the onset of menopause since, prior to this phase, women are haemodynamically younger than males of corresponding age. Thus, whilst younger women are less vulnerable to AH and cardiovascular diseases than are men of a similar age, following menopause this situation inverted2. In the present study the prevalence of AH in menopausal women was 69.2%, whilst the prevalence in pre-menopausal women was 32.5%, a difference that is statistically significant (U < 0.001).
The present study revealed that obesity (both general and abdominal) was more prevalent amongst the women than the men: Matos and Ladeia9 have reported similar findings for the rural town of Cavunge (Bahia, Brazil). Some studies suggest that the accumulation of adipose tissue in the abdominal region is a more significant risk factor for cardiovascular disease than is total fat mass17 and may be used as an indicator for higher risk patients18. In the present study, WC was positively associated with AH. According to bivariate and multivariate analysis, the prevalence of AH increased with increasing WC but, following multivariate analysis, the positive association between WC and AH remained only for risk level 2 [OR = 3.84; CI (95%) = 1.50 – 9.85].
Amongst the individuals that presenting high levels of TC, LDL-C and TG, 56.7, 58.7 and 90.5%, were hypertensives, hypertensives, respectively. The disease also was presented in 69.2% of the The disease also was presented in 69.2% of the individuals had low HDL-C levels. A survey of a Canadian population, conducted by the Quebec Cardiovascular Study19, showed that increased levels of LDL-C and TG, and diminished levels of HDL-C, were associated with increased risk of cardiovascular diseases within a 5 year span.
In the present study, only high TG levels remained directly associated with AH after multivariate analysis. Some studies suggest that high TG levels represent the most significant risk factor associated with cardiovascular diseases20.
One of the most important aspects of the present study was report a positive association between AH, WC and high levels of serum TG. High levels of serum TG have been observed in subjects presenting abdominal obesity21, and some authors have referred to the occurrence of these two factors as hypertriglyceridemic waist. There is a considerable body of evidence to indicate a strong association between hypertriglyceridemic waist and the risk of cardiovascular diseases21,22-24.
Table 4 -%LYDULDWHDQWKURSRPHWULFERG\FRPSRVLWLRQDQGELRFKHPLFDOULVNIDFWRUVDVVRFLDWHGZLWKK\SHUWHQVLRQ
Variables
Males Females
Population (%)
AH
(%) OR CI (95%)
Ȣ
value
Population (%)
AH
(%) OR CI (95%) ȢYDOXH Body mass index
REHVHNJP2)† 0.894 0.011
No 98.6 45.3 1.00 89.1 44.3 1.00
Yes 1.4 50.0 1.21 0.07 – 19.74 10.9 81.3 5.45 1.48 – 20.05
Body mass index
RYHUZHLJKWNJP2) † 0.053 < 0.001
No 88.5 42.3 1.00 62.6 37.0 1.00
Yes 11.5 68.8 3.00 0.98 – 9.17 37.4 67.3 3.51 1.73 – 7.09
Waist circumference† 0.079* < 0.001*
Normal 94.9 43.2 1.00 53.1 29.5 1.00
Risk level 1 (females 80-88 cm; males 94-102 cm) cm)
2.9 100.0 # 19.0 60.7 3.70 1.50 – 9.10
Risk level 2 (females
FPPDOHV
102 cm)
2.2 66.7 2.60 0.23 – 29.35 27.9 75.6 7.41 3.13 – 17.57
Waist: hip
circumference ratio† 0.095 < 0.001
Normal 95.7 43.9 1.00 49.7 31.5 1.00
+LJKIHPDOHV
PDOHV 4.3 83.3 6.38 0.72 – 56.10 50.3 64.9 4.01 2.02 – 7.98
Body fat (%)† 0.095
Normal 100.0 45.3 # 37.0 38.9 1.00
+LJKIHPDOHV
PDOHV 0.0 0.0 # 63.0 53.3 1.79 0.90 – 3.55
Total cholesterol 0.846 0.002
Normal 52.5 50.0 1.00 52.6 36.6 1.00
+LJKPJG/ 47.5 48.2 0.93 0.45 – 1.92 47.4 64.1 3.08 1.53 – 6.23 /RZGHQVLW\OLSRSURWHLQ
- cholesterol 0.521 0.005
Normal 59.8 47.1 1.00 54.1 38.4 1.00
+LJKPJG/ 40.2 53.2 1.27 0.61 – 2.67 45.9 62.9 2.73 1.36 – 5.48
High density lipoprotein
- cholesterol 0.015 0.046
Normal 77.1 42.9 1.00 81.5 45.5 1.00
Low (< 40 mg/dL) 22.9 70.4 3.16 1.26 – 7.98 18.5 68.0 2.55 1.02 – 6.40
Triglycerides† 0.193 0.005
Normal 95.8 47.8 1.00 88.1 43.7 1.00
+LJKPJG/ 4.2 80.0 4.37 0.47 – 40.33 11.9 93.8 19.32 2.47 – 150.98
Glycaemia 0.434
-Normal 94.9 50.0 1.00 93.3 46.0 1.00
+LJKPJG/ 5.1 33.3 0.50 0.09 – 2.84 6.7 100.0 #
-25RGGVUDWLR&,FRQ¿GHQFHLQWHUYDOȡRIOLQHDUWHQGHQF\3HDUVRQȤWHVW#25FRXOGQRWEHFDOFXODWHG,QGLFDWHVVLJQL¿FDQWGLIIHUHQFHEHWZHHQPDOH
DQGIHPDOHJURXSVDFFRUGLQJWRWKH3HDUVRQȤWHVWȡ
with a relevant difference between men (7.7%) and women (33.6%)25.
References
1. World Health Organization/International Society of Hypertension. Guidelines for the management of hypertension. J Hypertens. 1999; 17: 151-83.
2. Sociedade Brasileira de Hipertensão. IV Diretrizes brasileiras de hipertensão arterial. Rev Bras Hipertens. 2002; 9: 359-408.
3. Hamet P. The burden of blood pressure: where are we and where should we go? Can Cardiol. 2000; 16: 1483-7.
4. Lessa I, Mendonça GA, Teixeira MT. Non-communicable chronic diseases in Brazil: from risk factors to social impact. Bol Oficina Sanit Panam. 1996; 120: 389-413.
5. Lohman TG, Roche AF, Martorell R. Anthropometric standardization reference manual. Champaign: Human Kinetics Books; 1988.
6. Pichard C, Kyle UG, Bracco D, Slosman DO, Morabia A, Schutz Y. Reference values of fat-free and fat masses by bioelectrical impedance analysis in 3393 healthy subjects. Nutrition. 2000; 16: 245-54.
7. Physical status: the use and interpretation of anthropometry. Report of a WHO Expert Committee. World Health Organ Tech Rep Ser. 1995; 854: 1-452.
8. Singi G, Gazola R, Bento AC. Arterial hypertension in country. Rev Bras Med. 2000; 57: 836-40.
9. Matos AC, Ladeia AM. Assessment of cardiovascular risk factors in rural community in the Brazilian state of Bahia. Arq Bras Cardiol. 2003; 81: 297-302.
10. Lena SM, Cingolani HE, Almiron MA, Echeverria R. Prevalence of arterial hypertension in a rural population of the Province of Buenos Aires. Medicina (Buenos Aires). 1995; 55: 225-30.
11. Fasce E, Perez H, Boggiano G, Ibanez P, Nieto C. Hypertension in rural communities: study in the VIII region, Chile. Rev Med Chile. 1993; 121:
1058-67.
12. Anselmi M, Avanzini F, Moreira JM, Montalvo G, Arman D, Pradi R, et al. Treatment and control of arterial hypertension in a rural community in Ecuador. Lancet. 2003; 361: 1186-7.
13. Guerrero-Romero JF, Rodriguez-Moran M. Prevalence of arterial hypertension and related factors in a marginated rural population. Salud Public Mex. 1998; 40: 339-46.
14. Lolio CA. Prevalence of arterial hypertension in Araraquara. Arq Bras Cardiol. 1990; 55: 167-73.
15. Martins IS, Marucci MFN, Velásquez-Meléndez G, Coelho LP, Cervato AM. Atherosclerotic cardiovascular disease, lipemic disorders, hypertension, obesity and diabetes mellitus in the population of a metropolitan area of south-eastern Brazil. III – Hypertension. Rev Saude Publica. 1997; 31: 466-71.
16. Hildreth CJ, Saunders E. Hypertension in blacks. Md Med J. 1991; 40: 213-7.
17. Gillum RF, Mussolino ME, Madans JH. Body fat distribution and hypertension incidence in women and men. The NHANES I epidemiological follow-up study. Int J Obes Relat Metab Disord. 1998; 22: 127-34.
18. Han TS, Van Leer EM, Seidell JC, Lean MEJ. Waist circumference action levels in the identification of cardiovascular risk factors: prevalence study in a random sample. BMJ. 1995; 331: 1401-5.
19. Lamarche B, Tchernof A, Mauriege P, Cantin B, Dagenais GR, Lupien PJ, et al. Fasting insulin and apolipoprotein B levels and low-density lipoprotein particle size as risk factors for ischemic heart disease. JAMA. 1998; 279: 1955-61.
20. Coughlan BJ, Sorrentino MJ. Does hypertriglyceridemia increase risk for CAD? Growing evidence suggests it plays a role. Postgrad Med. 2000; 108: 77-84.
21. Bard JM, Charles MA, Juhan-Vague I, Safar AP, Fruchart JC, Eschewege E. Table 5 -Multivariate logistic regression model for hypertension
Variables OR CI (95%) Ȣ Sex
Females 1.00 reference
Males 2.03 1.01 – 4.05 0.046
Age (years)* 1.05 1.03 – 1.07 < 0.001
Triglycerides
Normal 1.00 reference
+LJKPJG/ 6.04 1.22 – 29.89 0.027
Waist circumference
Normal 1.0 reference
Risk level 1 (females 80-88
cm; males 94-102 cm) 2.63 0.98 – 7.02 0.054
5LVNOHYHOIHPDOHVFP
PDOHVFP 3.84 1.50 – 9.85 0.005 25RGGVUDWLR&,FRQ¿GHQFHLQWHUYDO$JHHQWHUHGDVDFRQWLQXRXV YDULDEOH
causative since determinants and outcomes were measured at a single point in time. However, the multivariate model indicated that the potential factors independently associated with AH within the population of Virgem das Graças were age, sex, hypertriglyceridemia and abdominal obesity. It is of
noteworthy that the high prevalence of AH, dyslipidemia and obesity revealed by this study are conditions for increased risk of atherosclerosis, which in turn is a relevant factor for the occurrence of myocardial infarction and stroke22. It is thus necessary for the appropriate authorities urgently to adopt measures for the treatment, control and prevention of AH, dyslipidemia and obesity with a view to reducing the incidence of incapacitating and lethal cardiovascular diseases in rural populations.
Potential Conflict of Interest
No potential conflict of interest relevant to this article was reported.
Sources of Funding
This study was funded by Conselho Nacional de Desenvolvimento Científico e Tecnológico (CNPq); Fundação de Amparo à Pesquisa do Estado de Minas Gerais (FAPEMIG); National Institute of Health (NIH); Fogarty International Center.
Study Association
Accumulation of triglyceride-rich lipoprotein in subjects with abdominal obesity: the biguanides and the prevention of the risk of obesity (BIGPRO Study Group). Arterioscler Thromb Vasc Biol. 2001; 21: 407-14.
22. Lemieux I, Pascot A, Couillard C, Lamarche B, Tchernof A, Almeras N, et al. Hypertriglyceridemic waist: a marker of the metabolic triad (hyperinsulinemia; hyperapolipoprotein B; small, dense LDL) in men? Circulation. 2000; 102: 179-84.
23. Solati M, Ghanbarian A, Rahmani M, Sarbazi N, Allahverdian S, Azizi F.
Cardiovascular risk factors in males with hypertriglycemic waist (Tehran Lipid and Glucose Study). Int J Obes Relat Metab Disord. 2004; 28: 706-9.
24. Scarsella C, Despress JP. Treatment of obesity: the need to target attention on high-risk patients characterized by abdominal obesity. Cad Saude Publica. 2003; 19: 7-19.