Pergamon Engineering Fracture Mechanics Vol. 59, No. 1, pp. 57-71, 1998 © 1997 Elsevier Science Ltd. All rights reserved Printed in Great Britain
PII: S0013-7944(97)00088-X 0013-7944/98 $19.00 + 0.00
BIMATERIAL BRAZILIAN SPECIMEN FOR D E T E R M I N I N G
INTERFACIAL F R A C T U R E TOUGHNESS
JORGE B. SOARES
Texas A&M University, College Station, TX 77843, U.S.A. TIANXI TANG
Texas Transportation Institute, College Station, TX 77843, U.S.A.
Abstract--The test specimen proposed in this study, named the bimaterial Brazilian specimen, is a cylindrical specimen consisting of two dissimilar materials with a cross-section through a diameter of the cylinder as their interface. Stress intensity factors for the tip of the crack in the interface were cali- brated with the finite element method for several different moduli combinations and loading directions. Specimens consisting of mortar and rock were prepared and tested to simulate the mortar-aggregate interface in concrete. Test results show that apparent mortar-limestone interfacial fracture toughness increases with the phase angle and also that specimen size has significant effects on the apparent inter- facial toughness. The possibility of investigating the effect of specimen size in the interfacial toughness is particularly important in the study of a heterogeneous medium (such as concrete) since the size of in- clusions (such as aggregate in concrete) is known to affect the strength of the medium. © 1997 Elsevier Science Ltd
Keywords--concrete, cylindrical specimen, fracture toughness, fracture process zone, interfacial fracture, nonlinearity, size effect
1. I N T R O D U C T I O N
SINCE THE study by Williams [1], m a n y efforts have been made in order to understand the unu- sual characteristics of bimaterial interface fracturing [2-6]. In the recent decade, further investi- gation has been performed [7-12]. Several test specimens have been proposed to measure interracial toughness. Charalambides e t al. [13] proposed a bimaterial notched four-point bend- ing beam specimen, where two dissimilar materials were horizontally layered. Suo and H u t c h i n s o n [ l l] developed a universal relation to associate the actual stress intensity factor for an interface crack between a very thin layer o f second material and bulk material with the apparent stress intensity factor for a similar crack in the bulk material without the interlayer. On this theoretical basis, they proposed sandwich specimens, which can be well applied to inter- faces between thin films and substrates. Wang and Suo[14] calibrated a cylindrical sandwich spe- cimen, named the Brazil-nut-sandwich, in reference to the unnotched cylindrical specimen of a homogeneous material originally introduced by Carneiro in Brazil [15] for determining indirect tensile strength. With different orientations of the interlayer with respect to the loading direc- tion, the Brazil-nut-sandwich specimen provides a range of phase angles. Lee and Buyukozturk[16] used the Brazil-nut-sandwich specimen to analyze m o r t a r - a g g r e g a t e interfaces. In their specimen, m o r t a r sandwiched a thin layer of aggregate. Besides the Brazil-nut-sandwich, Lee and Buyukozturk designed another sandwich specimen, it was a four-point bending beam specimen, but in contrast to the one proposed by Charalambides e t al. [13], a thin interlayer (made o f aggregate) was vertically located in the middle of the beam (made of mortar). Both beam specimens provided a single phase angle. Wang and Maji [17] developed the bimaterial compact tension specimen to test m o r t a r - r o c k interfaces. The bimaterial compact tension speci- men also provided a fixed phase angle.
In concrete, the interface between m o r t a r and aggregate is the weakest link. The strength of concrete largely depends on the m o r t a r - a g g r e g a t e interfacial fracture toughness. It has also been known that there exists a sizeable fracture process zone in front of a macroscopic crack in concrete [18]. The fracture process zone is full of microcracks. Initiation and development of these microcracks consume a large a m o u n t of energy and therefore toughen concrete. Additional energy is dissipated in the fracture process zone through crack deflection, friction
58 J.B. SOARES and T. TANG
between crack surfaces, crack tip blunting, crack branching, and rupture or pull-out of aggre- gate bridging crack surfaces. Based on this understanding, several fracture models of effective crack type have been proposed to characterize fracturing in concrete[19-22]. These models mod- ify linear elastic fracture mechanics by introducing an effective crack to reflect the nonlinearity of concrete fracture. Other models consider the total crack to be formed by the "real" crack (stress-free zone) plus the process zone ahead of the crack tip where cohesive stresses exist[23].
Microcracks in concrete exist not only in mortar but also in aggregate [24]. Therefore the fracture process zone depends on both the mortar and aggregate. As a matter of fact, the size of aggregate considerably affects the strength of concrete. Since the Brazil-nut-sandwich specimen requires a thin interlayer which is much less than the dimensions of real aggregates in concrete, this specimen might not be able to adequately simulate the mortar-aggregate interface. In order to measure both the effect of phase angle and the effect of size on the interfacial fracture tough- ness, this paper proposes a bimaterial Brazilian specimen that consists of half mortar and half rock. In the interface of mortar and rock, there is an initial crack. The bulks of mortar and rock allow microcracks to develop in both materials in front of the initial macrocrack. Thus, ob- servation of nonlinear interface fracture becomes possible.
The bimaterial Brazilian specimen has been calibrated with finite element analysis for many combinations of moduli of dissimilar materials. The finite element analysis performed with the ABAQUS program developed by Hibbit et al. [25] makes use of the virtual crack extension method [26] to calculate the J-integral, which gives the energy release rate. The energy release rate is also calculated with the crack surface displacement method by Matos et al. [27]. The crack surface displacement method allows for the calculation of the interfacial stress intensity factors and respective phase angle.
Although the bimaterial Brazilian specimen can be used to test interfaces of various differ- ent dissimilar materials, it was used to test mortar-limestone interfaces in the experimental pro- gram reported in this paper. Test results manifest that the mortar-limestone interfacial fracture toughness increases with the phase angle, as indicated by Lee and Buyukozturk[16]. Test results also show that specimen size had apparent effects on the interfacial toughness.
2. BACKGROUND
2.1. Theoretical aspects
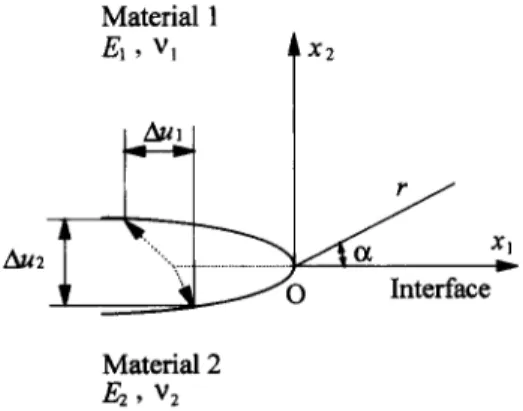
As opposed to homogeneous/isotropic materials, the fracture mode on an interface of dis- similar materials is intrinsically mixed due to the asymmetry in the elastic properties across the interface. A major advance in the subject of a crack lying on an interface of dissimilar materials was made by Williams [1], who determined the oscillatory character of stresses ahead of the crack tip, a ~ r ~, where r is the distance ahead of the crack tip (Fig. 1) and 2 are eigenvalues of the form 2 = n - 1/2 + iE, with n an integer and E the oscillatory index, a function of material constants:
Material 1
E I , V I X2
Interface
Material 2 E2, V2
Fracture of bimaterial Brazilian specimen
r(',+ '_)I
= 1 l n / \ / a l / ~ 2 / /
59
(1)
where x = 3 - 4v and (3 - v)/(1 + v), respectively, for plane strain and plane stress, with v and # the Poisson ratio and shear modulus• Subscripts 1 and 2 refer to the two materials (Fig. 1). The quantity e vanishes when the two materials are identical• Other eigenvalues of form 2 = n also exist, as pointed out by Rice [10]. Williams' results were restricted to in-plane loads. Bending loads were investigated by Sih and Rice[2].
The in-plane stress a distance r ahead o f the crack tip on ~ = 0 (Fig. 1) can be written in complex form as[8]:
(KI + iK2)~'
0"22 "+- ial2 -- (2)
24 7
where i = qc-~; K = KI + iK2 is related to the interface crack stress intensity factor as originally introduced by eq. (31) in Rice and Sih [4], k = k l + i k 2 . Hutchinson
et al.
[8] defined K = k(n)l/2cosh(rcE), so that the traction vector on the interface can be given by[(0"22)2+ (O"12)2] 1 / 2 =
IKl/(2rcr) 1/2,
as in the homogeneous material case. However, K1 and K2 can- not be interpreted as conventional mode I (opening mode) and mode II (shear mode) stress intensity factors, respectively. Moreover, K (and also k) contains a term r -i' and as a result has1/2 1E
a material-dependent dimension (e.g. M P a m m - ) . To circumvent this problem, Rice [10]
• * * . * .
suggested the definition o f a new rotated quantity, K = K 1 + IK 2, given by the scale invariant product K* = (KI + iK2)?', where ~ is a particular value o f radial distance. Invariant to speci- men and crack dimensions, ~ can be taken as a material length. K* is referred to as the stress intensity factor o f "classical type" because it has the same dimension as in the case o f homo- geneous materials (e.g. M P a ml/2). K* is characterized by the fact that it has the same modulus
• ^ . . •
of K but a different phase angle, ~ = ~k + e ln(r). F o r the asymptotic solution of the stress dis-
. . . . * •
trlbutlon near the crack tip m terms of K 1 and K E, refer to Lu and Chlang[12].
When E = 0 and therefore (r/~) iE and r i~ are unit, K ~ and K 2 are the same as K1 a n d / ( 2 . In this case, they have a conventional interpretation as mode I and mode II stress intensity fac- tors and they are directly related to normal and shear singularities on the interface ahead o f the crack tip. When e ~ 0, since r iE= e k In r = c o s ( E In r) + i sin(E In r), from eq. (2) it is seen that stress oscillation occurs•
The relative crack face displacements (Fig. 1) at a distance r behind the tip can be expressed in terms o f the complex stress intensity factor K = K1 +iK2 as[11]:
Cl "l- C2 z " ~ "e
. . . . , t/~l + iK2) ? (3)
Au2 + iAul 2(1 + i2e) cosh(~e)
where Au2 and AUl represent relative displacements of two initially superposed points on the crack surfaces; the subscripts in the parameter c refer to the two materials, and c = (x + 1)//z, that is c =
8/E
for plane stress and c = 8(1 -vE)/E
for plane strain. Crack surface interpenetra- tion behind the tip is caused in a small region when e # 0128].The complex displacement can also be written as u = Au2 + iAUl = [Aute i~, where IAol and tp
2 1/2 lfl
are the modulus and the argument of the complex quantity u. Note that (1 + i2e) = (1 + 4E ) e
• , 7 • • * "
(fl being arctan(2e)). In terms o f the "classical type stress intensity factor K = K~ E, eq. (3) can be written as:
el + C2
t K * * r i' 2/~r i ~IAulei* = 4 4 1 + ~ ~osh(ne) ~ I + iK
2)r~E
~ / ~ - e - P. (4)60 J.B. SOARES and T. T A N G
Cl --I-- c2 IK.12" (5)
G - 16 cosh2(TtE)
The energy release rate G is equal to the J-integral[6]. Equations (4) and (5) are particularly useful for numerical analysis of the bimaterial interfacial crack.
2.2. Computational aspects
In order to compute the interfacial stress intensity factors, K l and K2, from displacement outputs in the finite element analysis, it is convenient to rewrite eq. (4) with all complex quan-
tities in polar form as eq. (17) in Matos et al.[27]:
( , ( r ) )
V/ ¢,, +E In
IAule i* = Cl + c2 K ~'2 ~/~ 2/~ i - fl
4 V q - + - ~ cosh(nE) K ~'2 + ~/~-~ e . (6)
From eq. (6), the following two equations result for plane strain, which can be used to cal- culate the interfacial stress intensity factors from the crack surface displacements:
+ 4d)(Au~ + iAu2 2) cosh(nE)
2[(1 - Pl)/~l + (1 -- p2)/~2]~/~x/~ (7)
Instead of using the displacements in eq. (7),
IK*I
can also be obtained from the energyrelease rate G. For a plane interface, the energy release rate G can be given by the J-integral in the bimaterial [6]. Special attention is needed in calculating the J-integral since the crack is
located in a bimaterial interface. Matos et al. [27] obtained the interfacial stress intensity factors,
K ~ and K 2, from the J-integral calculated by the virtual crack extension technique[26, 29].
IK*I
can be obtained from the J-integral value with the following relationship, which is converted to form eq. (5) for plane strain:
~ ( c o s h ( r t E ) . (9)
IK*I = 1 -
vl)/l~l +J
(1 - v 2 ) / # 2 -2The finite element nodes at which
IK*I
and if* are calculated from eqs (7) and (8) can beselected through a consistency check with the
IK*I
value obtained from eq. (9). Through thisconsistency check, more reliable results for
IK*I
and ~/* can be obtained.3. A N A L Y S I S O F T H E B I M A T E R I A L B R A Z I L I A N S P E C I M E N
The bimaterial Brazilian specimen as illustrated in Fig. 2 is calibrated with the finite el- ement method by using ABAQUS [25]. The crack surface displacement method and the J-inte-
Materi~~ al 2
Material 1
~ Support
Fracture of bimaterial Brazilian specimen 61
gral method, as described in the previous section, are used to determine [K* I and ~*. Specimens with crack length-to-diameter ratios (2a/d) of 0.25, 0.375, and 0.50 are considered. Each speci- men with different 2a/d values is analyzed under different material combinations (moduli ratio
Ez/E1-- 1, 1.5, 2, 2.5, 5, and 10) and different loading angles (0 -- 0 °, 7.5 °, 15 °, and 22.5°). Plane
strain conditions are assumed. In all computation cases, a unit load/thickness (1 N / m m or 5.71 lb/in) is used. Moreover, a unit diameter specimen (d = 1 mm or 0.0393 in) is used for all combinations of E2/E1 and 0 (El is assumed to be 1 N / m m 2 or 145 psi). Poisson ratios for both materials are taken as vl = v2 = v = 0.22.
The angle of inclination of the interface with respect to the diametral line of loading, 0, causes different mixed-mode stress states. The analysis indicates that angle values above 22.5 ° cause crack closure even away from the crack tip for any of the material combinations
(E2/E1)
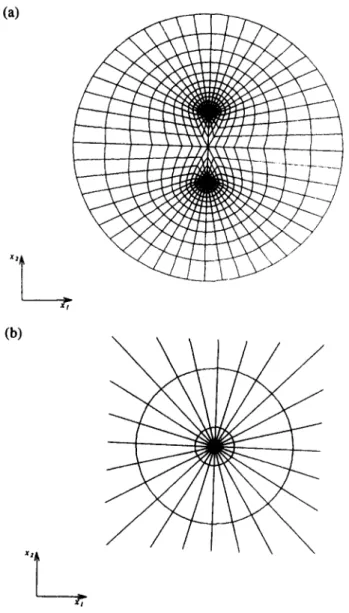
used. The results for E2/E1 = 1 are in agreement with the analysis of a homogeneous cylinder performed by Atkinson et al. [30]. In the analysis referred to, as the crack orientation departs from the vertical, the normalized stress intensity factor changes sign at a loading angle 0 of ap- proximately 22.5 ° , which indicates crack closure. The present analysis indicates crack closure for smaller angles when moduli ratio and crack length to cylinder diameter ratios are large. Whenever crack closure occurs, a condition of Au2 = 0 (Fig. 1) needs to be incorporated in the model and an additional traction develops along the crack surface due to friction. Atkinson et al. [30] investigated the presence of friction effects in homogeneous cylinders under mixed-mode conditions, and Charalambides [31] investigated the effects of friction and residual strain caused by expansion mismatch in a beam specimen. Friction effects are not discussed in this study, that is, all the analysis and tests are restricted so that the crack is opened when the specimen is under load (Au2 > 0 except for the small region near the crack tip where crack surfaces interpe- netrate due to a nonzero E).The finite element mesh is extremely refined at the tip of the crack. Eight-node elements with a radial focus at the crack tip were used. The innermost elements are degenerated into tri- angles at the crack tip. The mesh utilized for the analysis of the specimen with 2a/d = 0.25 is il- lustrated in Fig. 3(a). The focused portion of the mesh is shown in Fig. 3(b). The mid-nodes of the element sides around the crack tip are moved to the quarter-point position to model the square root singularity present in the solution close to the crack tip.
The load is modeled as a single point load in the vertical direction (x2) in Fig. 2. A con- straint in the horizontal direction (xl) is used at the load acting point. The support is modeled as a single node fixed in both Xl and x2 directions in order to avoid rigid body motion. The crack surfaces are traction free. Since the fracture properties are different for the two tips of the crack (tips A and B in Fig. 2) for moduli ratios other than 1 and loading angles other than zero, it is noted that the right (for 0 = 0) or upper right (for 0 > 0) half of the cylinder (material 2) is assumed to have a higher modulus than the other half (material 1), that is, E2 > El.
The J-integral is computed along six integral contours. The first contour is the closest to the crack tip and the sixth is the farthest. The J values from the fourth to the sixth contour for every case are either identical or have differences of 1 to 3 units in the last digit of the five-digit output. To be consistent, IK*[ is calculated from the J values along the sixth contour for all cases.
When using the crack surface displacement method, there is the problem of selecting the nodes at which displacements Aul and Au2 are adopted. The estimate of [K*[ from displacements with eq. (7) varies slightly with r/P, where ~ is taken as 1 x 10 -5 mm. Therefore IK*[ is calculated from the displacements AUl and Au2 at several pairs of nodes close to the crack tip. As suggested by Matos et al. [27], the pair of nodes that provide the [K*[ value closest to that obtained with the J-integral is selected. The displacements Aul and Au2 at the selected nodes are then used to calculate ~,* with eq. (8). In our computation, the value of r for selected nodes is near 1.1 x 10 -4 mm, or r/d,~ 1.1 x 10⁻⁴. In all the cases analyzed, differences in the IK*[ values obtained through the two different approaches are less than 2%. With the phase angle and mod- , ulus, the interfacial stress intensity factors K ~ and K 2 are computed by finding the real and imaginary parts of the quantity ]K*l ei~'*.
62 J.B. SOARES and T. TANG (a)
(b)
--g.
J
Fig. 3. (a) Finite element mesh; (b) close look near the crack tip
fixed ratio of crack length to specimen diameter
2a/d,
and a fixed loading angle 0). Therefore, the energy release rate G is proportional tocrZd/E1 '
orPa/b2dE(
for any fixed specimen geome- try, Vl, v2, andEz/EI
ratio. The quantitiesGE(b2d/p 2 and
K*bdl/2/P are referred to as the nor-
malized energy release rate and the normalized interfacial stress intensity factor, respectively (where E' = E andEl(1 -
v 2) for plane stress and plane strain, respectively). These non-dimen- sional quantities are defined for different loading angles 0, different moduli ratioE2/EI
and crack-to-diameter ratio2aid.
They can be used to obtain the energy release rate G and the inter- facial stress intensity factor K* when load, specimen dimensions, and elastic constants are known.The normalized energy release rates for tip A for different moduli and crack length-to-di- ameter ratios are summarized in Table 1. The energy release rate and interfacial stress intensity factors are equal for tips A and B when 0 = 0 ° or
Ez/EI = 1. Otherwise the energy release rate is
higher for tip A in all cases. The empty cells in Table 1 refer to those cases where crack closure occurs. The normalized interfacial stress intensity factors for tipA, K ~bdl/2/P
andK 2bdl/z/P,
are given in Table 2, corresponding to the energy and phase angle values presented in Table 1.Fracture of bimaterial Brazilian specimen 63
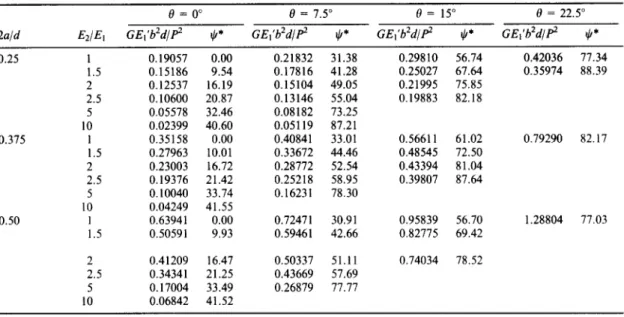
Table 1. Normalized energy release rate GE~'b2d/p 2 and phase angle ~0" for different elastic moduli ratios and loading directions
0 = 0 ° 0 = 7.5 ° 0 = 15 ° 0 = 22.5 °
2a/d Ez/Ej GEt'b2d/P 2 tp* GEl'b2d/p 2 ~O* GEl'b2d/P 2 ~* GEI'b2d/P 2 ~k*
0.25 I 0.19057 0.00 0.21832 31.38 0.29810 56.74 0.42036 77.34 1.5 0.15186 9.54 0.17816 41.28 0.25027 67.64 0.35974 88.39 2 0.12537 16.19 0.15104 49.05 0.21995 75.85
2.5 0.10600 20.87 0.13146 55.04 0.19883 82.18 5 0.05578 32.46 0.08182 73.25
10 0.02399 40.60 0.05119 87.21
0.375 1 0.35158 0.00 0.40841 33.01 0.56611 61.02 0.79290 82.17 1.5 0.27963 10.01 0.33672 44.46 0.48545 72.50
2 0.23003 16.72 0.28772 52.54 0.43394 81.04 2.5 0.19376 21.42 0.25218 58.95 0.39807 87.64 5 0.10040 33.74 0.16231 78.30
10 0.04249 41.55
0.50 1 0.63941 0.00 0.72471 30.91 0.95839 56.70 1.28804 77.03 1.5 0.50591 9.93 0.59461 42.66 0.82775 69.42
2 0.41209 16.47 0.50337 51.11 2.5 0.34341 21.25 0.43669 57.69 5 0.17004 33.49 0.26879 77.77 10 0.06842 41.52
0.74034 78.52
Note: ~ is taken as 1 x 10 -5 mm..
also shown (also for the case of
2a/d
= 0.25). Plots of howK lbdl/2/P
andK ~bdl/2/P
vary withE2/EI
and 0 are given in Fig. 5(a) and (b) for the case of2a/d
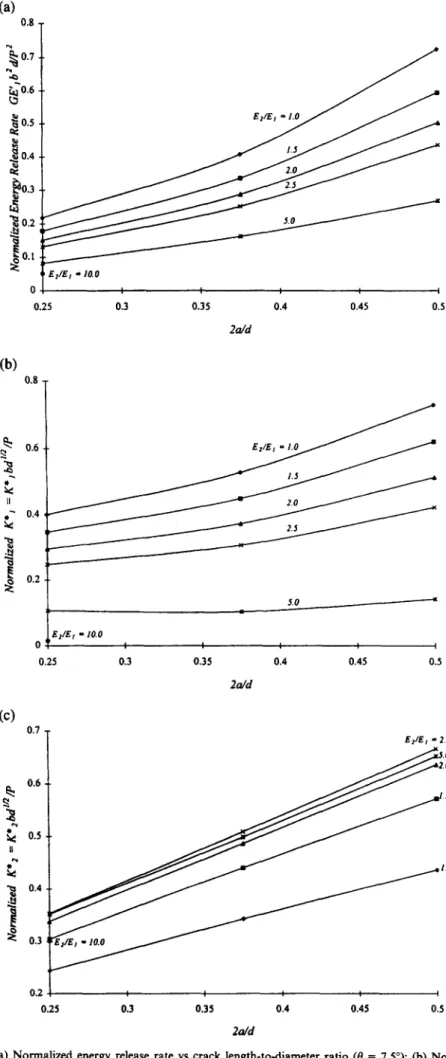
= 0.25.For 0 = 7.5 °, the trend of the normalized energy release rate and corresponding interfacial stress intensity factors (for tip A) with the crack length-to-diameter ratio is depicted in Fig. 6(a)- (c) for the three ratios analyzed (0.25, 0.375, and 0.50). The energy release rate increases as the crack size increases. As in Fig. 4(a) and (b), it is seen in Fig. 6(a) that higher energies are associ- ated with smaller moduli ratios. Figure 7 shows that the phase angle ~b* is relatively insensitive to the crack-to-diameter ratio.
4. TESTS
4.1. Specimen preparation
The bimaterial specimens constituted by mortar and limestone were prepared using the fol- lowing procedures.
Table 2. Normalized interracial stress intensity factors K*bdt/2/P for different elastic moduli ratios and loading directions
0 = 0 ° 0 = 7.5 ° 0 = 15 ° 0 = 22.5 °
2a/a
Ez/E, K~bd'/Z/e g~6a'/z/e g~6dl/z/e K~6a'/=/e g~ba'/2/e K~ba'/z/e g~ba'/2/V
g~bdl/2/e
0.25 1 0.43601 0.00000 0.40060 0.24437 0.29761 0.45383 0.14139 0.62926 1.5 0.42054 0.07065 0.34706 0.30465 0.20741 0.50433 0.01830 0.65285 2 0.39251 0.11399 0.29373 0.33851 0.13172 0.52263
2.5 0.36267 0.13824 0.24693 0.35312 0.07203 0.52473 5 0.25734 0.16367 0.10593 0.35193
10 0.15810 0.13549 0.01472 0.30175
0.375 1 0.58694 0.00000 0.52727 0.34260 0.36098 0.65177 0.11949 0.86903 1.5 0.56440 0.09963 0.44865 0.44035 0.22622 0.71736
2 0.52482 0.15763 0.37230 0.48594 0.11648 0.73917 2.5 0.48461 0.19016 0.30589 0.50818 0.03048 0.74099 5 0.33324 0.22258 0.10312 0.49805
10 0.20522 0.18191
0.50 1 0.79877 0.00000 0.72875 0.43638 0.53326 0.81167 0.25310 1.09880 1.5 0.76675 0.13426 0.61955 0.57082 0.34848 0.92823
2 0.70981 0.20983 0.51256 0.63554 0.19646 0.96759 2.5 0.65159 0.25334 0.42097 0.66559
5 0.44338 0.29330 0.14124 0.65139 10 0.26352 0.23331
64 J . B . SOARES and T. T A N G
(a)
0.500%
(b)
0.400
0.300
0.200
0.100
0.000 0.0
0.250
/ •
/ I
/
~ ~ . s , , , / /
E,IE, - I o . - ' ' " "
. . . . ~ ~..~" ZJ...""
I I I I
20.0 40.0 60.0 80.0 100.0
~* (degrees)
0 in degrees
,~0.200
~0.150
~
o.1~0.05o
0.000
0 in degrees
- - ~ ~"""'-~ for tip A
for tips A and B
I I I I I I I I I l
l 2 3 4 5 6 7 8 9 I0
E 2/E I
Fig. 4. (a) Normalized energy release rate vs ~* (2a/d = 0.25); (b) normalized energy release rate vs
E2/EI (2aid = 0.25)
1. Core a cylinder of a rock (limestone). Sawcut it longitudinally in two halves. Introduce a notch in the specimen by attaching a thin plate to one side of the half limestone cylinder. Cast mortar against the half limestone cylinder in a concrete cylinder mold. Notches formed by the thin plate should not be more than 2 mm (0.06 in) thick.
2. Sawcut a rock (limestone) so that it fits in a typical beam mold (width x depth x span 152.4 mm x 152.4 mm x 533.4 mm, i.e. 6 in x 6 in x 21 in) and has only half the beam depth. Introduce notches of different sizes by attaching thin plates to the top of the limestone half- beam. Cast the mortar against the limestone half-beam. After the mortar is cured, cylinders of different sizes are cored from the bimaterial beam (Fig. 8).
Fracture of bimaterial Brazilian specimen 65 0.50
0.40
0.30 tl o
~
0.200.10
0.00 0
(b)
0 . 4 0! I I I I I I I I I
I 2 3 4 5 6 7 8 9 lO
E 2/E I
,it.'* ii
0.35
0.30
0.25
0.20
0.15
0.10
0.05
0.00 0
/
1 2 3 4
e in dessees
..~.fo,,. t ~ .4 m,d a
I I I I I I I
5 6 7 8 9 I0
E z/E I
Fig. 5. (a) Normahzed mterfaclal stress intensity factor. K ] vs E2/EI (2a/d = 0.25); (b) normalized inteffacial stress intensity factor K ~ vs E:/E] (2aid = 0.25)
Type I cement and sand passing through sieve number 4 were used. Average elastic moduli for the materials composing the specimens in both batches were E1=35 GPa (mortar) and E2 = 45.5 G P a (limestone), which resulted in E2/EI = 1.3.
F o r the first part of the investigation, eight specimens were prepared in batch 1 following the first procedure outlined above. These specimens had the same dimensions: 101.6 mm (4 in) in diameter and 38.1 mm (1.5 in) in thickness. All of the specimens were cured in a moisture room after casting. Four of them were tested 14 days after casting while the other specimens were tested when they were 70 days old. O f the specimens that were tested at the same age, each was tested with a different loading angle, 0 = 0 °, 7.5 °, 15 °, and 22.5 °, respectively.
(a)
0.8
~
0.73 ~0.6
~
0.5~
0.4 ~ 0 , 3~
0.20 0.25
E:/EI - 1.0
1.5
2.0 2.3
, E~:/EI - I0.0
I I I I I
0.3 0.35 0.4 0.45 0.5
2 ~ d
(b)
0.8
LI
]
0.6
0,4
0.2
J 2.3
E z / E I - 10.0
0 I
0,25 0.3 0.35
2 a / d
5.0
I I I
0.4 0.45 0.5
(c)
0.7
0.6
0.5
"~ 0.4
;~ 0 . 3
0.2
E2/EI " 2.5
3.0 2.0
I I I I I
0.25 0.3 0.35 0.4 0.45 0,5
2 a / d
Fig. 6. (a) Normalized energy release rate vs crack length-to-diameter ratio (0 = 7.5°); (b) Normalized interfacial stress intensity factor K ~" vs crack length-to-diameter ratio (0 = 7 5°); (c) normalized inter-
!
Fracture of bimaterial Brazilian specimen
90.0
EI/E~ " t O 0
80.0 E~/£ s ~ 5 0
70.0
60.0 E d E , = 2 5
E~/gx - 2 0
50.0
E ~/E, - 1 5
40.0
30.0
20.0 I I
0 25 0.3 0.35 0.4 0.45
2 o l d
Fig. 7.0* vs crack length-to-diameter ratio
I
0.5
67
diameters, two of 50.8 mm (2 in), two of 76.2 mm (3 in) and two of 101.6 mm (4 in), were cored from the bimaterial beam 10 days after casting. After being cored, these specimens were put back in the moisture room until they were tested at age 28 days. All these specimens were tested with 0 = 7.5 °.
4.2. Test results
For both parts of the investigation, diametral compression tests were performed on an MTS machine. A nominal loading rate of 17.25 kPa/s (150 psi/min) was used for all the tests. The maximum tensile stress in the unnotched split tension cylinder of a homogeneous ma- terial, that is, P/nbd, was used in calculating the nominal loading rate. Narrow wooden bear- ing strips were used to prevent crushing. The load and displacement of the load point were recorded.
In the investigation of the loading angle effect, for the tests with 0 = 0 °, the load continued to increase after the interface was completely debonded because the platens held the split speci- men until both halves of the specimen ruptured. Therefore the maximum load recorded was not the load that caused the interfacial failure. Fracture toughness for these specimens was not obtained. The test with 0 = 0 ° may be improved in further research, however, it is uncertain whether the fracture initiates at one crack tip or both crack tips, because G has the same value at tip A and tip B when 0 = 0 °. When 0 > 0 °, G at tip A prevails G at tip B as shown in Fig. 4(b), and therefore crack tip A dominates failure of the specimen.
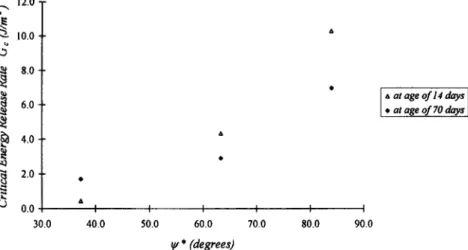
The critical fracture energy release rate or fracture toughness Gc and phase angle ~k* of the interface were calculated for other specimens from the critical load, the elastic constants, the specimen dimensions, and the normalized quantities in Tables 1 and 2. Figure 9 presents how the critical fracture energy release rate varies with the phase angle for the specimens tested at two different ages. The interfacial fracture toughness increases with the phase angle for the mor- tar-limestone interface. This was also observed by Lee and Buyukozturk [16] for both m o r t a r - granite and mortar-limestone interfaces by means of sandwich specimens. The unexpected decrease in Gc with specimen age is attributed to different curing conditions. Even though the specimens were subjected to the same curing conditions for the first 14 days, the specimens tested after 70 days were outside the moisture room during most days after 14 days. This might have caused the formation of shrinkage cracks in the interface, weakening the specimens.
68 J . B . SOARES and T. T A N G
12.0 •
10.0 •
8.0"
6.0
4.0
2.0.
0.0 30.0
&
I I I I I I
40.0 50.0 60.0 700 80.0 90.0
~, * (degrees)
Fig. 9. Critical energy release rate vs 0 "
n at age o f 14 days * at age o f 70 days
As for the effect of loading angle, Fig. 10(a)-(c) illustrates the failure types observed in the specimens. Failure through the interface only (type I failure) was observed for the specimens tested with 0 = 7.5 °. For 0 = 15 ° and 22.5 °, type II or type III failures occurred. For these two types of failure, aside from the crack through the interface, another crack through the mortar (type II) or cracks through both the mortar and limestone (type III) developed. As indicated in Fig. 10(b) and (c), these cracks in bulk material started at the tip of the notch and propagated towards the load and/or the support point. This may indicate that crack growth in the interface resulted in crack surface closure and, when the shear resistance due to friction in the interface became high enough, the crack kinked to the mortar, or to both the mortar and limestone, developing opening (mode I) cracks. For types II and III failures, the measured maximum load was still used to determine the interface fracture toughness. Lee and Buyukozturk [16] also observed cracking in mortar and aggregate besides the interface in their mortar-aggregate Brazil-nut-sandwich specimens for large loading angles, and attributed the maximum load to the interfacial fracture.
However, if the cracks in bulk materials were primary cracks or they occurred before the interfacial crack growth became unstable, it would be inappropriate to calculate the interfacial toughness from the measured maximum load. Wang and Suo[14] discussed crack kinking out of the interface into the thin interlayer observed in metal-epoxy Brazil-nut-sandwich specimens. Crack deflection in the proposed bimaterial Brazilian specimen needs to be clarified by further research.
In order to avoid any other failure types but type I, all the specimens of batch 2 were tested with the loading angle 0 = 7.5 °. These specimens were of different sizes but the same geometry. The specimen diameter was 50.8 mm (2 in) for two specimens, 76.2 mm (3 in) for two specimens
Load d i r ~ o n
Type I ~ II Type IIl
Fracture o f bimaterial Brazilian specimen 69
and 101.6 mm (4 in) for two other specimens, while the ratio of the crack length to the cylinder diameter
2a/d
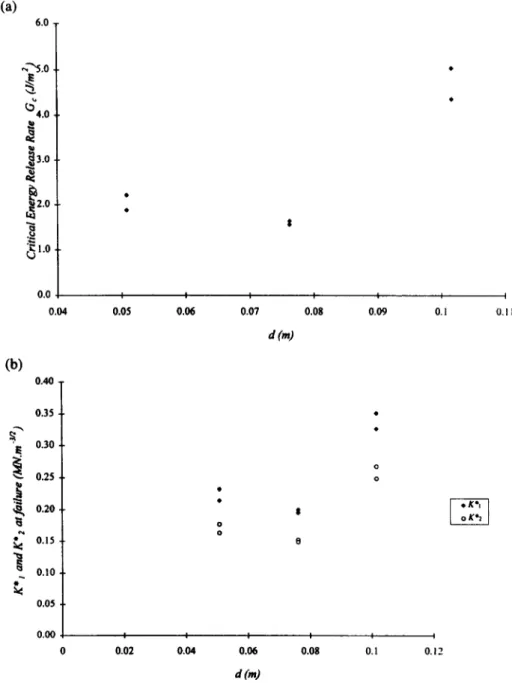
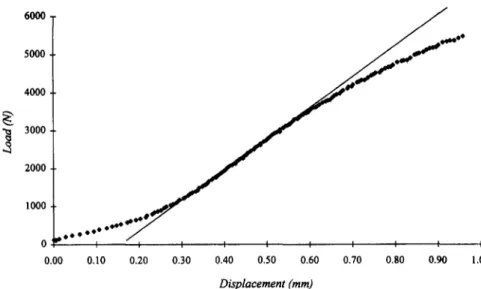
was constant, that is, 0.25. Only type I or pure interfacial failure was observed. Critical fracture energy release rate or fracture toughness for each specimen was calculated from the measured maximum load, and its change with the specimen size is shown in Fig. 1 l(a). The difference in fracture toughness was apparently caused by the specimen size, because specimen geometry, boundary conditions and fracture type were all identical for all the specimens. The only factor that varied with specimen was the specimen size. Interfacial stress intensity factors at failure were also calculated. They are shown in Fig. 1 l(b).The size effect observed reveals the nonlinearity of the mortar-aggregate interfacial frac- ture. Actually, the load vs load-point displacement curve obtained in each test appears nonlinear beyond a load limit. Figure 12 shows the curve of a specimen of 76.2 mm (3 in) diameter and 0.25 in crack length-to-diameter ratio which was tested at 0 = 7.5 °. A straight line drawn in the figure supplies a reference. The initial nonlinear part of the curve was formed when the wooden
(a)
6.0
,',,-"~ .0
~ 4 . 0
t 3.0
~
2.0~
1.00.0
0.04
I
0.05
!
0.06
I
0.1
0.07 0.08 0.09
d(m)
I 0 . 1 1
(b)
0.40
0.35
~' 0.30
E
0.25
~ 0.20
*"* 0.15 :<
0.10
0.05
0.00 I I | I ( I
0.02 0.04 0.06 0.08 O. 1 O, I 2
d(m)
70 J.B. SOARES and T. TANG
6000 / ~ , , m * *
5000
4 0 0 0
3000
2000
1000
bl, o O • ~ ° ° ~
0 I I I I I I I I I I
0.00 0.10 0.20 0.30 0.40 0.50 0.60 0.70 0.80 0.90 1.00
Displacement (mm)
Fig. 12. Load vs load point displacement curve
load bearing strips were squeezed. The curve appears linear until a limit. Beyond the limit, it manifests obvious nonlinearity.
In summary, when linear elastic interface fracture mechanics is used, Gc of the mortar- aggregate interface (calculated from the measured maximum load assuming no crack increase before failure) varies with both the phase angle and the specimen size. Because of the size effect, the Go-S* curve obtained from the specimens of the same size cannot be considered a material property. Accurately, we should call Gc so calculated "apparent critical interfacial fracture energy release rate" or "apparent interfacial toughness". The size effect on the interfacial frac- ture toughness needs to be studied further by testing specimens with a large size range. Sufficient experimental data would make it possible to modify linear elastic interface fracture mechanics by introducing the effective crack increase to characterize the nonlinearity. The analy- sis and test procedures presented in this paper would be useful in establishing an effective crack model, which requires only linear elastic stress analysis.
5. CONCLUSION
A new bimaterial specimen, named the bimaterial Brazilian specimen, is proposed to characterize interfacial fracture. Since the specimen was calibrated so that the fracture energy release rate and the complex stress intensity factor can be calculated when specimen diameter, crack length, and elastic moduli and loading angle are known, it can easily be applied to various dissimilar materials.
In a test program, a mortar-limestone interface was investigated with the bimaterial Brazilian specimen. The bulk materials in the specimen allow development of microcracks in both materials. Therefore the specimen can be used to simulate interfacial fracture in a hetero- geneous material involving sizeable inclusions. It was found that the apparent critical interfacial fracture energy release rate or apparent interfacial toughness depends on the specimen size as well as the phase angle. The size effect verified the nonlinearity of the interfacial fracture of mor- tar-limestone.
Acknowledgements--Support from the Texas Transportation Institute and Texas A&M University is acknowledged. The first author also acknowledges the financial support of CNPq-Brazil.
REFERENCES
1. Williams, M. L. The stress around a fault or crack in dissimilar media. Bulletin of the Seismological Society of America, 1959, 49(2), 199-204.
Fracture of bimaterial Brazilian specimen 71
3. Erdorgan, F. Stress distribution in bonded dissimilar materials with cracks. Journal of Applied Mechanics, Transactions ASME, 1965, 32, 403-410.
4. Rice, J. R. and Sih, G. C. Plane problems of cracks in dissimilar media. Journal of Applied Mechanics, Transactions ASME, 1965, 32, 418-423.
5. England, A. H. A crack between dissimilar media. Journal of Applied Mechanics, Transactions ASME, 1965, 32, 400-402.
6. Smelser, R. E. and Gurtin, M. E. On the J-integral for bi-material bodies. International Journal of Fracture, 1977, 13, 382-384.
7. Park, J. H. and Earmme, Y. Y. Application of conservation integrals to interfacial crack problems. Mechanics of Materials, 1986, 5, 261-276.
8. Hutchinson, J. W., Mear, M. E. and Rice, J. R. Crack paralleling an interface between dissimilar materials. Journal of Applied Mechanics, Transactions ASME, 1987, 54, 828-832.
9. Shih, G. F. and Asaro, R. J. Elastic-plastic analysis of cracks on bimaterial interfaces. Part I. Small scale yielding. Journal of Applied Mechanics, Transactions ASME, 1988, 55, 299-313.
10. Rice, J. R. Elastic fracture mechanics concepts for interfacial cracks. Journal of Applied Mechanics, Transactions ASME, 1988, 55, 98-103.
11. Suo, Z. and Hutchinson, J. W. Sandwich test specimens for measuring interface crack toughness. Materials Science and Engineering, 1989, AI07, 135-143.
12. Lu, H. and Chiang, F. P. Photoelastic determination of stress intensity factor of an interfacial crack in a bi-material. Journal of Applied Mechanics, Transactions ASME, 1993, 60, 93-100.
13. Charalambides, P. G., Lund, J., Evans, A. G. and McMeeking, R. M. A test specimen for determining the fracture resistance of bimaterial interfaces. Journal of Applied Mechanics, 1989, 56, 77-82.
14. Wang, J.-S. and Suo, Z. Experimental determination of interfacial toughness curves using Brazil-nut-sandwiches. Acta Metallurgica e Materialia, 1990, 38, 1279-1290.
15. Carneiro, F. L. L. B. Concrete tensile strength. R1LEM Bulletin Paris, 1953, 13, 103-107.
16. Lee, K. M. and Buyukozturk, O. Fracture analysis of mortar-aggregate interfaces in concrete. Journal of Engineering Mechanics, ASCE, 1992, 118(10), 2031-2047.
17. Wang, J. and Maji, A. K., Experimental studies and modeling of the concrete/rock interface. ACI SP-156, 1995, pp. 45-68.
18. Shah, S. P., Swartz, S. E. and Ouyang, C., Fracture Mechanics of Concrete. John Wiley & Sons, New York, 1995. 19. Jenq, Y. and Shah, S. P. Two parameter fracture model for concrete. Journal of Engineering Mechanics, 1985,
111(10), 1227-1241.
20. Nallathambi, P. and Karihaloo, B. L. Determination of specimen-size independent fracture toughness of plain con- crete. Magazine of Concrete Research, 1986, 38(135), 67-76.
21. Swartz, S. E. and Refai, T. M. E., Influence of size effects on opening mode fracture parameters for precracked con- crete beams in bending. In Fracture of Concrete and Rock. Springer-Verlag, New York, 1988, pp. 243-254.
22. Ba~ant, Z. P. and Kazemi, M. T. Determination of fracture energy, process zone length and brittleness number from size effect with application to rock and concrete. International Journal of Fracture, 1990, 44(2), 111-131.
23. Hillerborg, A., Modeer, M. and Peterson, P. E. Analysis of crack formation and crack growth in concrete by means of fracture mechanics and finite elements. Cement and Concrete Research, 1976, 6(6), 773-782.
24. Hsu, T. T. C. and Slate, F. O. Tensile bond strength between aggregate and cement paste mortar. ACI Journal, 1963, 60, 465-486.
25. Hibbitt, H. D., Karlsson, B. and Sorensen, E. P., ABAQUS User's Manual. Hibbitt, Karlsson, and Sorensen, Inc., Pawtucket, RI, 1994.
26. Parks, D. M. The virtual crack extension method for nonlinear material behavior. Computer Methods in Applied Mechanics, 1977, 12, 353-364.
27. Matos, P. P. L., McMeeking, R. M., Charalambides, P. G. and Drory, M. D. A method for calculating stress inten- sities in bimaterial interfaces. International Journal of Fracture, 1989, 40, 235-254.
28. Hutchinson, J. W., Mixed mode fracture mechanics of interfaces. In Metal-Ceramic Interfaces, Proc. Int. Workshop. Pergamon Press, Santa Barbara, CA, 1989, pp. 295-306.
29. Parks, D. M. A stiffness derivative finite element technique for determination of crack tip stress intensity factors. International Journal of Fracture, 1974, 10, 487-501.
30. Atkinson, C., Smelser, R. E. and Sanchez, J. Combined mode fracture via the cracked Brazilian disk test. International Journal of Fracture, 1982, 18(4), 279-291.
31. Charalambides, P. G., A mixed mode fracture specimen: analysis and experiments. In Metal-Ceramic Interfaces, Proc. Int. Workshop. Pergamon Press, Santa Barbara, CA, 1989, pp. 383-400.
(Received 15 October 1996, in final form 7 January 1997, accepted 3 July 1997)