www.jped.com.br
ORIGINAL
ARTICLE
Relationship
between
chronological
and
bone
ages
and
pubertal
stage
of
breasts
with
bone
biomarkers
and
bone
mineral
density
in
adolescents
夽
Cristina
Maria
Teixeira
Fortes
a,
Tamara
Beres
Lederer
Goldberg
b,∗,
Cilmery
Suemi
Kurokawa
a,
Carla
Cristiani
Silva
c,
Maria
Regina
Moretto
a,
Talita
Poli
Biason
d,
Altamir
Santos
Teixeira
e,
Hélio
Rubens
de
Carvalho
Nunes
faClinicalandExperimentalPediatricsResearchCenter,DepartmentofPediatrics,BotucatuMedicalSchool,Universidade
EstadualPaulista(UNESP),SãoPaulo,SP,Brazil
bDepartmentofPediatrics,AdolescentMedicineDiscipline,GraduatePrograminGynecology,Obstetrics,andMastology,
BotucatuMedicalSchool,UniversidadeEstadualPaulista(UNESP),SãoPaulo,SP,Brazil
cDepartmentofPhysicalEducation,UniversidadeEstadualdoNortedoParaná(UENP),Paraná,PR,Brazil
dDepartmentofPediatrics,AdolescentMedicineDiscipline,BotucatuMedicalSchool,UniversidadeEstadualPaulista(UNESP),
SãoPaulo,SP,Brazil
eTropicalDiseasesandImageDiagnosisDepartment,BotucatuMedicalSchool,UniversidadeEstadualPaulista(UNESP),SãoPaulo,
SP,Brazil
fBotucatuMedicalSchool,UniversidadeEstadualPaulista(UNESP),SãoPaulo,SP,Brazil
Received27December2013;accepted3April2014 Availableonline14July2014
KEYWORDS
Adolescents;
Bonemineraldensity; Bonemineralization; Boneremodeling; Bonereabsorption; Osteocalcin; Osteoporosis; Growth; Bonehealth
Abstract
Objective: Tostudybonemineraldensity(BMD)inadolescentfemalesaccordingtofivegroups ofchronologicalage(CA),boneage(BA),andbreastdevelopmentstage(B),andtocorrelate theseparameterswithplasmabonebiomarkers(BB).
Methods: This was a cross-sectional study performed in 101 healthy adolescent females between10and20yearsold.Thestudyvariableswere:weight,height,bodymassindex(BMI), CA,B,BA,calciumintake,BMD,andBB.Osteocalcin(OC),bonealkalinephosphatase(BAP), andC-terminaltelopeptide(S-CTx)wereevaluatedforBB.BMDwasmeasuredusingdualenergy X-rayabsorptiometry(DXA).
Results: BMDinlumbar spine, proximalfemur,and totalbody increasedwith age,andthe respectiveobservedaverageswere:inCA1(10yearsold),0.631,0.692,0.798g/cm2;inCA2 (11 to12 yearsold), 0.698,0.763, 0.840g/cm2; inCA3(13to 14 yearsold), 0.865,0.889,
夽
Pleasecitethisarticleas:FortesCM,GoldbergTB,KurokawaCS,SilvaCC,MorettoMR,BiasonTP,etal.Relationshipbetweenchronological andboneagesandpubertalstageofbreastswithbonebiomarkersandbonemineraldensityinadolescents.JPediatr(RioJ).2014;90:624---31.
∗Correspondingauthor.
E-mail:[email protected](T.B.L.Goldberg).
http://dx.doi.org/10.1016/j.jped.2014.04.008
0.972g/cm2;inCA4(15to16yearsold),0.902,0.922,1.013g/cm2;andinCA5(17to19years old),0.944,0.929,1.35g/cm2.Theseresultsshowedsignificantdifferencesbetween13and14 yearsofage(CA3)orwhengirlsreachedtheB3stage(0.709,0.832,0.867g/cm2).Thehighest medianconcentrationsofBBwerebetween10and12yearsofagewhenadolescentswerein theB2---B3(p<0.001).MedianBBconcentrationsdecreasedinadvancedBAandB.
Conclusions: BBconcentrations werepositivelycorrelatedwiththepeakheightvelocityand negativelycorrelatedwithBMDinthestudysites.IncreasedBMDandBBconcentrationswere observedinB3.
©2014SociedadeBrasileiradePediatria.PublishedbyElsevierEditoraLtda.Allrightsreserved.
PALAVRAS-CHAVE
Adolescentes; Densidademineral óssea;
Mineralizac¸ãoóssea; Remodelac¸ãoóssea; Reabsorc¸ãoóssea; Osteocalcina; Osteoporose; Crescimento; Saúdeóssea
Relac¸ãoentreasidadescronológicaeósseaeoestágiopuberaldasmamascomos biomarcadoresósseoseadensidademineralósseaemadolescentes
Resumo
Objetivo: Avaliar a densidade mineral óssea (DMO) em adolescentes do sexo feminino de acordocom aidade cronológica (IC),idade óssea(IO) e desenvolvimentodas mamas(M)e suascorrelac¸õescombiomarcadoresderemodelac¸ãoósseaemplasma(BO).
Métodos: Estefoiumestudotransversalprospectivofeitoem101adolescentessaudáveisdo sexofemininocomidadeentre10e20anos.Asvariáveisestudadasforam:peso,altura,índice demassacorpórea(IMC),IC,IO,M,ingestãodecálcio,DMOeBO.Aosteocalcina(OC), fos-fatase alcalinaóssea (BAP)eotelopeptídeo Cterminal(S-CTx) foramosbiomarcadoresde remodelac¸ãoósseaavaliados.ADMOfoiobtidaporabsorciometriaderaios-Xdeduplaenergia (DXA).
Resultados: ADMO decolunalombar,fêmurproximalecorpototalaumentoucomaidade, easrespectivasmédiasobservadasforam:IC1=0,631,0.692,0,798g/cm2;IC2,0,698,0,763, 0,840g/cm2; IC3, 0,865, 0,889,0,972g/cm2;IC4, 0,902,0,922, 1,013g/cm2;e IC5, 0,944, 0,929,1,35g/cm2.Observou-sediferenc¸asignificativaentre13e14anos(IC3)ouquandoas meninasestavamemM3(0,709,0,832,0,867g/cm2).OsvaloresdosBOapresentaramelevac¸ão entre10e12anosequandoasadolescentesestavamemM2---M3(p<0,001).Osvaloresdas medianasdosBOdiminuíramcomoavanc¸ardaIOeM.
Conclusões: OsBOsmostraramparalelismocomopicodevelocidadedecrescimentoe demon-straramcorrelac¸ãonegativacomaDMOnosítiosavaliados.OaumentodaDMOedosBOsfoi observadoemM3.
©2014SociedadeBrasileiradePediatria.PublicadoporElsevierEditoraLtda.Todososdireitos reservados.
Introduction
The skeletonwas traditionally known as a passive organ; itsmajorfunctionwasconsideredtobethesupportofthe humanbody.However,itiscurrentlyconsideredamutable organthatparticipatesininteractionsbetween regulatory and energetic mechanismsacting in conjunction with the adiposetissue.1,2
Puberty is considered animportant timeof substantial
bonegrowth,andtherefore,sensitivetoexternalinfluences
that have strong effects, such as diet, physical exercise,
lifestyle,andmedications.3
Bonemetabolismischaracterizedbycyclesofformation
andreabsorption,andthebalancebetweenthesetwo
pro-cesseschangesthroughlife.Duringinfancyandadolescence,
boneformationpredominatesoverabsorption;inadultlife,
bothprocessesstabilize.4 Boneremodelingisalsostrongly
relatedtovariationsinbodyweight,5,6includingchangesin
muscle mass andbody fat content. Thus,the mechanical
loadimposedonthe skeletal system interferes withbone
formation.
AccordingtoHaeneyetal.,7peakbonemassrepresents
thehighestbonemassvalueormaximumquantityofbone
that an individual attains when their skeleton is totally
mineralizedor consolidated. Currently, it is not precisely
established at what age biological or chronological peak
bonemass occurs; thereis evidence thatit occursat the
endofadolescence.8
Bonemass depositionbegins during fetallife and
con-tinues during infancy and adolescence, stabilizing at the
beginningofadulthood.Understandingandevaluatingbone
mass acquisition in a population of adolescents could
be a determining factor in the prevention of
osteope-nia/osteoporosis, which are diseases considered public
healthissuesofhigheconomicimpact.9
Bonemineraldensity(BMD)isconsideredanimportant,
precise, and statically valid measurement; however, BMD
bonetissuehasundergone,representingonlyonemoment
inanevolvingcondition.Toovercomethislimitationandto
improvethesensitivityandspecificityofbonemassstatus
evaluation,theuseofbonebiomarkers(BBs)hasbeen
sug-gestedtoimprovetheunderstandingoftheboneremodeling
process.10---12
Importantserumbiomarkersofboneformationinclude:
a) osteocalcin (OC), a non-collagenous protein
abun-dantinbone,predominantlysynthesizedbydifferentiated
osteoblasts,andconsidered tobeasensitivebiomarkerof
bone synthesisactivity; and b) bone alkaline phosphatase
(BAP),anectoenzymeorspecificglycoproteinfoundonthe
surfaceof osteoblasts,withanimportantfunctioninbone
mineralization,andconsideredasahighlysensitiveand
spe-cificbone formation indicator.13 In addition, studies have
suggestedthattheC-terminaltelopeptide(S-CTx)fragment,
abone reabsorptionmarker,is agoodmarkertoevaluate
boneformationprocessesbecauseitisformedwhen
colla-gentypeIdegradationoccurs.
Bone remodeling biomarkers are important tools for
understanding the dynamics of bone metabolism and add
informationacquiredfrombonedensitometry.
Therefore,thiswasthefirststudythatevaluatedbone
mineral density (BMD) in Brazilian adolescent females
according to chronological age (CA), bone age (BA), and
breast developmentstage (B), correlating this parameter
withbonebiomarkers(BBs).
Methods
Healthywhiteadolescentfemales(non-Africanornon-Asian descendants)between10and20incompleteyearsoldwere invitedtoparticipateinthisstudy.Thevolunteerswere stu-dentsatthe LaSalleSchoolinBotucatu,SãoPaulo State, Brazil andSanta Marcelina Schoolin Botucatu.A total of 101out of 497 adolescentfemale students inthe studied agegroup,wereincluded inthestudy andparticipatedin allevaluations.
ThestudywasapprovedbytheBotucatuSchoolMedicine EthicsCommittee--- UNESP.Written informedconsentwas co-signed by each participant (101) and their parents or guardians.
Theinclusioncriteriacomprisedweighbetweenthe10th and90thpercentilesandheightbetweenthe10thand97.5th percentilesforeachagegroup,14adequatebodymassindex
(BMI)forage,15andreportofregularanddailyconsumption
ofdairyproducts.
Theexclusioncriteriawere:historyofprematurityorlow
birthweight;presenceofdiabetesmellitus;acuteorchronic
under-nourishment;congenitalor acquired bone diseases;
gastrointestinal diseases accompanied by malabsorption;
historyof nephropathywithor without chronic renal
fail-ure;endocrinopathies;early orlatepuberty;chronicdrug
consumption;cystic fibrosis; celiacdisease;drug usethat
negativelyaffected bone metabolism (suchas
anticonvul-sants and antacids with aluminum); more than 2h/week
physicalexercises,sinceexcessivephysicalexercise
inter-feres with bone mineralization; use of contraceptives 24
monthspriortodatacollection;pregnancyatanytime;and
absenceondatesassignedforthestudydatacollection.The
dietaryexclusioncriteriawere:practicesofanexclusively
vegetariandietandhigh fiberdiet;caffeineconsumption;
softdrinkconsumptionover300mL/day;andlack ofdairy
productconsumption.Theserigorousselectioncriteriawere
appliedinordertominimizeinterferencefromfactorsthat
couldaffectnormalbonemetabolismduringpuberty.
Based on the inclusion criteria, eligible adolescents
were invited to have their weight and height measured.
Thoseparticipantsfittingtheparametercriteriawere
subse-quentlyquestionedaboutsmokingandalcoholconsumption.
Selectedadolescentswereinvitedtoparticipateinthestudy
asvolunteers;afullexplanationofmethodsandprocedures
wasprovidedtoparticipantsandtheirparentsorguardians,
includinginformationabouttheoptiontowithdrawfromthe
studyatanytime.
Parentsandguardianswereinterviewedandparticipants
underwent general and specific physical examinationsfor
detection of any physical abnormality (adolescents with
chronic congenitalinfectionand majorcongenital
anoma-lies)thatcouldinterferewiththestudy expectedresults.
Secondarysexualcharacteristicswereevaluatedandresults
comparedtotheTannercriteriaforbreastdevelopment(B).
The averageage atmenarche inthegroupof participants
wassimilartothatinthe Brazilianpopulation (12.2years
old).16Skeletalmaturationwasevaluatedbythe
determina-tionofboneage(BA)accordingtotheGPmethoddescribed
by Greulich and Pyle.17 The parameters of chronological
age(CA),boneage,andpubertalstageofbreasts(B)were
dividedintofivegroups.GroupCA1wascomposedoffemales
aged10years;CA2,ages11and12years;CA3,ages13and
14 years;CA4, ages15and16 years;andCA5,ages17to
20incompleteyears.TheBAgroupsweredividedintoBA1:
bone age (BA) 10and 11years;BA2:BA 12and 13years;
BA3:BA14and15years;BA4:BA16and17years;andBA
5:BA18and19years.Dietarycharacterizationwas
subse-quentlymeasuredusinganon-consecutivethree-daydietary
record.18 Questionnaires for centesimal quantification of
food wereapplied andanalyzed usinga computersystem
developedbytheDepartmentofNutritionattheSchoolof
PublicHealthfromtheUniversidadedeSãoPaulo.19
Participants whocompleted allinitial steps underwent
bone mass evaluationusing abone densitometry unitand
by attenuationofdualenergyX-ray (DXA)usingaHologic
QDR2000-Plus(HologicInc.,Waltham,MA,USA)according
torecommendationsoftheInternational Societyfor
Clini-calDensitometry.20 BMD resultswere expressedin g/cm2.
Measurements fromthe L1---L4lumbar spinal region,total
proximalfemur(includingthefemurneck,trochanteric,and
intertrochantericregions),Wardarea,andwholebody
den-sitometry were taken. The amount of radiation to which
participants were exposed was considered safe and not
harmfultotheircurrentandfuturelife.20
Bloodcollection
Bloodsampleswerecollectedbyvenouspunctureand cen-trifuged by 15minutes at 1,500g for serum separation; serumsampleswerestoredat-70◦Cuntilanalysesof BAP
Table1 Meanandstandarddeviation(SD)ofnutritionalindicatorsandcalciumintakeaccordingtochronologicalage(CA), breastdevelopmentstage(B)andboneagegroups(BA).
Variables
Groups
Mean±SD(ntotal=101)
1 2 3 4 5
CA(years) (n=10) (n=19) (n=26) (n=27) (n=19)
Weight(kg) 35.38±7.2 42.90±7.36 49.39±7.02 52.33±5.39 53.46±7.62
Height(m) 1.39±0.07 1.50±0.08 1.59±0.05 1.60±0.05 1.61±0.04
BMI(kg/m2) 17.64
±2.27 18.92±2.59 19.26±2.10 20.39±1.77 20.44±2.32
Calcium(mg/day) 652±176 624±271 533±150 490±153 532±267
B (n=5) (n=7) (n11) (n=37) (n=41)
Weight(kg) 31.92±4.7 39.18±5.56 45.75±7.98 50.31±7.46 51.69±6.04
Height(m) 1.38±0.05 1.43±0.08 1.54±0.09 1.60±0.06 1.59±0.05
BMI(kg/m2) 16.24±1.62 19.02±2.84 18.81±2.18 19.59±2.18 20.31±1.91
BA (n=9) (n=14) (n=21) (n=31) (n=26)
Weight(kg) 33.02±4.4 45.20±5.73 48.92±6.68 53.46±5.46 49.31±12.6
Height(m) 1.38±0.05 1.52±0.06 1.59±0.05 1.60±0.05 1.52±0.37
BMI(kg/m2) 16.99
±1.57 19.26±2.58 19.24±2.17 20.78±1.73 18.88±4.62
Note:ANOVAfollowedbyStudent-NewmanKeuls. BMI,bodymassindex.
Chronologicalagegroups(yearsofage):CA1-10;CA2-11-12;CA3-13-14;CA4-15;CA5-17-19. Weight:CA1<CA4andCA5;CA2<CA4andCA5;p<0.001
Height:CA1<CA2,CA3,CA4andCA5;CA2<CA3,CA4andCA5;p<0.001 BMI:CA1<CA4andCA5;p<0.001
Calcium:p=0.407
Breastdevelopmentstagegroups(Tannercriteria)
Weight:B1<B3,B4andB5;p<0.001
Height:B1<B4andB5;B2<B4andB5;p<0.001 BMI:B1<B5;B1<B4;p<0.001
Boneagegroups(Greulich&Pyle):BA1-10-11years,BA2-12-13years,BA3-14-15years,BA4-16-17years,BA5-18-19years Weight:BA1<BA2,BA3,BA4andBA5;BA2<BA4andBA5;p<0.001
Height:BA1<BA3,BA4andBA5;BA2<BA3,BA4andBA5;p<0.001 BMI:BA1<BA4andBA5;p<0.001
S-CTxwasquantifiedbyanelectrochemiluminescenceassay using a commercial ß-Cross Laps/serum kit (Roche Diag-nosticCorporation,Indianapolis,IN,USA)andElecsys1010 (RocheDiagnosticCorporation, Indianapolis,IN, USA); the inter-assaycoefficientofvariationwas5%.
Statisticalanalysis
Descriptive statistics data were expressed as
mean±standard deviation using analysis of variance and the Student-Newman-Keuls method. Kruskal Wallis analysisofvarianceandtheDunntestwereperformedfor comparisonsbetween bone biomarkersandCA, BA, andB whentheShapiro-Wilktestshowednon-normaldistribution for thesedata. Spearmancoefficients of correlation were calculatedbetweenbonebiomarkersandBMDresultsinthe evaluatedlocationsandCA,BA,andB.Minimumstatistical differencewasconsideredat5%.Graphicalrepresentation
included mean DXA values and median bone biomarker
concentrationsinrelationtoCA,BA,andB.
Results
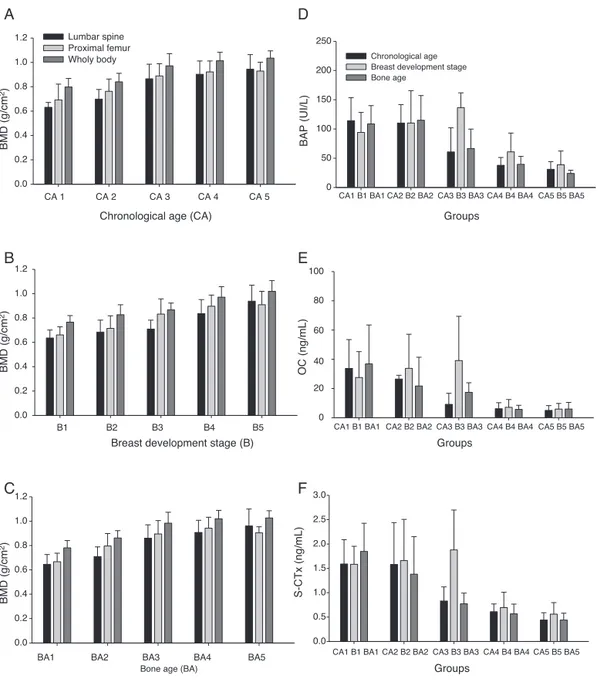
Weight,height,BMI,andBMD,measuredinthethree ana-lyzedsites,increasedwithage,pubertalstageofbreasts,
andboneage(Table1,andFig.1A-C).Theconcentrations
ofallboneformationandreabsorptionbiomarkers(BAP,OC,
and S-CTx) reduced with age; the highest concentrations
wereobserved inCA1andthelowestin CA5,whichisthe
latephaseofpuberty(Fig.1D-F).
Significantdifferencesinweightwereobservedbetween
agegroups(CA4andCA5differedfromgroupsCA1andCA2,
withp<0.01).
Calcium ingestion ranged from 489±153mg/day to
652±176mg/day;themean±SDforthewholesamplewas
566±210mg/day(Table1).
TheBMD(lumbarspine,proximalfemur,andtotalbody)
analysesshoweddifferencesingroups CA3,CA4,andCA5,
whichdifferedfromgroupsCA1andCA2withp<0.01inall
studysites;valuesingroupCA3wereintermediate(Fig.1
A-C).
BMD values (lumbar spine, proximal femur, and total
body)differedsignificantlybetweenB(p<0.01).GroupsB4
andB5showedthehighestmeanBMDvaluesinallsites,and
groupB3showedintermediatemeanvalue(Fig.1B).
BAP, OC, and S-CTx bone remodeling biomarkers had
significantly different concentrations at the beginning of
puberty.The median concentrationsin CA1and CA2were
significantly higher than those in CA3, CA4, and CA5
(p<0.001).MedianBAPconcentrationsinCA3werehigher
Breast development stage (B)
BMD (g/cm
2)
BMD (g/cm
2)
BMD (g/cm
2)
0.0 0.2 0.4 0.6 0.8 1.0 1.2
Chronological age (CA)
0.0 0.2 0.4 0.6 0.8 1.0
1.2 Lumbar spine Proximal femur Wholy body
CA 5 CA 1 CA 2 CA 3 CA 4
B5
B1 B2 B3 B4
Bone age (BA)
0.0 0.2 0.4 0.6 0.8 1.0 1.2
BA5
BA1 BA2 BA3 BA4
C
OC (ng/mL)
0 20 80
60
40 100
BAP (UI/L)
0 50 100 150 200 250
Chronological age Breast development stage Bone age
CA1 B1 BA1
S-CTx (ng/mL)
0.0 0.5 1.0 1.5 2.0 2.5 3.0
F
B
A
E
D
CA2 B2 BA2 CA3 B3 BA3 CA4 B4 BA4 CA5 B5 BA5
CA1 B1 BA1 CA2 B2 BA2 CA3 B3 BA3 CA4 B4 BA4 CA5 B5 BA5
CA1 B1 BA1 CA2 B2 BA2 CA3 B3 BA3 CA4 B4 BA4 CA5 B5 BA5
Groups
Groups
Groups
Figure1 Graphicrepresentationofbonemassdensity(BMD)meansandstandarddeviationsoflumbarspine,proximalfemur,and wholebodyvaluesing/cm2accordingtoageranges(A);breastdevelopmentstage(B);andboneage(C).Bonealkalinephosphatase (BAP)(D);osteocalcin(OC)(E);andC-terminaltelopeptide(S-CTx)(F);mediansaccordingtoage-ranges,breastdevelopmentstage, andbone-agegroups.
betweenCA4andCA5medianconcentrationswasobserved. ChangesinOCconcentrations accordingtoagefolloweda similartrend tothose observed for BAP. The same trend wasobserved for S-CTx (p<0.001;Fig. 1).The highest
S-CTxmedianswereobservedinCA1andCA2,whichdiffered
fromCA5(Fig.1D-F).
Significant differences in weight and height were
observedinparticipantsinBA2andBA1.Thesedifferences
werealsoobservedintheBA3,BA4,andBA5groups,which
presentedmeansofweightandheighthigherthanthosein
BA1(Table1).
DifferencesinBMDvalueswereinitiallyobservedinthe
BA3group,whichdifferedfromtheBA1andBA2groupswith
p<0.01inallBMDvaluesandinallstudiedsites.TheBMD
meansincreasedfromthelowBAgroups towardsthehigh
BAgroups(Fig.1C).
Significant differences in bone remodeling biomarkers
wererecordedinallstudiedvariables(BAP,OC,andS-CTx)
whenpresentedaccordingtoBA;BA1andBA2medianswere
higherthanBA4andBA5medians(Fig.1D-F).
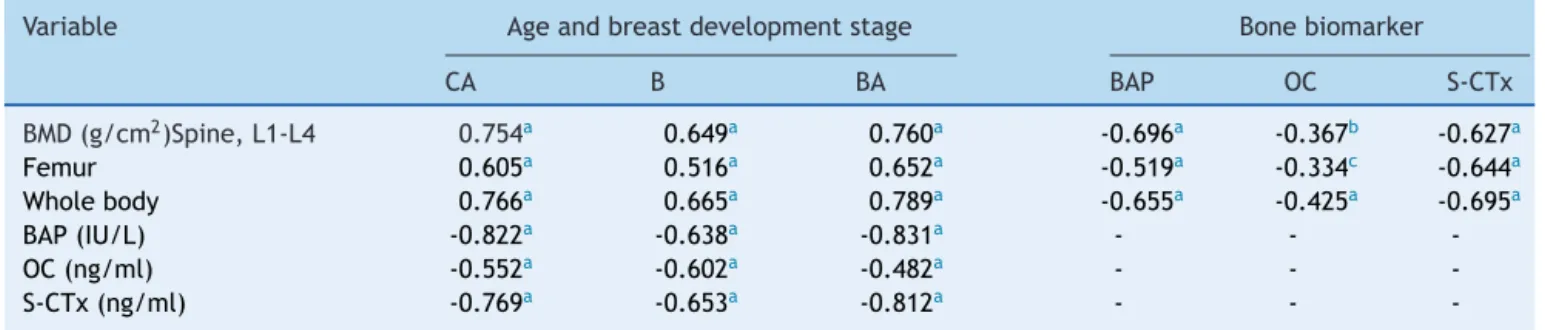
A significant positive correlation between BMD values,
for both CA and BA, wasobserved withmaturation level
(Table2);boneremodelingbiomarkers(BAP,OC,andS-CTx)
presentedasignificantnegativecorrelationwithCA,BA,and
breast development (Table 2). This finding demonstrated
that the more mature the participants were, the higher
theirBMDvalueswere.Correlationwassignificantbut
Table2 CoeficientofSpearman’scorrelationbetweenbonemineral density(BMD)measurements(g/cm2),bonebiomarker concentrations(bonealkalinephosphatase,osteocalcin,C-terminalteleopeptide),chronologicalage(CA),Breastdevelopment stage(B)andboneage(BA).
Variable Ageandbreastdevelopmentstage Bonebiomarker
CA B BA BAP OC S-CTx
BMD(g/cm2)Spine,L1-L4 0.754a 0.649a 0.760a -0.696a -0.367b -0.627a
Femur 0.605a 0.516a 0.652a -0.519a -0.334c -0.644a
Wholebody 0.766a 0.665a 0.789a -0.655a -0.425a -0.695a
BAP(IU/L) -0.822a -0.638a -0.831a - -
-OC(ng/ml) -0.552a -0.602a -0.482a - -
-S-CTx(ng/ml) -0.769a -0.653a -0.812a - -
-BAP,bonealkalinephosphatase;OC,osteocalcin;S-CTx,C-terminalteleopeptide;L1-L4,lumbarspine1and4. SignificanceofSpearman’scorrelation.
a p=0.001. b p=0.002. c p=0.005.
biomarkerconcentrations;themorematuretheparticipants were,thelowertheirbonebiomarkerconcentrationswere (Table2).
Table2 showsthedatafromthecoefficient of
correla-tionanalysisbetweenboneremodelingbiomarkersandBMD
values. These results demonstrate a negative and
signifi-cant correlation betweenBMD valuesandbone biomarker
concentrations.
Discussion
Thepresentstudyobservedsignificantnegativecorrelations between concentrations of bone remodeling biomarkers and CA, BA, breast development, and BMD values. Such evidencerevealsinverselyproportionaloutcomesin remod-elingbiomarkersandvariablesthatrepresenttimeandbone massmaturation.Thus,althoughtheBMDvaluesincreased withtheadvancementofmaturationevents,the concentra-tionsofthethreebiomarkersreducedwithageattheend ofadolescence,startingfrom15to16yearsofage(Fig.1).
Other authors have also observed the lowest bone
biomarkerconcentrations attheend ofpuberty,andhave
reportedbiomarker concentrations in 18-year-oldfemales
thataresimilartothoseinadults.13,21,22
Boot etal.8observed thatpeakbonemass,both inthe
lumbarregionandinthewholebody,occurredbetween18
and20yearsofageinagroupof360females.Silvaetal.23,24
and Moretto etal.25 showed that mean BMD values in all
evaluatedsitesincreasedwithage,skeletalmaturation,and
boneageinBrazilianadolescents.Inthesestudies,the
low-est BMDvalues wereobserved in 10-year-oldfemales and
thehighestonesinfemalesaged17yearsorover.Themost
criticalperiodsfor bonemassgrowthwerereportedtobe
between13and14yearsofage,infemalesatbreaststage
B3, and between 13 and 15 years in males at G4 stage.
These resultscorroborate the present findings,suggesting
theexistenceofawindowofopportunityforbonemassgain,
between13and14yearsofageandB3,in thecited
mat-urationperiods;thelinearregressionanalysesshowedBMD
gainsof0.0574,0.0592,and0.0654g/cm2inlumbarspine,
proximalfemur,andtotalbody,respectively,ineachyearof
growthinCA.
The literature is clear andin agreement that reaching
thehighest possiblepeakbonemassduringadolescenceis
animportantandpossiblythemainpreventivefactoragainst
occurrenceofsenileosteoporosis.26
Thefactthatbiomarkersproducesensitiveandaccurate
readingsofchangesin bonemetabolismshouldcontribute
totheirwideruseinclinicalpractice.Bloodbiomarker
mea-surementscanberepeatedmorefrequentlythanthemore
commonlyusedquantitativeradiologicalmethods,because
blood samples are comparatively easy to obtain. Despite
difficultiesintheanalysisandinterpretationof biomarker
resultsduetotheirbiologicalvariabilityinthecourseofan
individual’slife time,3 thereareadvantages in theuse of
thesemarkers.
It is therefore possible to anticipate that, when
indi-vidualspresent healthy development evolution in infancy
and puberty, free of conditions that interfere with bone
metabolism,boneformation markerswould befound
pro-portionally more active in the first two decades of life
thanreabsorption markers.Some other factorscan affect
boneremodelingbiomarkerconcentrations,suchasgenetic
factors, age, secondary sexual signs that represent
visi-bleevolution topuberty, lifestyle,nutrition,and physical
exercise.27
Tuchmanet al.22 observeda correlation between bone
biomarkersandpeakheightvelocity(PHV),demonstrating
aparallelismbetweenincreasedmarkerconcentrationsand
heightvelocity.Despitethis,Hareletal.11emphasizedthat
theBMD valuesstillcontinuedtoincreasewithincreasing
age,withamaximumincrease aroundmenarche, whichis
when girls are already decelerating height velocity. This
evolutionwas alsoobserved in thepresent data.
Sequen-tially,peakbonemasswillfinallybereachedatthemoment
when growth rate in height reduces. The final height, in
theseadolescents,wasattainedwhentheyreachedthe
B4-B5breastdevelopmentalstages.Aspreviouslystated,peak
height velocity(PHV) occurs at the same time asthe B3
breastdevelopmentalstageoralittleafterit.Thisbehavior
high-estconcentrationsinthisdevelopmentalstage,reinforcing
therelationship between theseevents andhormonal
fac-tors involved in these processes. From this perspective,
van Coeverden et al.13 and Yilmaz et al.6 evaluated the
magnitudeof therelationship betweenbone turnoverand
peakheightvelocity(PHV)analyzedbythelevelsofsome
bonemarkersandevaluatingsexsteroidlevels,insulin-like
growthfactor(IGF-1),andinsulin-likegrowthfactorbinding
protein3(IGF-BP-3).
Hence, these considerations allow for the
understand-ingofhigh levelsof correlation betweenbonebiomarkers
and bone mineral densities observed in our statistical
analysis.
Yilmaz et al.6 evaluated 91 Turkish pubescent females
and83males,11 to15 yearsold.Theirinclusioncriteria,
althoughveryprecise,werenotasrigidandrestrictiveasthe
presentstudy’s.Theauthors evaluatedBMD inthelumbar
spineandwholebody,aswellasestradiolandtestosterone
levels,andmeasuredboneformationmarkers(OCandBAP)
inbothgenders.TheirresultsofmaximumincreaseinBMD
occurringinpubertystage3corroboratethepresentresults.
TheseauthorsobservedthatmeanOCconcentrationswere
higherin females in Tanner stage 3 thanat B4 or B5and
steadilydecreasedtowardstheendofpuberty.This
behav-iorwasnotasexpressiveinBAP;however, itshowedthat
concentrations from mid-puberty were higher than those
at the end of puberty withsignificant differences in girls
(p<0.001).Furthermore,Yilmazetal.6demonstrated
signif-icantnegativecorrelationbetweenBMDandtheevaluated
bone markers,which corroboratesthe resultsobserved in
thepresentstudy.
Longitudinalstudiesperformedtoevaluateheight
veloc-itycurve andmaximum concentrations of bone formation
markers could contribute to confirm the parallelism
indi-rectlyobservedbetweenthesevariables.
Through analyses of biomarkers, the present study
demonstratesthechangesinbone remodelingoccurringin
thesecond decade oflife, revealing high marker
concen-trations in the early adolescence years and significantly
reduced concentrations in late adolescence. These
anal-yses correlate to the BMD values, which represent bone
massincorporation,andindicatean inverselyproportional
behavior showing the highest BMD values associated with
thelowestconcentrationsofformationandreabsorptionof
biomarkers.
Ideally,thepresentstudyshouldhavehadalongitudinal
designincludingahighernumberofparticipantsfromamore
comprehensivesamplinginsimilarcohorts(schools).Despite
thislimitation,thestrictinclusioncriteriafavoredan
accu-rateinterpretationofresultsforbonegainandmetabolism
duringadolescence.
Theresultsfromthepresentstudycomplementpublished
workonthesubjectandimprovetheunderstandingofbone
masschangesduringadolescence.
Funding
ThepresentestudywassupportedbyFAPESP(Fundac¸ãode Amparoà PesquisadoEstadodeSão Paulo)--- Process No: 2007/07731-0and2011/05991.
Conflicts
of
interest
Theauthorsdeclarenoconflictsofinterest.
Acknowledgments
ThisstudyreceivedgrantsfromFAPESP(2007/07731-0and 2011/05991)andPrope-UNESP(Pro-ReitoriadePesquisada UNESP).Theauthorsgreatlythankthepediatricians, tech-nicians of general sample collection room of the Clinical Laboratory-BotucatuGeneral Hospitalof BotucatuMedical School-UNESP,andtechniciansofthePediatricsLaboratory ResearchofthePediatricsDepartment.
References
1.Fernández-RealJM,RicartW.Osteocalcin:anewlinkbetween boneand energy metabolism.Someevolutionary clues.Curr OpinClinNutrMetabCare.2011;14:360---6.
2.Kim YS, Paik IY, Rhie YJ, Suh SH. Integrative physiology: definednovelmetabolicrolesofosteocalcin.JKoreanMedSci. 2010;25:985---91.
3.BanfiG,LombardiG,ColombiniA,LippiG.Bone metabolism-markersinsportsmedicine.SportsMed.2010;40:697---714. 4.KhanK,MckayH,KannusP,BaileyD,WarkJ,BennellK.Physical
activityandbonehealth.BrJSportsMed.2002;36:76---7C. 5.daSilvaCC,KurokawaCS,NgaHS,MorettoMR,DalmasJC,
Gold-bergTB.Bonemetabolismbiomarkers,bodyweight,andbone ageinhealthyBrazilianmaleadolescents.JPediatrEndocrMet. 2012;25:479---84.
6.YilmazD,ErsoyB,BilginE,GümüserG,OnurE,PinarED.Bone mineraldensityingirlsandboysatdifferentpubertalstages: relationwithgonadalsteroids, bone formationmarkers,and growthparameters.JBoneMinerMetab.2005;23:476---82. 7.Heaney RP, Abrams S, Dawson-Hughes B, Looker A,
Mar-cus R, Matkovic V, et al. Peak bone mass. Osteoporos Int. 2000;11:985---1009.
8.BootAM,deRidderMA,vanderSluisIM,vanSlobbeI,Krenning EP,Keizer-SchramaSM.Peakbonemineraldensity,leanbody massandfractures.Bone.2010;46:336---41.
9.DennisonE,MohamedMA,CooperC. Epidemiologyofosteoporo-sis.RheumDisClinNorthAm.2006;32:617---29.
10.Saraiva GL, Lazaretti-Castro M. Marcadores bioquímicos da remodelac¸ão óssea na prática clínica. Arq Bras Endocrinol Metab.2002;46:72---8.
11.HarelZ,GoldM,Cromer B,BrunerA,StagerM,BachrachL, etal.Bonemineraldensityinpostmenarchaladolescentgirls intheUnitedStates:associatedbiopsychosocialvariablesand boneturnovermarkers.JAdolescHealth.2007;40:44---53. 12.SilvaCC,GoldbergTB,NgaHS,KurokawaCS,CapelaRC,Teixeira
AS,etal.Impactofskeletalmaturation onbonemetabolism biomarkersandbonemineraldensityinhealthyBrazilianmale adolescents.JPediatr(RioJ).2011;87:450---6.
13.van Coeverden SC, Netelenbos JC, de Ridder CM, Roos JC, Popp-SnijdersC,Delemarre-vandeWaalHA.Bonemetabolism markersandbonemassinhealthpubertalboysandgirls.Clin Endocrinol.2002;57:107---16.
14.Hamill PV, DrizdTA, Johnson CL,Reed RB, RocheAF,Moore WM.Physicalgrowth:NationalCenterforHealthStatistics per-centiles.AmJClinNutr.1979;32:607---29.
15.CentersforDiseaseControlandPrevention,(CDC).Prevalence of overweight among adolescents - United States, 1988-91. MMWR,MorbMortWkly,Rep.1994;43:818---21.
SaúdedoAdolescente.Adolescênciaesaúde.SãoPaulo:Paris Editorial;1988.p.43---57.
17.GreulichWW,PyleSL.Radiographicatlasofskeleton develop-mentofthehandandwrist.PaloAlto:StanfordUniversityPress; 1959.
18.CintraIP,vonDerHeydeME,SchimitzBA,FranceschiniSC, Tad-deiJA,SigulemDM.Métodosdeinquéritosdietéticos.CadNutr. 1997;13:11---23.
19.PhiliphiST,SzarfarcSC,Lattrza AR.VirtualNutri. Versão1.0 paraWindows.SãoPaulo:UniversidadedeSãoPaulo,Faculdade deSaúdePública,DepartamentodeNutric¸ão.
20.GordonCM,BachrachLK, CarpenterTO,Crabtree N,El-Hajj FuleihanG, Kutilek S,et al.Dualenergy X-ray absorptiome-tryinterpretationand reportinginchildrenandadolescents: the 2007 ISCD Pediatric Official Positions. J Clin Densitom. 2008;11:43---58.
21.WalshJS,HenryYM,FatayerjiD,EastellR.Lumbarspinepeak bonemassandboneturnoverinmenandwomen:alongitudinal study.OsteoporosInt.2009;20:355---62.
22.Tuchman S, Thayu M, Shults J, Zemel BS, Burnham JM, LeonardMB.Interpretationofbiomarkersofbonemetabolism
inchildren:impactofgrowthvelocityandbodysizeinhealthy childrenandchronicdisease.JPediatr.2008;153:484---90. 23.Silva CC,GoldbergTB, Teixeira AS,Dalmas JC. A predictive
analysis from bone mineral density among eutrophic Brazil-ian male adolescents. Arq Bras Endocrinol Metab. 2006;50: 105---13.
24.SilvaCC,GoldbergTB,TeixeiraAS,DalmasJC.Bone mineraliza-tioninBrazilianadolescents:theyearsofmaximumbonemass incorporation.ArchLatinoamNutr.2007;57:118---24.
25.MorettodeOliveriaMR,CristianedaSilvaC,KurokawaCS, Teix-eira Fortes CM, Campos Capela R, Santos Teixeira A, et al. Bonemineraldensityinhealthyfemaleadolescentsaccording toage, boneageand pubertalbreaststage.OpenOrthopJ. 2011;5:324---30.
26.Janz K. Physical activity and bone development during childhood and adolescence. Implications for prevention of osteoporosis.MinervaPediatr.2002;54:93---104.