w w w . r e u m a t o l o g i a . c o m . b r
REVISTA
BRASILEIRA
DE
REUMATOLOGIA
Original
article
Effect
of
multiparity
on
bone
mineral
density,
evaluated
with
bone
turnover
markers
Hasan
Terzi
a,∗,
Rabia
Terzi
b,
Ebru
Kale
c,
Ahmet
Kale
aaKocaeliDerinceEducationandResearchHospital,DepartmentofObstetricsandGynecology,Kocaeli,Turkey
bKocaeliDerinceEducationandResearchHospital,DepartmentofPhysicalMedicineandRehabilitation,Kocaeli,Turkey cKocaeliDerinceEducationandResearchHospital,DepartmentofBiochemistry,Kocaeli,Turkey
a
r
t
i
c
l
e
i
n
f
o
Articlehistory:
Received22January2015 Accepted15July2015
Availableonline9October2015
Keywords:
Markersofboneturn-over Multiparity
Osteoporosis
a
b
s
t
r
a
c
t
Objective:Ouraimwastoinvestigatetheeffectofparityonosteoporosisbyevaluatingbone mineraldensity,markersofboneturn-overandotherfactorsthatareeffectivein osteoporo-sisinmultiparous(fivedeliveriesormore)andnulliparouswomeninthepost-menopausal period.
Methods:A total of 91 multiparous (five deliveries or more) and 31 nulliparous post-menopausal women were included in this study. All patients were interviewed on sociodemographiccharacteristics,gynecologichistory,personalhabits,levelsofphysical activity,andlife-longintakeofcalcium.Bonemineraldensitywasmeasuredatlumbar (L1–4)andfemoralneckregionswithDexa.
Results:Themeanageofmultiparouswomenwas58.79±7.85years,andthemeanageof nulliparouswomenwas55.84±7.51.ThefemoralBMDwas0.94±0.16andlumbarBMD 1.01±0.16inmultiparouswomen,femoralBMDwas0.99±0.16andlumbarBMD1.07±0.14 innulliparouswomen.Therewerenostatisticaldifferencesbetweenthefemoraland lum-barTscoresandBMDvaluesofthetwogroups.LumbarTscoresandlumbarBMDshoweda decreasewithincreasingtotaldurationofbreast-feedinginmultiparouswomen.The inde-pendentriskfactorsforosteoporosisintheregressionanalysisofmultiparouswomenwere foundtobethedurationofmenopauseandbodyweightof65kgandless.
Conclusion: Thereisnodifferencebetweenthebonemineraldensitiesofmultiparousand nulliparouswomen.Femaleswithlowerbody-weightandlongerdurationofmenopause shouldbefollowed-upmorecarefullyfordevelopmentofosteoporosis.
©2015ElsevierEditoraLtda.ThisisanopenaccessarticleundertheCCBY-NC-ND license(http://creativecommons.org/licenses/by-nc-nd/4.0/).
∗ Correspondingauthor.
E-mail:[email protected](H.Terzi).
http://dx.doi.org/10.1016/j.rbre.2015.09.002
2255-5021/©2015ElsevierEditoraLtda.ThisisanopenaccessarticleundertheCCBY-NC-NDlicense(http://creativecommons.org/
Efeito
da
multiparidade
sobre
a
densidade
mineral
óssea,
avaliada
por
marcadores
de
remodelac¸ão
óssea
Palavras-chave:
Marcadoresderemodelac¸ão óssea
Multiparidade Osteoporose
r
e
s
u
m
o
Objetivo: Investigar oefeito daparidadesobreaosteoporosepor meiodaavaliac¸ão da densidademineralóssea,marcadoresderemodelac¸ãoósseaeoutrosfatoreseficazesna avaliac¸ão daosteoporose em multíparas(cincopartosoumais)e nulíparasnoperíodo pós-menopausa.
Métodos: Foramincluídasnesteestudo91multíparas(cincopartosoumais)e31nulíparas, todasnapós-menopausa.Aspacientesforamentrevistadasparaadeterminac¸ãodas car-acterísticassociodemográficas,históriaginecológica,hábitospessoais,níveisdeatividade físicaeingestãodecálcioaolongodavida.Adensidademineralósseafoimedidanaregião lombar(L1-4)edocolofemoralcomaDexa.
Resultados: A média de idade das multíparas e nulíparas foi de 58,79±7,85 anos e 55,84±7,51,respectivamente.Nasmultíparas,aDMOfemoralelombarfoide0,94±0,16 e1,01±0,16,respectivamente;nasnulíparas,aDMOfemoralelombarfoide0,99±0,16e 1,07±0,14,respectivamente.Nãohouvediferenc¸aestatisticamentesignificativaentreos T-escoresfemoralelombareosvaloresdeDMOdosdoisgrupos.OT-escoreeaDMOlombar mostraramumadiminuic¸ãoemcasodeaumentonadurac¸ãototaldalactac¸ãomaterna emmultíparas.Encontrou-sequeosfatoresderiscoindependentesparaaosteoporosena análisederegressãodasmultíparassãoadurac¸ãodamenopausaeopesocorporalmenor ouiguala65kg.
Conclusão: Nãohádiferenc¸aentreadensidademineralósseademultíparasenulíparas.As mulherescommenorpesocorporalemaiordurac¸ãodamenopausadevemser acompan-hadascommaisatenc¸ãoparadeterminarsehádesenvolvimentodeosteoporose.
©2015ElsevierEditoraLtda.Este ´eumartigoOpenAccesssobumalicenc¸aCC BY-NC-ND(http://creativecommons.org/licenses/by-nc-nd/4.0/).
Introduction
Osteoporosisisametabolicbonedisordercharacterizedbya decreaseinbonestrengthandanincreaseinbonefragility.1
Genetic,hormonalandenvironmentalfactors contributeto osteoporosisdevelopment.2–4Pregnancyandlactationperiods
areprocesseswhichhaveaneffectonthecalciumandbone metabolismofthemother.ABMDlossof2–9%wasreported inthepostpartumperiod.5Longitudinalstudieshaveshown
thattheselossesarereversibleinespeciallythewomenfrom developedcountries.6Ontheotherhand,clinicalentitiessuch
aspregnancy-andlactation-associatedosteoporosis,7
osteo-porosisofthehipmaydevelopinthepost-partumperiodin somepatients,whichmaybeacauseofseriousmorbidity.8
Theeffectsofmultiparityonthebonemineraldensityinthe post-menopausalperiodarestillcontroversial.
Whilesomeresearchers reportanabsence ofapositive ornegativeeffectofparityonbonemineraldensity,9,10there
areotherswhohavereportedapositiveeffect11oranegative
effectonbonemineraldensity.12,13 Increaseinbodyweight
duringpregnancy, increasingestrogenhormoneand multi-vitaminsupplementtakenduringpregnancyarethoughtto havepositive effectson BMD.14 Onthe other hand,
inabil-itytocompensatethe calciumtransferfromthemother to thebaby duringpregnancyand lactationwithdietin espe-ciallypopulationswithlowersocioeconomicstatusisthought toexertanegativeeffectonBMD.15 Turkeyisadeveloping
country,wheremultiparityisquiteprevalent.Ouraimwasto investigatetheeffectsofparityonosteoporosis,byevaluating
bonemineraldensity,markersofboneturnover,ageatfirst pregnancy,durationoflactationandotherfactorsassociated withosteoporosisinmultiparous(fiveormoredeliveries)and nulliparouswomeninthepostmenopausalperiod.
Materials
and
methods
This prospective study was conducted in the Department of Obstetrics and Gynecology, and Department of Physical MedicineandRehabilitationatKocaeliDerinceEducationand Research Hospital. A total of 327 postmenopausal women with five or moredeliveries or who had never givenbirth wereofferedparticipationinthisstudyamongfemalepatients who were admittedat our institution. Ofthose, 124 post-menopausalpatientsrefusedtoparticipateinthestudy,and 81postmenopausalwomenwereexcludedduetoexclusion criteria.Atotalof91postmenopausalwomenwith≥5 deliv-eriesand31womenwhohadnevergivenbirthwereincluded. Dataweregatheredbypersonalinterviewsafterthepatients were informed about the study and their consents were obtained.Thestudyprotocolwasperformedaccordingtothe HelsinkiCommitteerequirements andwasapprovedbythe institutionalreviewboard ofKocaeli University(KOUKAEK 2012/44).
osteoporosis(steroids, thiazides, anti-dyslipidemic medica-tions,warfarin,chemotherapy),thosethat were treatedfor osteoporosisbefore,patientswhowereimmobilizedfor pro-longedperiodsof time,and those that had used hormone replacementwereexcluded.
Sociodemographicdataofallpatientswererecorded.Their bodymassindiceswerecalculated.Smokingandalcohol con-sumption,familyhistoriesofosteoporosisandfracture,and gynecologicpersonalhistorieswereasked.Theageat menar-che,ageatfirstdelivery,durationofmenopause,totalnumber ofchildren, number ofpregnancies, and duration of lacta-tionwererecorded.Thelactationdurationforeachchildwas separately recorded, and the durations of all childrenof a patientwereaddedtocalculatethetotaldurationoflactation. Clothingstylesofthewomenwerecategorizedasmodernor conventional(i.e.coveringallthebody exceptthe faceand hands).Theirintakeofcalciumandlevelofphysicalactivity werequestionedaccordingtoEuropeanVertebral Osteoporo-sisStudy(EVOS)questionnaire.16,17Thetotalphysicalactivity
scoreandtotallifelongcalciumintakewerecalculated.The totalactivityscorewascalculatedasfollows:thedurationof walksoutsidehome(scaleof4points;0:none,1:lessthanhalf anhour,2:1/2–1h,3:morethan1h),physicalactivitylevelsfor youngadultandadulthoodperiods(scaleof4points;1:mild, 2:moderate,3:intensive,4:veryintensive)andfrequencyof participatinginsportiveactivitiesinyoungadultand adult-hoodperiods(scaleof5points;0:none,1:sometimes,2:less than1hperweek,3:1–2hperweek,4:morethan1hperweek) (maximaltotalactivityscore:19points).Totallifelongintake ofcalciumscorewascalculatedbyaddingconsumptionsof milkanddairyproductsinchildhoodandadulthoodperiods (evaluationsystemof4points;1:less thanonceaweek,2: everyweek,3:everyday,4:morethanonceaday).
Bone
marker
measurements
and
laboratory
testing
Afastingbloodspecimenwasdrawnfromeachsubject.Blood samples were collected between 8:00a.m. and 10:30a.m., and parathyroid hormone (PTH), thyroid stimulating hor-mone(TSH),calcium,andphosphoruslevelsweremeasured by automated standard methods. Plasma osteocalcin and beta-CrossLaps(-CTx)weremeasuredwiththe electrochemi-luminescence method using the Cobas® (Roche, Germany) kitintheCobase601® (Roche,Germany)analyzer.TheIDS® bone-specific alkaline phosphatase (BS.ALP) (Immunodiag-nosticSystemsLtd.,UK)wasstudiedusingtheenzymelinked immunosorbentassay(ELISA)kitintheBioTek®ELISAreader (BioTekInc.,USA).Additionally,25-hydroxy-vitaminD3 (vita-min D) was chromatographically measured using the D3 Waters® UPLC/MS/MS device (Roche, UK).Hemoglobin A1c levelsweremeasuredbyhigh-performanceliquid chromatog-raphy(HPLC).
Bone
mineral
density
measurement
Bonemineraldensityatthelumbarspineandfemoralneck weremeasuredbydualenergyX-rayabsorptiometry(Lunar
pro).LumbarspineBMDwasdefinedasthemeanoflumbar vertebrae1–4.
Statistical
analysis
Number Cruncher Statistical System (NCSS) 2007 & Power Analysis and Sample Size (PASS) 2008 Statistical Software (Utah, USA) was used forthe statistical analysis. Descrip-tivestatisticalmethods(mean,standarddeviation,median, frequency,rate,minimum,maximum)aswellasStudent’st testforcomparisonoftwogroupswithnormaldistribution and Mann–Whitney Utest was usedin the comparisonof groupswithoutanormaldistribution.Fisher–Freeman–Halton test, Fisher’s exact test and Yates’ continuity correction test (Yates correctedchi-square) were usedinthe compar-isonofqualitativedata. Spearmancorrelationanalysiswas usedintheevaluationofassociationsbetweenparameters. The effects of risk factors on osteoporosis were evaluated with logistic regression analysis (backward) as multivari-ate analysis.Significancelevelsofp<0.01 andp<0.05were used.
Results
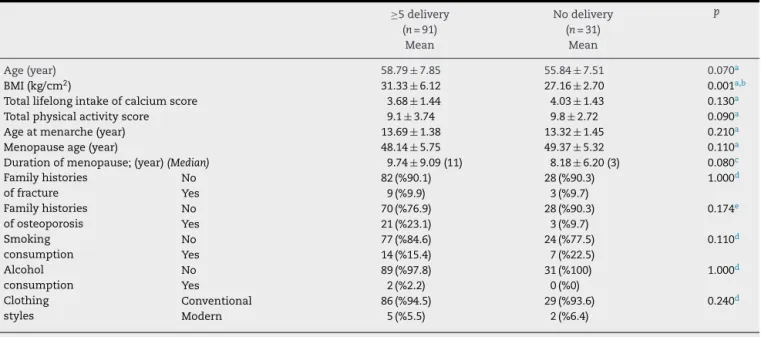
Themeanageofmultiparouswomenwas58.79±7.85,while themeanageofnulliparouswomenwas55.84±7.51.There were no statistically significant differences between these twogroupsintermsofage,familyhistoryoffractures, fam-ilyhistoryofosteoporosis,smokingoralcoholconsumption, clothingstyle,totalintakeofcalcium,physicalactivityscore, duration ofmenopause,andageatmenopause.TheBMIof multiparouswomen was31.33±6.12,and theBMIof nulli-parouswomenwas27.16±2.70.ThedifferencebetweenBMI valueswasstatisticallysignificant(Table1).Themeanparity ofmultiparouswomenwas6.04±1.80(5–13),theirmeanage atfirstdelivery18.85±2.43,andmeanageatlastdeliverywas 35.25±3.22.
Therewasnosignificantdifferencebetweencalcium,ALP, TSH,BS.ALP,magnesium,osteocalcinand CTXlevelsofthe twogroups(p>0.05).ThephosphorusandPTHlevelsof mul-tiparouswomen were significantlyhigher than nulliparous women(p=0.002;p=0.001;p<0.01).The25(OH)vitaminD3 levelsofmultiparouswomenwerestatisticallysignificantly lower(p=0.005;p<0.01)(Table2).
ThefemoralBMDofmultiparouswomenwas0.94±0.16 andlumbarBMD1.01±0.16,whilefemoralBMDofnulliparous women was 0.99±0.16 and lumbar BMD 1.07±0.14. There were no statisticallysignificant differences between the T scoreL1–4andBMDandTscorefemurandBMDlevels(p>0.05)
(Table3).
Table1–Sociodemographicandclinicalfeaturesofpostmenopausalmultiparouswomenandnulliparouswomen.
≥5delivery Nodelivery p
(n=91) (n=31)
Mean Mean
Age(year) 58.79±7.85 55.84±7.51 0.070a
BMI(kg/cm2) 31.33±6.12 27.16±2.70 0.001a,b
Totallifelongintakeofcalciumscore 3.68±1.44 4.03±1.43 0.130a
Totalphysicalactivityscore 9.1±3.74 9.8±2.72 0.090a
Ageatmenarche(year) 13.69±1.38 13.32±1.45 0.210a
Menopauseage(year) 48.14±5.75 49.37±5.32 0.110a
Durationofmenopause;(year)(Median) 9.74±9.09(11) 8.18±6.20(3) 0.080c Familyhistories
offracture
No 82(%90.1) 28(%90.3) 1.000d
Yes 9(%9.9) 3(%9.7)
Familyhistories ofosteoporosis
No 70(%76.9) 28(%90.3) 0.174e
Yes 21(%23.1) 3(%9.7)
Smoking consumption
No 77(%84.6) 24(%77.5) 0.110d
Yes 14(%15.4) 7(%22.5)
Alcohol consumption
No 89(%97.8) 31(%100) 1.000d
Yes 2(%2.2) 0(%0)
Clothing styles
Conventional 86(%94.5) 29(%93.6) 0.240d
Modern 5(%5.5) 2(%6.4)
a Student’sttest.
b p<0.01.
c Mann–WhitneyUtest.
dFisher’sexacttest.
e Yates’continuitycorrectiontest.
Table2–Thecomparisonoflaboratoryvaluesbetweengroups.
≥5delivery Nodelivery p
(n=91) (n=31)
Mean±SD Mean±SD
Calcium 9.43±0.44 9.37±0.30 0.430a
Phosphorus 3.45±0.41 3.18±0.41 0.002a,b
Magnesium 2.18±0.28 2.08±0.16 0.073a
Alkalinephosphatase(Median) 82.65±31.79(78) 73.73±24.96(71) 0.361c Parathyroidhormone(Median) 75.72±34.09(74) 58.22±27.81(49) 0.001b,c Thyroidstimulatinghormone(Median) 1.77±1.04(1.6) 1.76±0.79(1.8) 0.769c Bone-specificalkalinephosphatase(Median) 22.38±19.35(8) 19.24±5.82(10) 0.724c
Osteocalcin(Median) 21.75±10.66(20.9) 21.21±5.62(21.1) 0.637c
VitaminD3(Median) 22.44±17.64(17.6) 31.89±19.88(24.1) 0.005b,c CTx(Median) 382.27±188.69(351.0) 409.20±121.97(390.5) 0.177c
a Student’sttest.
b p<0.01.
c Mann–WhitneyUtest.
Table3–Comparisonofbonemineraldensity. ≥5delivery Nodelivery p
(n=91) (n=31) Mean±SD Mean±SD
TscoreL1–4
(Median)
−1.48±1.28(−1.6) −1.03±1.04(−1.2) 0.057a
BMDscore L1–4
(Median)
1.01±0.16(1.0) 1.07±0.14(1.0) 0.052a
Tscorefemur
(Median)
−0.66±1.05(−0.8) −0.37±0.92(−0.4) 0.120a
BMDscore femur
(Median)
0.94±0.16(0.9) 0.99±0.16(1.0) 0.098a
a Mann–WhitneyUtest.
There werenostatisticallysignificantassociationsbetween thedurationsoflactationandTscoreFemur,andBMDscore Femurmeasurements(p>0.05)(Fig.1).
2
0
–2
–4
0 100 200 300 400 500
Duration of breastfeeding (month)
T L1-L4 score
L1-L4 BMD
T L1-L4 score
L1-L4 BMD
Fig.1–Therelationshipbetweendurationofbreastfeeding andBMD.
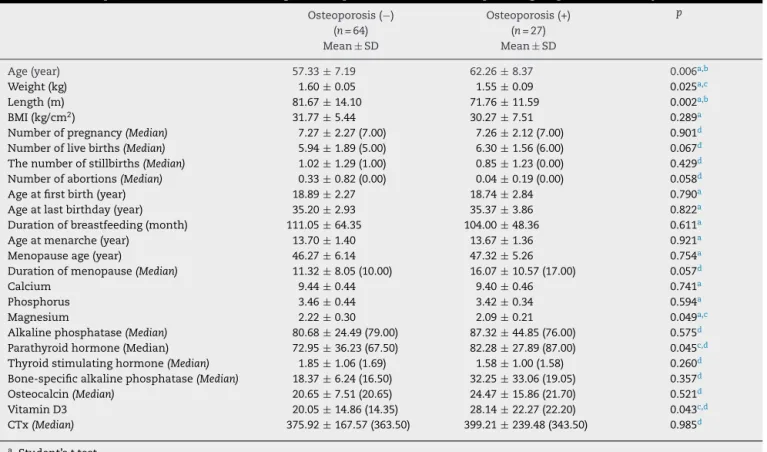
Age,bodyweight,durationofmenopause,PTHandvitamin D3levelsthathaveaneffectonosteoporosisinmultiparous womenwereevaluatedwithlogisticregressionanalysis (back-ward).Themodelforriskfactorsforosteoporosisthatwere createdafterfourstepsisshowninTable5.Riskfactorsfor osteoporosissuchasbodyweightanddurationofmenopause areseentocreateasignificantmodel.Theexplanation coef-ficientofthemodelis78%,whichisagoodlevel.According tothemodel,bodyweightbelow65kgincreaseosteoporosis 3321times(95%CI:1.243–8.872).Anunitincreaseinthe dura-tionofmenopauseincreasetheriskofosteoporosis1108times (95%CI:1.028–1.194).AlthoughthelevelofvitaminD3didnot reachstatisticalsignificanceinthismodel,ithadaneffecton osteoporosisthatisverynearsignificance(p=0.056;p>0.05).
Discussion
Astatisticallysignificant differencewasnotfoundbetween postmenopausal multiparous and nulliparous women in termsoffemoralandlumbarTscoresandBMDscores.Asthe totaldurationoflactationincreases,lumbarTscoresand lum-barBMDvaluesdecreaseinmultiparouswomen.Theduration ofmenopause,bodyweightbelow65kgwerefoundtobe inde-pendentriskfactorsforosteoporosisinmultiparouswomen.
Theeffectofparityonbonemineraldensityinthe post-menopausalperiodisstillcontroversial.Hillieretal.couldnot
Table4–Descriptivecharacteristicsaccordingtoosteoporosisassetsinmultiparousgroupandlaboratoryvalues.
Osteoporosis(−) Osteoporosis(+) p
(n=64) (n=27)
Mean±SD Mean±SD
Age(year) 57.33±7.19 62.26±8.37 0.006a,b
Weight(kg) 1.60±0.05 1.55±0.09 0.025a,c
Length(m) 81.67±14.10 71.76±11.59 0.002a,b
BMI(kg/cm2) 31.77±5.44 30.27±7.51 0.289a
Numberofpregnancy(Median) 7.27±2.27(7.00) 7.26±2.12(7.00) 0.901d Numberoflivebirths(Median) 5.94±1.89(5.00) 6.30±1.56(6.00) 0.067d Thenumberofstillbirths(Median) 1.02±1.29(1.00) 0.85±1.23(0.00) 0.429d Numberofabortions(Median) 0.33±0.82(0.00) 0.04±0.19(0.00) 0.058d
Ageatfirstbirth(year) 18.89±2.27 18.74±2.84 0.790a
Ageatlastbirthday(year) 35.20±2.93 35.37±3.86 0.822a
Durationofbreastfeeding(month) 111.05±64.35 104.00±48.36 0.611a
Ageatmenarche(year) 13.70±1.40 13.67±1.36 0.921a
Menopauseage(year) 46.27±6.14 47.32±5.26 0.754a
Durationofmenopause(Median) 11.32±8.05(10.00) 16.07±10.57(17.00) 0.057d
Calcium 9.44±0.44 9.40±0.46 0.741a
Phosphorus 3.46±0.44 3.42±0.34 0.594a
Magnesium 2.22±0.30 2.09±0.21 0.049a,c
Alkalinephosphatase(Median) 80.68±24.49(79.00) 87.32±44.85(76.00) 0.575d Parathyroidhormone(Median) 72.95±36.23(67.50) 82.28±27.89(87.00) 0.045c,d Thyroidstimulatinghormone(Median) 1.85±1.06(1.69) 1.58±1.00(1.58) 0.260d Bone-specificalkalinephosphatase(Median) 18.37±6.24(16.50) 32.25±33.06(19.05) 0.357d Osteocalcin(Median) 20.65±7.51(20.65) 24.47±15.86(21.70) 0.521d
VitaminD3 20.05±14.86(14.35) 28.14±22.27(22.20) 0.043c,d
CTx(Median) 375.92±167.57(363.50) 399.21±239.48(343.50) 0.985d
a Student’sttest.
b p<0.01.
c p<0.05.
Table5–Logisticregressionanalysisofriskfactorsforosteoporosisinmultiparousgroup.
B S.E. p ExpB %95CI
Lower Upper
Durationofmenopause 0.102 0.038 0.007a 1.108 1.028 1.194
VitaminD3level 0.032 0.017 0.056 1.033 0.999 1.068
Weight(kg) 1.2 0.501 0.017b 3.321 1.243 8.872
a p<0.01.
b p<0.05.
findanassociationbetweenparityandBMDinthehip,spine andradiusintheirstudyon9699women,afteradjustments forotherosteoporosisriskfactors.10Lenoraetal.9dividedthe
patientsintogroupsofthosehavingnochildren(n=35),those with1–2 children(n=38), 3–4children(n=70) and fiveand morechildren(n=67)intheirstudyon210postmenopausal women,anddidnotfindastatisticallysignificantdifference between them in terms of lumbar and femoral BMD. The resultsofthesetwostudiesaresimilartoours.Therearealso studiesintheliteraturereportingaprotectiveeffectofparity againstosteoporosis.Foxetal.havereportedanincreasein proximalradiusdensityof1.4%ateverydelivery.18Cureetal.
havereportedintheirstudyinColumbiathatmultiparityis protectiveagainstosteoporosisincomparisonwith nullipar-ity.Intheir studytheyhavefoundanapproximately2-fold increaseinosteopenia,and a4-fold increasein osteoporo-sisin nulliparous womenin comparisonwith multiparous women.11Therearealsostudiesreportingnegativeeffectsof
parityonbonemineraldensity.Guretal.12havefoundlower
BMDvaluesintheirstudyinTurkeyatthespineandtrochanter inwomenhavinggiventofiveormorebirthsincomparison withwomenwithnodeliveriesorthosewithfewerdeliveries. Theyhavereportedacorrelationbetweenthenumberof preg-nanciesandBMDatthetrochanter,andWard’striangle,but notwiththeBMDatthefemoralneck.Pluskiewiczetal.19have
evaluatedbonemineraldensityinpostmenopausalwomen withquantitativeultrasoundatcalcaneusandphalanges,and foundlowerz-scoresinwomenwith3,4,5and6deliveriesin comparisonwiththosewith1,2deliveriesornodeliveries. Bodyweightandthedurationofmenopausewerefoundtobe factorsthathadaneffectonbonesintheregressionanalysis. The differences in findings of different studies on the effectsofparityonBMDmaybeduetodifferencesin method-ologies,samplesizesandlevelofdevelopmentofthecountry thatthestudywasconducted.Markersofboneturnoverand osteoporosisriskfactorssuchasphysicalactivityleveland cal-ciumintakewerenotevaluatedinmanystudies.Bothgroups wereextensivelyevaluatedintermsofriskfactorsof osteo-porosisandadjustmentsweremadeaccordingtoosteoporosis riskfactorsofthegroups.Inthepresentstudy,nodifferences were detectedinthe BMDsofthe twogroupsafter adjust-mentsforBMIlevelsweredoneinmultiparousandnulliparous womenwithsimilarcalciumintakes,physicalactivitylevels andages.
Demirtas¸etal.20havereportedthatdurationofmenopause
inmultiparouswomenisanindependentriskfactorfor osteo-porosis.Thedurationofmenopausewasalsofoundtobean independentriskfactorinmultiparouswomeninourstudy.
Also,thosewithabodyweightbelow65kgwerefoundtobe atriskforosteoporosis.Itiswellknownthatweightis pro-tectiveagainstosteoporosisbyexertingamechanicalloadon thebone,andthatwomenwithalowerbodyweightarelose morebone.21Inastudy,thebestpredictoroflowbonemineral
densityinwomenwasfoundtobealowbodyweight.Women withabodyweightlowerthan66kgwasreportedtobeatrisk forbonemineraldensityloss.22Similarly,alowbodyweight
wasfoundtoincreasetheriskofosteoporosisinmultiparous womeninthepresentstudy.
Manystudieshaveshownthepresenceofanassociation betweenthedurationoflactationandbonemineraldensity. Okyayetal.haveshownthatlactationdurationlongerthan1 yearperchildcreatesariskforosteoporosis.14Longer
dura-tionsoflactationbeforepeakboneageandespeciallybefore27 yearsofageincreaseosteoporosisrisk.14Thestudiesthathave
shownanassociationbetweenlactationandlowBMD23have
reportedthatthenegativeeffectonBMDisreversedwiththe initiationofmenstrualcycle.24 Someauthorshavereported
thatprolongeddurationoflactationmaycauserestorationof inadequate boneloss, andthatthis restorationmay notbe enoughinthepresenceofveryhighparity,low socioecono-miclevel,inadequatecalciumandvitaminintake.23,25Tsvetov
etal.26havereportedanegativeeffectofprolongedlactation
onBMDandthatthisismostfrequentlyseeninthevertebrae. WealsofoundanegativecorrelationbetweenlumbarBMD andthedurationoflactation.
Asfarasweknow,thereisnostudyintheliteraturethat hasevaluatedmarkersofboneturnoverinmultiparousand nulliparouswomen.Theabsenceofadifferencebetweenthe groupsinALP,osteocalcin,CTXsupportstheabsenceofa dif-ferenceinbonemineraldensities.VitaminDwaslowerand PTHwashigherinmultiparouswomenincomparisonto nul-liparouswomen.Inadequateexposureofmultiparouswomen tosunlightmayberesponsibleforthiscondition.
Conflicts
of
interest
Theauthorsdeclarenoconflictsofinterest.
r
e
f
e
r
e
n
c
e
s
1. SvedbomA,HernlundE,IvergårdM,CompstonJ,CooperC, StenmarkJ,etal.EUreviewpanelofIOFosteoporosisinthe EuropeanUnion:acompendiumofcountry-specificreports. ArchOsteoporos.2013;8:137,
http://dx.doi.org/10.1007/s11657-013-0137-0.Epub2013
October11.
2. LiuYJ,ZhangL,PapasianCJ,DengHW.Genome-wide associationstudiesforosteoporosis:a2013update.JBone Metab.2014;21:99–116,
http://dx.doi.org/10.11005/jbm.2014.21.2.99.Epub2014May
31.
3. HosieCJ,HartDM,SmithDA.Differentialeffectoflong-term
oestrogentherapyontrabecularandcorticalbone.Maturitas.
1989;11:137–45.
4. NachtigallMJ,NazemTG,NachtigallRH,GoldsteinSR. Osteoporosisriskfactorsandearlylife-stylemodificationsto decreasediseaseburdeninwomen.ClinObstetGynecol. 2013;56:650–3,
http://dx.doi.org/10.1097/GRF.0b013e3182aa1daf.
5. OliveriB,ParisiMS,ZeniS,MautalenC.Mineralandbone masschangesduringpregnancyandlactation.Nutrition. 2004;20:235–40,http://dx.doi.org/10.1016/j.nut.2003.10.011.
6. BezerraFF,MendoncaLM,LobatoEC,O’BrienKO,Donangelo
CM.Bonemassisrecoveredfromlactationtopostweaningin
adolescentmotherswithlowcalciumintakes.AmJClinNutr.
2004;80:1322–6.
7. ChoeEY,SongJE,ParkKH,SeokH,LeeEJ,LimSK,etal.Effect ofteriparatideonpregnancyandlactation-associated osteoporosiswithmultiplevertebralfractures.JBoneMiner Metab.2012;30:596–601,
http://dx.doi.org/10.1007/s00774-011-0334-0.Epub2011
November23.
8. ErginT,SelamB,LembetA,OztürkHB,DamlacıkA,Demirel C.Transientosteoporosisofpregnancy:casereport.JTurkGer GynecolAssoc.2010;11:163–4,
http://dx.doi.org/10.5152/jtgga.2010.27,eCollection2010.
9. LenoraJ,LekamwasamS,KarlssonMK.Effectsofmultiparity andprolongedbreast-feedingonmaternalbonemineral density:acommunity-basedcross-sectionalstudy.BMC WomensHealth.2009;1:19,
http://dx.doi.org/10.1186/1472-6874-9-19.
10.HillierTA,RizzoJH,PedulaKL,StoneKL,CauleyJA,BauerDC,
etal.Nulliparityandfractureriskinolderwomen:thestudy
ofosteoporoticfractures.JBoneMinerRes.2003;18:893–9.
11.Cure-CureC,Cure-RamírezP,TeránE,López-JaramilloP.
Bone-masspeakinmultiparityandreducedriskof
bone-fracturesinmenopause.IntJGynaecolObstet.
2002;76:285–91.
12.GurA,NasK,CevikR,SaracAJ,AtaogluS,KarakocM.
Influenceofnumberofpregnanciesonbonemineraldensity
inpostmenopausalwomenofdifferentagegroups.JBone
MinerMetab.2003;21:234–41.
13.OzdemirF,DemirbagD,RodopluM.Reproductivefactors
affectingthebonemineraldensityinpostmenopausal
women.TohokuJExpMed.2005;205:277–85.
14.OkyayDO,OkyayE,DoganE,KurtulmusS,AcetF,TanerCE. Prolongedbreast-feedingisanindependentriskfactorfor postmenopausalosteoporosis.Maturitas.2013;74:270–5,
http://dx.doi.org/10.1016/j.maturitas.2012.12.014.Epub2013
January24.
15.WalkerAR,WalkerBF.Recommendeddietaryallowancesand
thirdworldpopulations.AmJClinNutr.1981;34:2319–21.
16.O’NeillTW,CooperC,AlgraD,PolsH,AgnusdeiD,DequekerJ,
etal.Designanddevelopmentofaquestionnaireforuseina
multicentrestudyofvertebralosteoporosisstudy(EVOS).
RheumatolEur.1995;24:75–81.
17.O’NeilTW,CooperC.Reproducibilityofaquestionnaireon
riskfactorsforosteoporosisinamulticentreprevalence
survey:theEuropeanVertebralOsteoporosisStudy.IntJ
Epidemiol.1994;23:555–65.
18.FoxKM,MagazinerJ,SherwinR,ScottJC,PlatoCC,NevittM,
etal.Reproductivecorrelatesofbonemassinelderlywomen
StudyofOsteoporoticFracturesResearchGroup.JBoneMiner
Res.1993;8:901–8.
19.PluskiewiczW,Skwira-KapałaM,DrozdzowskaB.The influenceofparityonquantitativeultrasoundevaluationof thecalcaneusandhandphalangesinPolishpostmenopausal women.JBoneMinerMetab.2011;29:437–41,
http://dx.doi.org/10.1007/s00774-010-0237-5.Epub2010
November12.
20.DemirtasO,DemirtasG,HursitogluBS,TerziH,SekerciZ,Ok
N.Isgrandmultiparityariskfactorforosteoporosisin
postmenopausalwomenoflowersocioeconomicstatus?Eur
RevMedPharmacolSci.2014;18:2709–14.
21.NguyenTV,SambrookPN,EismanJA.Boneloss,physical
activity,andweightchangeinelderlywomen:theDubbo
OsteoporosisEpidemiologyStudy.JBoneMinerRes.
1998;13:1458–67.
22.Dargent-MolinaP,PoitiersF,BréartG.Inelderlywomen
weightisthebestpredictorofaverylowbonemineral
density:evidencefromtheEPIDOSstudy.OsteoporosInt.
2000;11:881–8.
23.DursunN,AkinS,DursunE,SadeI,KorkusuzF.Influenceof
durationoftotalbreast-feedingonbonemineraldensityina
Turkishpopulation:doesthepriorityofriskfactorsdiffer
fromsocietytosociety?OsteoporosInt.2006;17:651–5.
24.BalaschJ.Sexsteroidsandbone:currentperspectives.Hum
ReprodUpdate.2003;9:207–22.
25.DemirB,HaberalA,GeyikP,BaskanB,OzturkogluE,Karacay O,etal.Identificationoftheriskfactorsforosteoporosis amongpostmenopausalwomen.Maturitas.2008;60:253–6,
http://dx.doi.org/10.1016/j.maturitas.2008.07.011.Epub2008
September7.
26.TsvetovG,LevyS,BenbassatC,Shraga-SlutzkyI,HirschD. Influenceofnumberofdeliveriesandtotalbreast-feeding timeonbonemineraldensityinpremenopausalandyoung postmenopausalwomen.Maturitas.2014;77:249–54,
http://dx.doi.org/10.1016/j.maturitas.2013.11.003.Epub2013