BGD
6, 3455–3480, 2009From laboratory manipulations to earth system models
A. Ridgwell et al.
Title Page
Abstract Introduction
Conclusions References
Tables Figures
◭ ◮
◭ ◮
Back Close
Full Screen / Esc
Printer-friendly Version
Interactive Discussion
Biogeosciences Discuss., 6, 3455–3480, 2009 www.biogeosciences-discuss.net/6/3455/2009/ © Author(s) 2009. This work is distributed under the Creative Commons Attribution 3.0 License.
Biogeosciences Discussions
Biogeosciences Discussionsis the access reviewed discussion forum ofBiogeosciences
From laboratory manipulations to earth
system models: predicting pelagic
calcification and its consequences
A. Ridgwell1, D. N. Schmidt2, C. Turley3, C. Brownlee4, M. T. Maldonado5, P. Tortell5,6, and J. R. Young7
1
School of Geographical Sciences, University of Bristol, UK
2
Department of Earth Sciences, University of Bristol, UK
3
Plymouth Marine Laboratory, Plymouth, UK
4
Marine Biological Association, Citadel Hill, Plymouth, UK
5
Department of Earth and Ocean Sciences, University of British Columbia, Vancouver, Canada
6
Department of Botany, University of British Columbia, Vancouver, Canada
7
Palaeontology Department, The Natural History Museum, London, UK
Received: 24 March 2009 – Accepted: 29 March 2009 – Published: 1 April 2009
Correspondence to: A. Ridgwell ([email protected])
BGD
6, 3455–3480, 2009From laboratory manipulations to earth system models
A. Ridgwell et al.
Title Page
Abstract Introduction
Conclusions References
Tables Figures
◭ ◮
◭ ◮
Back Close
Full Screen / Esc
Printer-friendly Version
Interactive Discussion Abstract
The variation in pH-dependent calcification responses of coccolithophores paint a highly incoherent picture, particularly for the most commonly cultured “species”, Emil-iania huxleyi. The disparity between magnitude and even sign of the calcification change at higher CO2 (lower pH), raises challenges to quantifying future carbon cy-5
cle changes and feedbacks, by introducing significant uncertainty in parameterizations used for global models. Putting aside the possibility of methodological differences that introduce an experimental bias, we highlight two pertinent observations that can help resolve conflicting interpretations: (1) a calcification “optimum” in environmental condi-tions (pH) has been observed in other coccolithophore species, and (2) there exists an
10
unambiguous direction to the CO2-calcification response across mesocosm and ship-board incubations. We propose that an equivalence can be drawn between integrated ecosystem calcification as a function of pH (or other carbonate system parameter such as calcite saturation state) and a widely used description of plankton growth rate vs. temperature – the “Eppley curve”. This provides a conceptual framework for
recon-15
ciling available experimental manipulations as well as a quasi-empirical relationship for ocean acidification impacts on carbonate production that can be incorporated into models. By analogy to the Eppley curve temperature vs. growth rate relationship, progressive ocean acidification in the future may drive a relatively smooth ecosystem response through transition in dominance from more to less heavily calcified
coccol-20
ithophores in addition to species-specific calcification changes. However, regardless of the model parameterization employed, on a century time-scale, the CO2-calcification
BGD
6, 3455–3480, 2009From laboratory manipulations to earth system models
A. Ridgwell et al.
Title Page
Abstract Introduction
Conclusions References
Tables Figures
◭ ◮
◭ ◮
Back Close
Full Screen / Esc
Printer-friendly Version
Interactive Discussion
1 Introduction
Concerns were raised in the late 1990s that reductions in the carbonate ion (CO2−
3 )
concentration and pH of the surface ocean resulting from the uptake of fossil fuel CO2
from the atmosphere, might adversely affect the ability of marine plankton such as coc-colithophorids and foraminifera to produce calcium carbonate (CaCO3) shells (Wolf-5
Gladrow et al., 1999). The wide availability of physiologically well characterized strains of calcifying phytoplankton in long-term culture enabled the impact of ocean acidifi-cation to be tested. Early laboratory experiments carried out on the most abundant modern species of coccolithophorid,Emiliania huxleyi, in which the pH of the growth medium was decreased by addition of acid, produced varying calcification responses
10
(Buitenhuis et al., 1999; Nimer and Merrett, 1993). However, the chemical conditions used in many of the manipulations deviated substantially from either modern or possi-ble future geochemistry. Subsequent laboratory experiments usingE. huxleyi manip-ulated pH to simulate a more “realistic” range of glacial and future CO2 changes, and
showed a clear overall decrease in carbonate production across low pH treatments
15
compared to the control (i.e., current ocean pH) together with the occurrence of mal-formed liths (calcium carbonate plates) (Riebesell et al., 2000; Zondervan et al., 2001). This result was consistent with contemporary ship-board experiments in the NE Pacific conducted with either acid/base additions or CO2bubbling which also showed a clear decrease in calcification at elevated CO2(Riebesell et al., 2000).
20
A strong CO2-dependence of calcification rates has significant implications for ocean
carbon cycling and would provide a negative feedback on atmospheric CO2increases (Ridgwell et al., 2007b; Zondervan et al., 2001), since calcification decreases seawater alkalinity and releases CO2from bicarbonate (HCO−3) in the upper ocean. Changes in
the production of biogenic CaCO3minerals at the ocean surface could potentially also
25
affect the transport of particulate organic carbon (POC) to depth (Armstrong et al., 2002; Klaas and Archer, 2002) and act to increase atmospheric CO2 via a reduction
BGD
6, 3455–3480, 2009From laboratory manipulations to earth system models
A. Ridgwell et al.
Title Page
Abstract Introduction
Conclusions References
Tables Figures
◭ ◮
◭ ◮
Back Close
Full Screen / Esc
Printer-friendly Version
Interactive Discussion
organic carbon production by coccolithophores was also observed (Zondervan et al., 2001), and this could provide a further (negative) feedback to rising atmospheric CO2. Subsequent experiments carried out onE. huxleyi, both in the laboratory (Feng et al., 2008; Sciandra et al., 2003) and in mesocosms (Delille, et al., 2005; Engel et al., 2005) generally supported a strong and detrimental impact of ocean acidification
5
on calcification. Studies of the relationship between coccolithophore assemblages to ocean geochemistry also provide evidence of a relationship between coccolithophorid calcification and carbonate chemistry (e.g., Cubillos et al., 2007; Tyrell et al., 2008; Beaufort et al., 2008).
However, in a series of very recent laboratory experiments, Iglesias-Rodriguez et
10
al. (2008a) and Shi et al. (2009) report quite the opposite response to many previous experiments – increased rather than decreased calcification at higher ambient CO2
(and lower pH). Interspecific variability in the CO2-sensitivity of calcification has
pre-viously been documented. For example, Coccolithus pelagicus and Calcidiscus lep-toporus grown in laboratory mono-cultures exhibit no consistent trend in calcification
15
as a function of CO2 (Langer et al., 2006), while Gephyrocapsa oceanica, a species
with close ancestoral links withE. huxleyi, responds with a very substantial decrease in calcification under high CO2(low pH) conditions (Riebesell et al., 2000; Zondervan
et al., 2001).
It is important to resolve this apparent incongruence in calcification responses to
20
simulated ocean acidification if we are to draw reliable implications from experimental manipulations regarding expected future CO2-dependent changes in marine
ecosys-tems. Global carbon cycle models used for predicting future fossil fuel CO2 impacts base their parameterizations for calcification closely on such results (e.g., Gehlen et al., 2007; Heinze, 2004; Hofmann and Schellnhuber, 2009; Ridgwell et al., 2007a, b),
25
and these model predictions will be unreliable if rooted in unrepresentative or misun-derstood laboratory observations.
frame-BGD
6, 3455–3480, 2009From laboratory manipulations to earth system models
A. Ridgwell et al.
Title Page
Abstract Introduction
Conclusions References
Tables Figures
◭ ◮
◭ ◮
Back Close
Full Screen / Esc
Printer-friendly Version
Interactive Discussion
work for reconciling experimental observations and making future predictions (Sect. 4). We start with an overview of the importance to atmospheric CO2of ocean acidification
impacts on pelagic calcification and how this is currently treated in models (Sect. 2), and end with brief conclusions and perspectives (Sect. 5).
2 Global carbon cycle impacts of ocean acidification
5
By precipitating calcium carbonate (CaCO3) from sea-water, marine organisms affect
the global carbon cycle and thus climate system. In the net chemical reaction for creating carbonate shells and skeletons:
Ca2++2HCO−
3 →CaCO3+CO2(aq)+H2O (1)
dissolved inorganic carbon in seawater, in the form of bicarbonate ions (HCO−
3) which 10
itself cannot interact directly with the atmosphere, is converted into dissolved CO2
(CO2(aq)) as a consequence of the removal of alkalinity (as Ca2+) during calcification. Thus, the process of calcification acts to increase the concentration of CO2(aq) at the
ocean surface and hence acts as a brake on the transfer of fossil fuel CO2 from the
atmosphere into the ocean. Consequently, reducing the rate of calcification globally
15
would accelerate the rate of uptake of fossil fuel CO2from the atmosphere, providing a
negative feedback on climate change.
There is a second reason for correctly representing the carbonate production re-sponse to ocean acidification in models – because mineral CaCO3 is much denser
than the soft body parts of plankton, the presence of CaCO3 in aggregates with or-20
ganic matter may be important in accelerating the rate of sinking (Armstrong et al., 2002; Klaas and Archer, 2002). In this “ballast hypothesis”, any reduction in calcifica-tion by plankton at the ocean surface would increase the time that POC was suspended in the warm upper ocean and increase the likelihood of its being consumed by the more numerous and more active bacteria present there (Turley and Mackie, 1994). A
BGD
6, 3455–3480, 2009From laboratory manipulations to earth system models
A. Ridgwell et al.
Title Page
Abstract Introduction
Conclusions References
Tables Figures
◭ ◮
◭ ◮
Back Close
Full Screen / Esc
Printer-friendly Version
Interactive Discussion
tion in the efficiency of the biological pump would create a positive feedback on rising atmospheric CO2.
Only a few global models have so far been applied to quantifying the importance of changing pelagic carbonate production on the oceans ability to sequester CO2.
Al-though the CO2-calcification feedback was initially assessed in box models (Barker et
5
al., 2003), the first ocean GCM to account for this effect was the HAMOCC model (Six and Maier-Reimer, 1996), in which Heinze (2004) parameterized the net ecosystem CaCO3:POC rxport ratio (R
CaCO3/POC
) as a function of the ambient CO2(aq)
concentra-tion ((CO2(aq))):
RCaCO3/POC =RCaCO3/POC
max · 1−0.012· CO2−CO2(0)
(2)
10
where CO2 is the current CO2(aq) concentration (µmol l−1), CO
2(0) is preindustrial
(CO2(aq)), andR
CaCO3/POC
max is assigned a value of 0.15. (Further modifications are made
in the model toRCaCO3/POC according to inferred diatom productivity.) The strength of the relationship between CaCO3:POC and (CO2(aq)) was taken directly from theE.
hux-leyi manipulation response reported by Zondervan et al. (2001).
15
Gehlen et al. (2007), in the ocean GCM/biogeochemical model OCM-PISCES (Gehlen et al., 2006) , generalized their parameterization of the CO2-calcification
re-sponse by including the newly available results of mesocosm experiments (Delille et al., 2005) in addition to laboratory manipulations (Zondervan et al., 2002). For the form of the empirical fit to the observed data, Gehlen et al. (2007) assumed a hyperbolic
20
function for their parameterization, akin to the Monod equation relating phytoplankton growth to nutrient concentrations:
RCaCO3/POC =RCaCO3/POC
max ·
(Ωc−1)
Kmax+(Ωc−1)
(3)
whereRmaxCaCO3/POC=0.8 andKmaxis assigned a value of 0.4.Ωc is the ambient saturation state with respect to calcite.
BGD
6, 3455–3480, 2009From laboratory manipulations to earth system models
A. Ridgwell et al.
Title Page
Abstract Introduction
Conclusions References
Tables Figures
◭ ◮
◭ ◮
Back Close
Full Screen / Esc
Printer-friendly Version
Interactive Discussion
Ridgwell et al. (2007a, b) utilized established abiotic precipitation thermodynamics as the basis for their description of marine carbonate production, in an equation of the form:
RCaCO3/POC =RCaCO3/POC
max ·(Ω−1)η (4)
whereηis a power setting the non-linearity of the calcification response to changes in
5
ambient saturation state. (RCaCO3/POC is zero for Ω
c<1.0.) In Ridgwell et al. (2007b), the implications of a range of potential values for η were considered, spanning the reported responses in a variety of different experimental manipulations and consistent with observed ocean geochemical distributions. The central estimate was withη=0.81. Finally, in a recent study, Hofmann and Schellnhuber (2009) incorporate the
box-10
model parameterization of Barker et al. (2003) into the ocean-atmosphere-sea ice-biogeochemistry model “POTSMOM-C” (Hofmann and Schellnhuber, 2009):
RCaCO3/POC
=e0.0083·
CO2−
3 −CO 2−
3(0)
(5)
where CO2−
3 is the current ambient carbonate ion concentration (µmol l
−1) and CO2−
3(0)
is assigned a value of 150µmol l−1.
15
As might be expected with different ocean GCMs utilizing different parameterizations for the calcification response to acidification, there is no agreement as to the predicted strength of the CO2-calcification feedbacks or the additional quantity of fossil fuel CO2
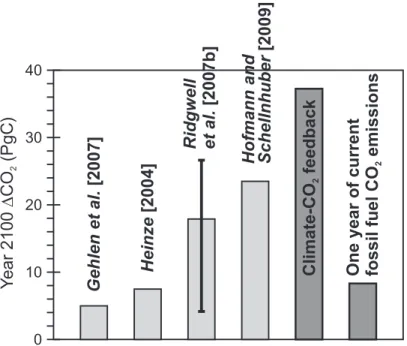
taken up by the ocean by the year 2100 due to reduced calcification, with estimates ranging from 5.9 and 23.4 PgC (Fig. 1). However, in constructing the CO2-calcification 20
parameterizations in the models, each study was also informed by different sub-sets of available experimental observations. We are left asking: How important is the un-certainty in the calcification response to ocean acidification in the range of estimates of future ocean CO2 uptake? And: How important to the CO2 predictions is the form
of the equation that is chosen (“structural” uncertainty)? The uncertainty in the CO2 -25
BGD
6, 3455–3480, 2009From laboratory manipulations to earth system models
A. Ridgwell et al.
Title Page
Abstract Introduction
Conclusions References
Tables Figures
◭ ◮
◭ ◮
Back Close
Full Screen / Esc
Printer-friendly Version
Interactive Discussion
models can be refined through better construction. But, which would be more effective in improving future CO2predictions?
Some insight into the sources of predictive uncertainty can be made using a single model and parameterization, but with an ensemble of differing model CO2-calcification
sensitivities accounting for the broad range of calcification responses observed in
lab-5
oratory manipulation experiments. In just such a modeling exercise, the predictions of enhanced year 2100 CO2uptake were found to span 5.4 PgC to 25.7 PgC, with an
en-semble mean of 17.2 PgC (Ridgwell et al., 2007b). This range of predictions exceeds that variability between different models, suggesting that the uncertainty in species calcification response and their relative importance for carbonate production globally is
10
likely dominating the overall uncertainty in model predictions of fossil fuel CO2 uptake by the ocean (Fig. 1).
Fewer global ocean models have assessed CO2-calcification together with
“ballast-ing”. Hofmann and Schellnhuber (2009) found a∼6 PgC (27%) reduction in CO2
up-take by the ocean due to reduced CaCO3 ballasting. Other studies have hinted that 15
as much as 80% of the CO2-calcificiation feedback could be negated (Heinze, 2004),
while Barker et al. (2003) predict a reversal, with more fossil fuel CO2 overall residing in the atmosphere. However, the importance of mineral ballasting in the transport of organic matter to depth is currently highly uncertain (Francois, et al., 2002; Passow and De La Rocha, 2006).
20
3 Reconciling observed coccolithophorid manipulation responses
The potential carbon cycle roles and feedbacks with climate involving the production and fate of calcite liths requires that we identify the sign of the response of pelagic carbonate production to ocean acidification and ideally, tightly constrain the magnitude of the response. To this end, and to help make better sense of experimental
observa-25
BGD
6, 3455–3480, 2009From laboratory manipulations to earth system models
A. Ridgwell et al.
Title Page
Abstract Introduction
Conclusions References
Tables Figures
◭ ◮
◭ ◮
Back Close
Full Screen / Esc
Printer-friendly Version
Interactive Discussion
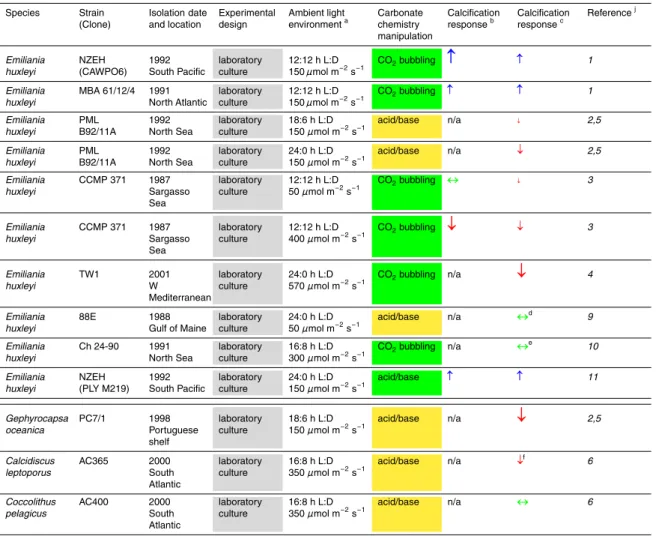
elevated CO2and lower pH (Table 1). While irradiance levels and nutrient regime may vary substantially between experiments and potentially be important (Riebesell et al., 2008), we will concentrate in this paper on: species (and strain), experimental design, and chemistry manipulation. Because there is no common baseline CO2concentration that is used across all experiments, nor consistent degree of acidification (or CO2 con-5
centration increase/decrease) in the experimental manipulation, or even a single unit for reporting calcification, we have characterized the calcification response qualitatively rather than quantitatively, as described in Table 1.
This compilation can be used to test the explanation proposed by Iglesias-Rodriguez et al. (2008a, b) – that the difference between the chemical manipulations performed is
10
critical, with direct acid/base manipulating pH (e.g., Riebesell et al., 2000, Zondervan et al., 2001) inducing an erroneous response to ocean acidification compared to CO2
bub-bling (e.g., Iglesias-Rodriguez et al., 2008a). The basis of this argument is that while both types of manipulations are capable of producing the same pH orpCO2changes, bicarbonate (HCO−
3) concentrations will differ (Iglesias-Rodriguez et al., 2008b; Shi et 15
al., 2009) which could potentially influence the response of both organic and inorganic carbon fixation if HCO−
3 is the substrate used (Buitenhuis et al., 1999; Paasche, 2002).
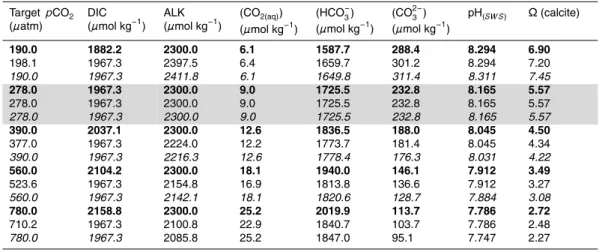
The carbonate parameters resulting from simulated CO2 bubbling (changing total
dissolved carbon, DIC) and acid/base addition (changing alkalinity, ALK) are summa-rized in Table 2. We argue that the differences in carbonate parameters between
20
the different manipulations are not critical. For instance, going from “preindustrial” (278 ppm) to approximately year 2100 CO2(twice modern, 780 ppm) produces a 17%
increase in HCO−
3 concentrations by CO2bubbling, and about half this due to acid/base
addition, while all other carbonate parameters are very comparable between manipu-lation methods. If bicarbonate ion concentration changes dominate the calcification
25
response, manipulation experiments carried out by acid/base addition will, if anything, underestimate acidification impacts. Otherwise, if (CO2(aq)), (CO
2−
3 ) and/or (H
+) (pH)
BGD
6, 3455–3480, 2009From laboratory manipulations to earth system models
A. Ridgwell et al.
Title Page
Abstract Introduction
Conclusions References
Tables Figures
◭ ◮
◭ ◮
Back Close
Full Screen / Esc
Printer-friendly Version
Interactive Discussion
Considering all reported coccolithophorid observations and associated experimen-tal details (Table 1), there is no evidence of any systematic correlation between the direction of calcification response under simulated future conditions and type of chem-ical manipulation. Furthermore, shipboard incubations in which chemchem-ical manipulation was carried out by both methods exhibit similar suppressions of carbonate production
5
at higher CO2(Riebesell et al., 2000). Very recent laboratory experiments performed
onE. huxleyi (strain: PLY M219) also support a general method-independence (Shi et al., 2009). Thus, we rule out the possibility of a consistent methodological bias between CO2 bubbling and acid/base addition that produces a spurious calcification response
in one direction or the other.
10
Also notable in our compilation are differences in the strain ofE. huxleyi used. The coccolithophoridE. huxleyi is in fact thought to be a “species complex”, encompassing a wide range of genotypic variation. This is suggested by the extraordinarily broad eco-logical and biogeographic distribution of the species, and by its morphoeco-logical variability (Paasche, 2002). This inference has been supported by a range of culture experiment
15
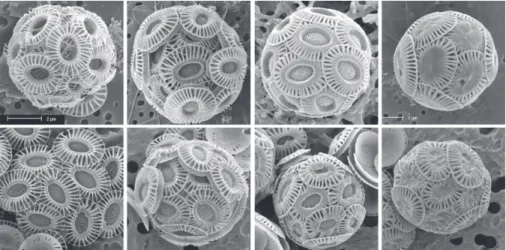
work, (e.g. Brand, 1982; Young and Westbroek, 1991), and molecular genetic stud-ies (Schroeder et al., 2005; Iglesias et al., 2006). It is now conventionally recognized thatE. huxleyi includes at least five morphologically discrete varieties or sub-species (Young et al., 2003). However, it is likely that this is a gross simplification since both field and culture observations reveal considerably more variability, not least in degree
20
of calcification of coccoliths (Young, unpublished data) (Fig. 2). Arguably we should re-gardE. huxleyi as a diverse assemblage of genotypes with highly variable calcification characteristics and ecological adaptations.
Given that different investigators have used different strains ofE. huxleyi (Table 1), much of the incongruence between observed responses across studies could result
25
BGD
6, 3455–3480, 2009From laboratory manipulations to earth system models
A. Ridgwell et al.
Title Page
Abstract Introduction
Conclusions References
Tables Figures
◭ ◮
◭ ◮
Back Close
Full Screen / Esc
Printer-friendly Version
Interactive Discussion
analogous to less controversial interspecific variability that has been reported amongst obviously different species (e.g., Langer et al., 2006).
4 An “Eppley Curve” for pelagic calcifiers?
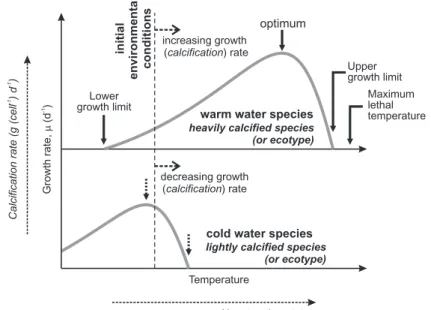
Individual phytoplankton species generally exhibit a pronounced growth response curve to temperature; with a growth rate maximum (µmax) corresponding to optimum
5
conditions (Fig. 3). Sampling just a few species taken from differing environments creates the potential for conflicting experimental observations, depending upon the po-sition of the experimental growth popo-sition relative to the species optimum (i.e. above or below). It is thus possible to find a temperature which exceeds the optimum of a cold-adapted species leading to slower growth rates with increasing temperature, while a
10
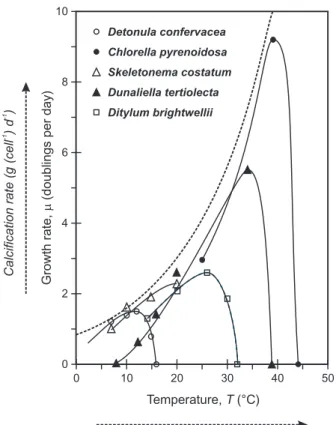
warm-adapted species might exhibit increased growth rates (experimental temperature is below the optimum). That the plankton growth response to changes in temperature (hereafter, the “T-growth” response) has not caused confusion or difficulties for global modelers may be ascribed to the work of Eppley (1972), who noted thatgiven a suf-ficiently large species sample size, the envelope of the individual growth-temperature
15
response curves could be delineated by a simple function of temperature (Fig. 4):
µmax=0.59·e0.0633·T (6)
This equation encapsulates the progressive transition in dominance amongst diff er-ent plankton species as a function of changing temperature, and hence, allows the net community growth rate to be simply approximated in models. The Eppley curve
20
thus negates the need to resolve the potential presence and specific characteristics of hundreds of individual species, by instead focusing on the community level response. Although the accuracy of this approximation becomes somewhat degraded in condi-tions of rapid species transition and dominance such as during a spring bloom (Moisan et al., 2002), global models invariably utilize the Eppley function (e.g., Aumont et al.,
25
BGD
6, 3455–3480, 2009From laboratory manipulations to earth system models
A. Ridgwell et al.
Title Page
Abstract Introduction
Conclusions References
Tables Figures
◭ ◮
◭ ◮
Back Close
Full Screen / Esc
Printer-friendly Version
Interactive Discussion
on larger data-sets have not led to any significant change in the details of this equation (Bissinger et al., 2008).
We propose for the purposes of encapsulating a net ecosystem calcification re-sponse to ocean acidification in models, equivalence between the T-growth and CO2
-calcification behaviors can be drawn. In doing this, we recognize that pH--calcification or
5
saturation-calcification (or other relationships with carbonate chemistry) may be equally (or more) applicable. We take CO2 concentration for illustration. The equivalent CO2
-calcification parameters are shown in Figs. 3 and 4.
The barrier to deducing the net community plankton calcification response vs. CO2
(and pH) is the small sample size available. To date, only in a single experiment
car-10
ried across future-relevant carbonate chemistry changes (Langer et al., 2006) has a clear calcification ‘optimum’ been observed (Table 1) – the remainder of the data-set, at best, is sampling incomplete portions of an optimum curve. It also seems likely that calcification optima, if generally existing, are relatively broad compared to existing growth-temperature relationships in the ocean and may have a highly protracted (or
15
non-existent) “tail” of declining calcification at lower CO2(higher pH) than the optimum.
From the paucity of available laboratory mono-specific manipulations and in light of the differing experimental conditions, even the sign of the CO2-calcification response
cannot be unambiguously assigned, unlike the case for the T-growth relationship for which 162 culture responses were originally available to define the response envelope
20
(Eppley, 1972). However, we note that the responses observed in shipboard incuba-tions (Riebesell et al., 2000) and mesocosm experiments (Delille et al., 2005; Engel et al., 2005), all manipulations with natural plankton assemblages, appear highly con-sistent in showing substantial decrease in community carbonate production at higher CO2 (Table 1). We suggest these observations can be reliably taken to inform the 25
sign of the CO2-calcification curve and that at progressively higher CO2net community calcification will generally be lower.
The apparently increased CO2sensitivity of carbonate production of natural
BGD
6, 3455–3480, 2009From laboratory manipulations to earth system models
A. Ridgwell et al.
Title Page
Abstract Introduction
Conclusions References
Tables Figures
◭ ◮
◭ ◮
Back Close
Full Screen / Esc
Printer-friendly Version
Interactive Discussion
support for our interpretation. This may reflect an amplification of acidification impacts on carbonate production via changes in the species and ecotype composition of cal-cifying phytoplankton assemblages, in addition to direct physiological impacts on the calcification of individual species. The co-variation between saturation state and mor-photype ofE. huxleyi observed across the Subantarctic and Polar Fronts in the
South-5
ern Ocean, with less heavily calcified ecotypes dominant at lower saturation state is also consistent with our model (Cubillos et al., 2007). In addition, Tyrell et al. (2008) ar-gued that the absence ofE. huxleyi in the Baltic but presence in the Black Sea cannot be explained by salinity or temperature but could be a result of calcite saturation state, while Beaufort et al. (2008) inferred that size and weight of coccoliths of
Isochrysi-10
dales (e.g.,E. huxleyi and Gephyrocapsa) through the Pacific Ocean correlates with carbonate system parameters, and especially alkalinity.
The most important impact of ocean acidification may thus occur through a shift in the dominance of one ecotype or species over another and hence a change in net ecosystem carbonate production, rather than through a physiological response
15
induced in any particular ecotype and individual species. Indeed, the difference in CO2-growth rate relationships between two distinct monoclonal cultures of E. huxleyi reported by Iglesias-Rodriguez et al. (2008a) hints at the possibility of succession by less heavily calcified ecotypes in the open ocean. In these experiments, the less calci-fied strain (MBA 61/12/4) exhibits less growth rate sensitivity to higher CO2 conditions
20
(M.D. Iglesias-Rodriguez, personal communication, 2008) than the more heavily calci-fied strain (CAWPO6) and under the 750 ppm CO2treatment, MBA 61/12/4 becomes
the faster growing strain. Preferential suppression of cell division rate of more heav-ily calcified ecotypes at higher CO2 is consistent with the observations of Cubillos et
al. (2007) and hints at the possibility of succession by less heavily calcified ecotypes in
25
the open ocean in the future.
BGD
6, 3455–3480, 2009From laboratory manipulations to earth system models
A. Ridgwell et al.
Title Page
Abstract Introduction
Conclusions References
Tables Figures
◭ ◮
◭ ◮
Back Close
Full Screen / Esc
Printer-friendly Version
Interactive Discussion
(Manzello et al., 2008). A species dominance adaptive response is also not possible for populations of carbonate shell forming species facing under-saturated conditions in the future, such as pteropods in the Southern Ocean (Orr et al., 2005), as all shell-forming species would be similarly vulnerable. Thus, calcifying (phyto-) plankton may be relatively unique in being able to respond to continuing ocean acidification without
5
causing fundamental ecosystem disruption.
5 Conclusions and perspectives
We conclude that the extraordinary diversity in calcification behavior and environmental sensitivity exhibited by the different ecotypes ofE. huxleyimake laboratory studies with mono-specific cultures prone to producing conflicting results. It is thus unclear how
10
well the observed responses can inform us about the net impact of higher CO2(lower pH) on diverse, natural assemblages in situ. Mesocosm experiments and shipboard manipulations carried out in a variety of oceanic regions are then vital if we are to improve our predictive capabilities of phytoplankton calcification and their role in the cycling of carbon in a future high-CO2world. However, laboratory studies will continue 15
to provide key information on the range of potential responses of different ecotypes and on the mechanisms by which the response to changes in CO2chemsitry occurs.
Drawing a parallel between the calcification response to ocean acidification and the “Eppley curve” for net ecosystem growth rate behavior with changing temperature is consistent with: monoclonal laboratory observations of preferential growth rate
sup-20
pression in more heavily calcified species (Iglesias-Rodriguez et al., 2008a), transi-tions from more to less heavily calcified morphotypes across saturation gradients in the ocean (Cubillos et al., 2007), and a greater net calcification response in natural plankton assemblages relative to mono-specific cultures (Ridgwell et al., 2007b). This leads us to a recommendation for the form of the parameterization to be used in future
25
BGD
6, 3455–3480, 2009From laboratory manipulations to earth system models
A. Ridgwell et al.
Title Page
Abstract Introduction
Conclusions References
Tables Figures
◭ ◮
◭ ◮
Back Close
Full Screen / Esc
Printer-friendly Version
Interactive Discussion
equation are currently insufficient. Better experimentally-based understanding of acid-ification impacts at both the organism and ecosystem level and how this translates to the global scale is essential for improvements to be made in model predictions of future fossil fuel CO2uptake.
Regardless of the form and sensitivity of the calcification parameterization, it should
5
be recognized that the direct impact of calcification changes on atmospheric CO2
through the remainder of this century is relatively small compared to anticipated an-nual emissions as well as to other carbon cycle feedbacks. For instance, yearly emis-sions of CO2from the burning of fossil fuels and cement production currently stands at
some 7.2 PgC yr−1 (IPCC, 2007) – this is of comparable magnitude to the entire
100-10
year integrated impact of reduced calcification of∼6–23 PgC. The predicted year 2100
repartitioning of CO2 from atmosphere to ocean due to reduced calcification is also
dwarfed by the anthropogenic CO2 inventories of the ocean and atmosphere, which
even in 1994 stood at 118 and 165 PgC, respectively, as well as by the importance of feedbacks such as between temperature and CO2solubility.
15
Acknowledgements. A. R. and D. S. acknowledge support from The Royal Society in the form of
University Research Fellowships. C. T. acknowledges funding from the NERC funded Oceans 2025 programme and the EU European Project on Ocean Acidification.
References
Armstrong, R. A., Lee, C., Hedges, J. I., Honjo, S., and Wakeham, S. G.: A new, mechanistic 20
model for organic carbon fluxes in the ocean: Based on the quantitative association of POC with ballast minerals, Deep Sea Res. Part II, 49, 219–236, 2002.
Aumont, O., Maier-Reimer, E., Blain, S., and P. Monfray, P.: An ecosystem model of the global ocean including Fe, Si, P colimitations, Global Biogeochem. Cy., 17(2), 1060, doi:10.1029/2001GB001745, 2003.
25
BGD
6, 3455–3480, 2009From laboratory manipulations to earth system models
A. Ridgwell et al.
Title Page
Abstract Introduction
Conclusions References
Tables Figures
◭ ◮
◭ ◮
Back Close
Full Screen / Esc
Printer-friendly Version
Interactive Discussion
Beaufort, L., Couapel, M. J. J., Buchet, N., Claustre, H., and Goyet, C.: Calcite production by coccolithophores in the south east pacific ocean, Biogeosciences 5, 1101–1117, 2008. Bissinger, J. E., Montagnes, D. J. S., Sharples, J., and Atkinson, D.: Predicting marine
phy-toplankton maximum growth rates from temperature: Improving on the Eppley curve using quantile regression, Limnol. Oceanogr., 53, 487–493, 2008.
5
Brand, L. E.: Genetic variability and spatial patterns of genetic differentiation in the reproductive rates of the marine coccolithophores Emiliania huxleyi and Gephyrocapsa oceanica, Limnol. Oceanogr., 27(2), 236–245, 1982.
Buitenhuis, E., de Baar, H., and Veldhuis, M.: Photosynthesis and calcification in Emiliania huxleyi as a function of inorganic carbon species, J. Phycol., 35, 949–959, 1999.
10
Cao, L., Eby, M., Ridgwell, A., Caldeira, K., Archer, D., Ishida, A., Joos, F., Matsumoto, K., Mikolajewicz, U., Mouchet, A., Orr, J. C., Plattner, G.-K., Schlitzer, R., Tokos, K., Totterdell, I., Tschumi, T., Yamanaka, Y., and Yool, A.: The role of ocean transport in the uptake of anthropogenic CO2, Biogeosciences, 6, 375–390, 2009,
http://www.biogeosciences.net/6/375/2009/. 15
Cubillos, J. C, Wright, S. W., Nash, G., de Salas, M. F., et al.: Calcification morphotypes of the coccolithophorid Emiliania huxleyi in the Southern Ocean: changes in 2001 to 2006 compared to historical data, Mar. Ecol. Progress Ser., 348, 47–54, 2007.
Delille, B., Harlay, J., Zondervan, I., et al.: Response of primary production and calcification to changes ofpCO2 during experimental blooms of the coccolithophorid Emiliania huxleyi, 20
Glob. Biogeochem. Cy., 19, GB2023, doi:10.1029/2004GB002318, 2005.
Dickson, A. G.: Standard potential of the reaction: AgCl(s)+1/2 H2(g)=Ag(s)+HCl(aq), and the standard acidity constant of the ion HSO4- in synthetic seawater from 273.15 to 318.15 K, J. Chemi. Thermodynam., 22,113–127, 1990.
Dickson, A. G. and Millero, F. J.: A comparison of the equilibrium constants for the dissociation 25
of carbonic acid in seawater media, Deep-Sea Res., 34, 1733–1743, 1987.
Engel, A., Zondervan, I., Aerts, K., Beaufort, L., et al.: Testing the direct effect of CO2 con-centration on a bloom of the coccolithophorid Emiliania huxleyi in mesocosm experiments, Limnol. Oceanogr., 50, 493–507, 2005.
Eppley, R. W.: Temperature and phytoplankton growth in the sea, Fish. Bull., 70, 1063–1085, 30
1972.
BGD
6, 3455–3480, 2009From laboratory manipulations to earth system models
A. Ridgwell et al.
Title Page
Abstract Introduction
Conclusions References
Tables Figures
◭ ◮
◭ ◮
Back Close
Full Screen / Esc
Printer-friendly Version
Interactive Discussion
Emiliania huxleyi(Prymnesiophyceae), European Journal of Phycology, 43, 87–98, 2008.
Francois, R., Honjo, S., Krishfield, R., and Manganini, S.: Factors controlling the flux of or-ganic carbon to the bathypelagic zone of the ocean, Global Biogeochem. Cy., 16, 1087, doi:10.1029/2001GB001722, 2002.
Gehlen, M., Bopp, L., Emprin, N., Aumont, O., Heinze, C., and Ragueneau, O.: Reconciling 5
surface ocean productivity, export fluxes and sediment composition in a global biogeochem-ical ocean model, Biogeosciences, 3, 521–537, 2006,
http://www.biogeosciences.net/3/521/2006/.
Gehlen, M., Gangstø, R., Schneider, B., Bopp, L., Aumont, O., and Ethe, C.: The fate of pelagic CaCO3production in a high CO2ocean: a model study, Biogeosciences, 4, 505–519, 2007, 10
http://www.biogeosciences.net/4/505/2007/.
Heinze, C.: Simulating oceanic CaCO3 export production in the greenhouse, Geophys. Res. Lett., 13, L16308, doi:10.1029/2004GL020613, 2004.
Hofmann, M., and Schellnhuber, H.-J.: Oceanic acidification affects marine carbon pump and triggers extended marine oxygen holes, PNAS, 106, 3017–3022, 2009.
15
Iglesias-Rodr´ıguez, M. D., Schofield, O., Batley, J., Medlin, L. K. and Hayes, P. K.: Intraspecific genetic diversity in the marine coccolithophore Emiliania huxleyi (Prymnesiophyceae): the use of microsatellite analysis in marine phytoplankton population studies, J. Phycol., 42, 526–536, 2006.
Iglesias-Rodriguez, , Halloran, P. R., Rickaby, R. E. M., Hall, I. R., et al.: Phytoplankton calcifi-20
cation in a high-CO2world, Science, 320, 336–340, 2008a.
Iglesias-Rodriguez, M. D., Buitenhuis, E. T., Raven, J. A., Schofield, O., et al.: Response to Comment on “Phytoplankton Calcification in a High-CO2 World”, Science, 322, 1466c, doi:10.1126/sciences.1161501, 2008b.
IPCC: Climate Change 2007: The Physical Science Basis. Contribution of Working Group I to 25
the Fourth Assessment Report of the Intergovernmental Panel on Climate Change, edited by: Solomon, S., Qin, D., Manning, M., Chen, Z., Marquis, M., Averyt, K. B., Tignor, M., and Miller, H. L., Cambridge University Press, Cambridge, United Kingdom and New York, NY, USA, 2007.
Klaas, C., and Archer, D. E.: Association of sinking organic matter with various types of mineral 30
ballast in the deep sea: Implications for the rain ratio, Global Biogeochem. Cycles, 16, 1116, doi:10.1029/2001GB001765, 2002.
BGD
6, 3455–3480, 2009From laboratory manipulations to earth system models
A. Ridgwell et al.
Title Page
Abstract Introduction
Conclusions References
Tables Figures
◭ ◮
◭ ◮
Back Close
Full Screen / Esc
Printer-friendly Version
Interactive Discussion
Species-specific responses of calcifying algae to changing seawater carbonate chemistry, Geochem. Geophys. Geosyst., 7, Q09006, doi:10.1029/2005GC001227, 2006.
Lewis, E. and Wallace, D. W. R.: Program Developed for CO2 System Calculations.
ORNL/CDIAC-105. Carbon Dioxide Information Analysis Center, Oak Ridge National Lab-oratory, US Department of Energy, Oak Ridge, Tennessee, 1998.
5
Mehrbach, C., Culberson, C. H., Hawley, J. E., and Pytkowicz, R. M.: Measurement of the ap-parent dissociation constants of carbonic acid in seawater at atmospheric pressure, Limnol. Oceanogr., 18, 897–907, 1973.
Moisan, J. R., Moisan, T. A., and Abbott, M. R.: Modelling the effect of temperature on the maximum growth rates of phytoplankton populations, Ecol. Model., 153, 197–215, 2002. 10
Nimer, N. A. and Merrett, M. J.: Calcification rate in Emiliania huxleyi Lohmann in response to light, nitrate and availability of inorganic carbon, New Phytologist, 123, 673–677, 1993. Paasche, E.: A Review of the Coccolithophorid Emiliania huxleyi (Prymnesiophyceae), with
Particular Reference to Growth, Coccolith Formation, and Calcification – Photosynthesis Interactions, Phycologia, 40, 503–529, 2002.
15
Passow, U. and De La Rocha, C. L.: Accumulation of mineral ballast on organic aggregates, Global Biogeochem. Cy., 20, GB1013, doi:10.1029/2005GB002579, 2006.
Ridgwell, A., Hargreaves, J. C., Edwards, N. R., Annan, J. D., Lenton, T. M., Marsh, R., Yool, A., and Watson, A.: Marine geochemical data assimilation in an efficient Earth System Model of global biogeochemical cycling, Biogeosciences, 4, 87–104, 2007a,
20
http://www.biogeosciences.net/4/87/2007/.
Ridgwell, A., Zondervan, I., Hargreaves, J. C., Bijma, J., and Lenton, T. M.: Assessing the potential long-term increase of oceanic fossil fuel CO2uptake due to CO2-calcification feed-back, Biogeosciences, 4, 481–492, 2007b,
http://www.biogeosciences.net/4/481/2007/. 25
Riebesell, U., Zondervan, I., Rost, B., Tortell, P. D., Zeebe, R. E., Morel, F. M. M.: Reduced calcification of marine plankton in response to increased atmospheric CO2, Nature, 407, 364–367, 2000.
Riebesell, U., Bellerby, R. G. J., Engel, A., Fabry, V. J., et al.: Comment on “Phytoplankton Cal-cification in a High-CO2World”, Science, 322, 1466b, doi:10.1126/science.1161096, 2008b. 30
BGD
6, 3455–3480, 2009From laboratory manipulations to earth system models
A. Ridgwell et al.
Title Page
Abstract Introduction
Conclusions References
Tables Figures
◭ ◮
◭ ◮
Back Close
Full Screen / Esc
Printer-friendly Version
Interactive Discussion
doi:10.1029/2007GB002953, 2008.
Schroeder, D. C. and Biggi, G. F. and Hall, M. and Davy, J. and Martinez, J. M. and Richardson, A. J. and Malin, G., and Wilson, W. H.: A genetic marker to separate Emiliania huxleyi (Prymnesiophyceae) morphotypes, J. Phycol., 41, 874–879, 2005.
Sciandra, A., Harlay, J., Lef `evre, D., Lem ´ee, R., Rimmelin, P., Denis, M., and Gattuso, J. P.: 5
Response of coccolithophorid Emiliania huxleyi to elevated partial pressure of CO2 under nitrogen limitation, Mar. Ecol. Prog. Ser., 261, 111–122, 2003.
Shi, D., Xu, Y., and Morel, F. M. M.: Effects of the pH/pCO2 control method in the growth medium of phytoplankton, Biogeosciences Discuss., 6, 2415–2439, 2009,
http://www.biogeosciences-discuss.net/6/2415/2009/. 10
Six, K. D. and MaierReimer, E., Effects of plankton dynamics on seasonal carbon fluxes in an ocean general circulation model, Global Biogeochem. Cy., 10, 559–583, 1996.
Turley, C. M. and Mackie, P. J.: Biogeochemical significance of attached and free-living bacteria and the flux of particles in the NE Atlantic, Mar. Ecol. Prog. Ser., 115, 191–203, 1994. Tyrrell, T., Schneider, B., Charalampopoulou, A., and Riebesell, U.: Coccolithophores and cal-15
cite saturation state in the Baltic and Black seas, Biogeosciences, 5, 485-494, 2008, http://www.biogeosciences.net/5/485/2008/.
Wolf-Gladrow, D. A., Riebesell, U., Burkhardt, S., and Bijma, J.: Direct effects of CO2 con-centration on growth and isotopic composition of marine plankton, Tellus B. Chem. Phys. Meterol., 51, 461–476, 1999.
20
Young, J. R., Geisen, M., Cros, L., Kleijne, A., Probert, I., and Ostergaard, J. B.: A guide to extant coccolithophore taxonomy, J. Nannoplankton Res., 1, 1–132, 2003.
Young, J. R. and Westbroek, P.: Genotypic variation in the coccolithophorid species Emiliania huxleyi, Mar. Micropaleontology, 18, 5–23, 1991.
Zondervan, I., Zeebe, R. E., Rost, B., and Riebesell, U.: Decreasing Marine Biogenic Calci-25
fication: A Negative Feedback on Rising AtmosphericpCO2, Global Biogeochem. Cy., 15, 507–516, 2001.
Zondervan, I., Rost, B., and Riebesell, U.: Effect of CO2 concentration on the PIC/POC ratio in the coccolithophore Emiliania huxleyi grown under light-limiting conditions and different daylengths, J. Exp. Mar. Biol. Ecol., 272, 55–70 2002.
BGD
6, 3455–3480, 2009From laboratory manipulations to earth system models
A. Ridgwell et al.
Title Page Abstract Introduction Conclusions References Tables Figures ◭ ◮ ◭ ◮ Back Close
Full Screen / Esc
Printer-friendly Version
Interactive Discussion
Table 1.Synthesis of available coccolithophorid calcification carbonate chemistry manipulation experiments. Species Strain (Clone) Isolation date and location Experimental design Ambient light environmenta Carbonate chemistry manipulation Calcification responseb Calcification responsec Referencej Emiliania huxleyi NZEH (CAWPO6) 1992 South Pacific laboratory culture
12:12 h L:D
150µμmol m−2s−1 CO2bubbling ↑ ↑
μ ↑ ↑
μ ↓
μ ↓
μ ↔ ↓
μ ↓ ↓
μ ↓
μ ↔
μ ↔
μ ↑ ↑
μ ↓ μ ↓ μ ↔ ↓ ↓ ↓
μ ↑ ↑
μ ↑ ↑
μ ↓
μ ↓
μ ↔ ↓
μ ↓ ↓
μ ↓
μ ↔
μ ↔
μ ↑ ↑
μ ↓ μ ↓ μ ↔ ↓ ↓ ↓ 1 Emiliania huxleyi
MBA 61/12/4 1991 North Atlantic
laboratory culture
12:12 h L:D 150µmol m−2s−1
CO2bubbling
μ ↑ ↑
μ ↑ ↑
μ ↓
μ ↓
μ ↔ ↓
μ ↓ ↓
μ ↓
μ ↔
μ ↔
μ ↑ ↑
μ ↓ μ ↓ μ ↔ ↓ ↓ ↓
μ ↑ ↑
μ ↑ ↑
μ ↓
μ ↓
μ ↔ ↓
μ ↓ ↓
μ ↓
μ ↔
μ ↔
μ ↑ ↑
μ ↓ μ ↓ μ ↔ ↓ ↓ ↓ 1 Emiliania huxleyi PML B92/11A 1992 North Sea laboratory culture
18:6 h L:D
150µmol m−2s−1 acid/base n/a
μ ↑ ↑
μ ↑ ↑
μ ↓
μ ↓
μ ↔ ↓
μ ↓ ↓
μ ↓
μ ↔
μ ↔
μ ↑ ↑
μ ↓ μ ↓ μ ↔ ↓ ↓ ↓ 2,5 Emiliania huxleyi PML B92/11A 1992 North Sea laboratory culture
24:0 h L:D 150µmol m−2s−1
acid/base n/a
μ
↑
↑μ ↑ ↑
μ ↓
μ ↓
μ ↔ ↓
μ ↓ ↓
μ ↓
μ ↔
μ ↔
μ ↑ ↑
μ ↓ μ ↓ μ ↔ ↓
↓
↓ 2,5 Emiliania huxleyiCCMP 371 1987 Sargasso Sea
laboratory culture
12:12 h L:D 50µmol m−2s−1
CO2bubbling
μ ↑ ↑
μ ↑ ↑
μ ↓
μ ↓
μ g ↔ ↓
μ ↓ ↓
μ ↓
μ ↔
μ ↔
μ ↑ ↑
μ ↓ μ ↓ μ ↔ ↓ ↓ ↓
μ ↑ ↑
μ ↑ ↑
μ ↓
μ ↓
μ ↔ ↓
μ ↓ ↓
μ ↓
μ ↔
μ ↔
μ ↑ ↑
μ ↓ μ ↓ μ ↔ ↓ ↓ ↓ 3 Emiliania huxleyi
CCMP 371 1987 Sargasso Sea
laboratory culture
12:12 h L:D
400µmol m−2s−1 CO2bubbling
μ
↑
↑
μ
↑
↑
μ
↓μ
↓
μ
↔
↓μ
↓
↓
μ
↓
μ
↔
μ
↔
μ
↑↑
μ
↓
μ
↓
μ
↔
↓
↓
↓
μ
↑
↑μ ↑ ↑
μ ↓
μ ↓
μ ↔ ↓
μ ↓ ↓
μ ↓
μ ↔
μ ↔
μ ↑ ↑
μ ↓ μ ↓ μ ↔ ↓
↓
↓ 3 Emiliania huxleyi TW1 2001 W Mediterranean laboratory culture24:0 h L:D 570µmol m−2s−1
CO2bubbling n/a
μ
↑
↑
μ
↑
↑
μ
↓μ
↓
μ
↔
↓μ
↓
↓
μ
↓
μ
↔
μ
↔
μ
↑↑
μ
↓
μ
↓
μ
↔
↓
↓
↓
4 Emiliania huxleyi 88E 1988 Gulf of Mainelaboratory culture
24:0 h L:D 50µmol m−2s−1
acid/base n/a
μ ↑ ↑
μ ↑ ↑
μ ↓
μ ↓
μ g ↔ ↓
μ ↓ ↓
μ ↓
μ ↔
μ ↔
μ ↑ ↑
μ ↓ μ ↓ μ ↔ ↓ ↓ ↓ d 9 Emiliania huxleyi
Ch 24-90 1991 North Sea
laboratory culture
16:8 h L:D 300µmol m−2s−1
CO2bubbling n/a
μ ↑ ↑
μ ↑ ↑
μ ↓
μ ↓
μ g ↔ ↓
μ ↓ ↓
μ ↓
μ ↔
μ ↔
μ ↑ ↑
μ ↓ μ ↓ μ ↔ ↓ ↓ ↓ e 10 Emiliania huxleyi NZEH (PLY M219) 1992 South Pacific laboratory culture
24:0 h L:D
150µmol m−2s−1 acid/base
μ ↑ ↑
μ ↑ ↑
μ ↓
μ ↓
μ ↔ ↓
μ ↓ ↓
μ ↓
μ ↔
μ ↔
μ ↑ ↑
μ ↓ μ ↓ μ ↔ ↓ ↓ ↓
μ ↑ ↑
μ ↑ ↑
μ ↓
μ ↓
μ ↔ ↓
μ ↓ ↓
μ ↓
μ ↔
μ ↔
μ ↑ ↑
μ ↓ μ ↓ μ ↔ ↓ ↓ ↓ 11 Gephyrocapsa oceanica PC7/1 1998 Portuguese shelf laboratory culture
18:6 h L:D 150µmol m−2s−1
acid/base n/a
μ
↑
↑
μ
↑
↑
μ
↓μ
↓
μ
↔
↓μ
↓
↓
μ
↓
μ
↔
μ
↔
μ
↑↑
μ
↓
μ
↓
μ
↔
↓
↓
↓
2,5 Calcidiscus leptoporus AC365 2000 South Atlantic laboratory culture16:8 h L:D
350µmol m−2s−1 acid/base n/a
μ
↑
↑μ ↑ ↑
μ ↓
μ ↓
μ ↔ ↓
μ ↓ ↓
μ ↓
μ ↔
μ ↔
μ ↑ ↑
μ ↓ μ ↓ μ ↔ ↓
↓
↓ f 6 Coccolithus pelagicus AC400 2000 South Atlantic laboratory culture16:8 h L:D
350µmol m−2s−1 acid/base n/a
μ ↑ ↑
μ ↑ ↑
μ ↓
μ ↓
μ g ↔ ↓
μ ↓ ↓
μ ↓
μ ↔
μ ↔
μ ↑ ↑
BGD
6, 3455–3480, 2009From laboratory manipulations to earth system models
A. Ridgwell et al.
Title Page Abstract Introduction Conclusions References Tables Figures ◭ ◮ ◭ ◮ Back Close
Full Screen / Esc
Printer-friendly Version
Interactive Discussion
Table 1.Continued.
Species Strain (Clone) Isolation date and location Experimental design
Ambient light en-vironmenta Carbonate chemistry manipulation Calcification responseb Calcification responsec Referencej Emiliania huxleyig n/a n/a (North Sea)
mesocosmh 95% of ambient surface irradiance
CO2bubbling n/a
μ
↑
↑μ ↑ ↑
μ ↓
μ ↓
μ ↔ ↓
μ ↓ ↓
μ ↓
μ ↔
μ ↔
μ ↑ ↑
μ ↓ μ ↓ μ ↔ ↓
↓
↓ i 7,8 subarctic North Pacific natural assemblages n/a n/a (N. Pacific) ship-board incubation30% of ambient surface irradiance
CO2bubbling n/a
μ
↑
↑
μ
↑
↑
μ
↓μ
↓
μ
↔
↓μ
↓
↓
μ
↓
μ
↔
μ
↔
μ
↑↑
μ
↓
μ
↓
μ
↔
↓
↓
↓
i 2 subarctic North Pacific natural assemblages n/a n/a (N. Pacific) ship-board incubation30% of ambient surface irradiance
acid/base n/a
μ
↑
↑μ ↑ ↑
μ ↓
μ ↓
μ ↔ ↓
μ ↓ ↓
μ ↓
μ ↔
μ ↔
μ ↑ ↑
μ ↓ μ ↓ μ ↔ ↓
↓
↓ i 2aLight:dark irradiance cycle in hours light vs. dark per 24 h cycle; irradiance as the photon flux density associated with
the ‘light’ period. bSign of the calcification response of plankton at elevated (∼×2 to×3) compared to modern CO2. The size of the arrow indicates the sensitivity of calcification response in a simple: “very low” (
μ ↑ ↑
μ ↑ ↑
μ ↓
μ ↓
μ ↔ ↓
μ ↓ ↓
μ ↓
μ ↔
μ ↔
μ ↑ ↑
μ ↓ μ ↓ μ ↔ ↓ ↓ ↓ ), “low” (
μ
↑
↑μ ↑ ↑
μ ↓
μ ↓
μ
↔
↓μ
↓
↓μ ↓
μ
↔
μ
↔
μ ↑ ↑
μ
↓
μ ↓ μ↔
↓
↓
↓
), “medium” (
μ
↑
↑μ ↑ ↑
μ ↓
μ ↓
μ
↔
↓μ
↓
↓μ ↓
μ
↔
μ
↔
μ ↑ ↑
μ
↓
μ ↓ μ↔
↓
↓
↓
), “high” (μ
↑
↑
μ
↑
↑
μ
↓μ
↓
μ
↔
↓μ
↓
↓
μ
↓
μ
↔
μ
↔
μ
↑↑
μ
↓
μ
↓
μ
↔
↓
↓
↓
) classification, with “medium” representing an approximate halving (or doubling) of calcification in resposne to a ca.×2–3 increase in CO2. Red represents a decrease in calcification in response to higher CO2(lower pH), while
blue (
μ
↑
↑μ ↑ ↑
μ ↓
μ ↓
μ
↔
↓μ
↓
↓μ ↓
μ
↔
μ
↔
μ ↑ ↑
μ
↓
μ ↓ μ↔
↓
↓
↓
) is a calcification increase. Green (
μ ↑ ↑
μ ↑ ↑
μ ↓
μ ↓
μ g ↔ ↓
μ ↓ ↓
μ ↓
μ ↔
μ ↔
μ ↑ ↑
μ ↓ μ ↓ μ ↔ ↓ ↓ ↓
) is no significant change. The calcification change is calculated from observations reported in units of mol (or g) of CaCO3(or C) per cell.cAsb, except change in calcification in units of mol (or g) of CaCO3(or C) per cell per day (or hour). The difference betweenbandcreflects any change in growth rate (µ, d−1) at elevated CO
2.d“Optimum” CO2-calcification response curve with no consistent trend with CO2. Experimental
carbonate chemistry modification was qualitatively very different from the effect of increased CO2alone and some treatments had very low DIC, questioning its applicability to future conditions in the ocean.eResults of the constant alkalinity experiment, which was the only manipulation similar to the effect of future CO2addition. However, alkalinity used (1214µ·eq l−1) was only about half that found in the modern open ocean, questioning its applicability.f“Optimum”
CO2-calcification response curve – no consistent trend with CO2, but reduced calcification at 800–900 ppm compared to modern CO2. gEmiliania huxleyiwas the dominant (calcifying) plankton species in the induced mesocosm bloom.
hEnclosed body of seawater in each mesocosm was approximately 11 000 L volume. iReported as an integrated
production rate in units of mol (or g) carbon per unit volume per unit time. jReferences: (1) Iglesias-Rodriguez et al. (2008), (2) Riebesell et al. (2000), (3) Feng et al. (2008), (4) Sciandra et al. (2003), (5) Zondervan et al. (2001), (6) Langer et al. (2006), (7) Delille et al. (2005), (8) Engel et al. (2005), (9) Nimer and Merrett (1993), (10) Buitenhuis et al. (1999), (11) Shi et al. (2009).
BGD
6, 3455–3480, 2009From laboratory manipulations to earth system models
A. Ridgwell et al.
Title Page Abstract Introduction Conclusions References Tables Figures ◭ ◮ ◭ ◮ Back Close
Full Screen / Esc
Printer-friendly Version
Interactive Discussion
Table 2. Behaviour of carbonate parameters in response to CO2bubbling vs. acid/base ma-nipulation. Numbers inboldassume a CO2 bubbling like change, i.e., ALK is held constant andpCO2 adjusted. Numbers in normal text assume ALK is changed in order to match the
pH change. Numbers initalics assume ALK is changed in order to match thepCO2change.
The carbonate chemistry starting point (278 ppm) is shaded in grey. Calculations assume a temperature of 20◦C and salinity of 35 PSU and atmospheric pressure (0 m water depth),
and 0µmol kg−1
(PO3−
4 ) and (H4SiO4), and were made using the “CO2SYS” program (Lewis
and Wallace, 1998), with K1 and K2 from Mehrbach et al. (1973) as refit by Dickson and Millero (1987) andKSO
4 from Dickson (1990).
TargetpCO2
(µatm)
DIC
(µmol kg−1) ALK(µmol kg−1) (CO2(aq))
(µmol kg−1)
(HCO−
3)
(µmol kg−1)
(CO2−
3 )
(µmol kg−1)
pH(SW S) Ω(calcite)
BGD
6, 3455–3480, 2009From laboratory manipulations to earth system models
A. Ridgwell et al.
Title Page Abstract Introduction Conclusions References Tables Figures ◭ ◮ ◭ ◮ Back Close
Full Screen / Esc
Printer-friendly Version Interactive Discussion 0 Y e a r 2 1 0 0 D C O (Pg C ) 2 10 20 30 G e h le n e t a l. [2 0 0 7 ] H e in ze [2 0 0 4 ] R id g w e ll e t a l. [2 0 0 7 b ] O n e y e a r o f c u rr e n t fo s s il fu e l C O e m is s io n s 2 H o fm a n n a n d Sc h e ll n h u b e r [2 0 0 9 ] 40 C li m a te -C O fe e d b a c k 2
Fig. 1.Predicted strength of the CO2-calcification feedback.
BGD
6, 3455–3480, 2009From laboratory manipulations to earth system models
A. Ridgwell et al.
Title Page
Abstract Introduction
Conclusions References
Tables Figures
◭ ◮
◭ ◮
Back Close
Full Screen / Esc
Printer-friendly Version
Interactive Discussion
BGD
6, 3455–3480, 2009From laboratory manipulations to earth system models
A. Ridgwell et al.
Title Page
Abstract Introduction
Conclusions References
Tables Figures
◭ ◮
◭ ◮
Back Close
Full Screen / Esc
Printer-friendly Version
Interactive Discussion Temperature
G
ro
w
th
ra
te
,
m
(
)
-1
d
in
iti
a
l
e
n
v
ir
o
n
m
e
n
ta
l
c
o
n
d
iti
o
n
s
warm water species
decreasing (calcification) rate
growth increasing (calcification) rate
growth
‘ optimum’
Upper growth limit
Maximum lethal temperature Lower
growth limit
cold water species
heavily calcified species (or ecotype)
lightly calcified species (or ecotype)
[CO2(aq)]
pH, saturation state
-1
C
a
lci
fi
ca
ti
o
n
ra
te
(g
(ce
ll
)
)
-1
d
BGD
6, 3455–3480, 2009From laboratory manipulations to earth system models
A. Ridgwell et al.
Title Page
Abstract Introduction
Conclusions References
Tables Figures
◭ ◮
◭ ◮
Back Close
Full Screen / Esc
Printer-friendly Version
Interactive Discussion
G
ro
w
th
ra
te
,
m
(d
o
u
b
lin
g
s
p
e
r
d
a
y)
0 2
Detonula confervacea
Chlorella pyrenoidosa
Skeletonema costatum
Dunaliella tertiolecta
Ditylum brightwellii
4 6 8 10
Temperature, T (°C)
0 10 20 30 40 50
[CO2(aq)]
pH, saturation state
-1
C
a
lci
fi
ca
ti
o
n
ra
te
(g
(ce
ll
)
)
-1
d