www.biogeosciences.net/11/3531/2014/ doi:10.5194/bg-11-3531-2014
© Author(s) 2014. CC Attribution 3.0 License.
High temperature decreases the PIC / POC ratio and increases
phosphorus requirements in
Coccolithus pelagicus
(Haptophyta)
A. C. Gerecht1, L. Šupraha2, B. Edvardsen3, I. Probert4, and J. Henderiks1,2
1CEES, Dept. of Biosciences, University of Oslo, P.O. Box 1066 Blindern, 0316 Oslo, Norway 2Dept. of Earth Sciences, Palaeobiology, Villavägen 16, 75236 Uppsala, Sweden
3Marine Biology, Dept. of Biosciences, University of Oslo, P.O. Box 1066 Blindern, 0316 Oslo, Norway 4UPMC, CNRS, Biological Station Roscoff, Place Georges Teissier, 29680 Roscoff, France
Correspondence to:A. C. Gerecht ([email protected])
Received: 22 November 2013 – Published in Biogeosciences Discuss.: 16 January 2014 Revised: 11 April 2014 – Accepted: 15 May 2014 – Published: 3 July 2014
Abstract. Rising ocean temperatures will likely increase stratification of the water column and reduce nutrient input into the photic zone. This will increase the likelihood of nu-trient limitation in marine microalgae, leading to changes in the abundance and composition of phytoplankton com-munities, which in turn will affect global biogeochemical cycles. Calcifying algae, such as coccolithophores, influ-ence the carbon cycle by fixing CO2into particulate organic carbon through photosynthesis (POC production) and into particulate inorganic carbon through calcification (PIC pro-duction). As calcification produces a net release of CO2, the ratio of PIC to POC production determines whether coccolithophores act as a source (high PIC / POC) or a sink (low PIC / POC) of atmospheric CO2. We studied the effect of phosphorus (P-) limitation and high temperature on the physiology and the PIC / POC ratio of two subspecies of Coc-colithus pelagicus. This large and heavily calcified species is a major contributor to calcite export from the photic zone into deep-sea reservoirs. Phosphorus limitation did not influence exponential growth rates in either subspecies, but P-limited cells had significantly lower cellular P-content. One of the subspecies was subjected to a 5◦
C temperature increase from 10◦
C to 15◦
C, which did not affect exponential growth rates either, but nearly doubled cellular P-content under both high and low phosphate availability. This temperature in-crease reduced the PIC / POC ratio by 40–60 %, whereas the PIC / POC ratio did not differ between P-limited and nutrient-replete cultures when the subspecies were grown near their respective isolation temperature. Both P-limitation and ele-vated temperature significantly increased coccolith
malfor-mations. Our results suggest that a temperature increase may intensify P-limitation due to a higher P-requirement to main-tain growth and POC production rates, possibly reducing abundances in a warmer ocean. Under such a scenarioC. pelagicusmay decrease its calcification rate relative to pho-tosynthesis, thus favouring CO2sequestration over release. It seems unlikely that P-limitation by itself causes changes in the PIC / POC ratio in this species.
1 Introduction
as a measure for carbon export into sedimentary reservoirs (Archer, 1991; Ridgwell et al., 2009). To accurately model the effect of a changing climate on ocean–atmosphere CO2 exchange, it is important to constrain the PIC / POC produc-tion ratio of coccolithophores.
Various environmental factors affect POC and PIC produc-tion in coccolithophores. Elevated CO2may increase photo-synthesis (Beardall and Raven, 2004) whereas calcification is generally reduced at higher CO2concentrations (Riebesell et al., 2000; Feng et al., 2008; Findlay et al., 2011; Krug et al., 2011). Rising ocean temperatures may directly impact POC and PIC production in coccolithophores (Paasche, 2002) and increase the likelihood of nutrient limitation via a more strat-ified water column (Sarmiento et al., 2004). In some cases, nutrient limitation has been shown to increase the ratio of PIC to POC production in the cosmopolitan species Emilia-nia huxleyi(Paasche and Brubak, 1994; Paasche, 1998; Rieg-man et al., 2000). In these studies, POC production rates de-creased due to decreasing nutrient availability whereas PIC production rates remained unaffected, leading to an increase in the ratio of PIC to POC. In the field, the increased ratio of loose coccoliths to coccospheres has also been ascribed to decreasing nutrient availability (Balch et al., 1991; Fer-nández et al., 1993; van der Wal et al., 1995) and mesocosm studies have shown that calcification continues after POC fix-ation ceases due to nutrient exhaustion (van Bleijswijk et al., 1994). On the other hand, several other studies on E. hux-leyihave reported stable PIC / POC ratios due to a decrease in both POC and PIC production rates with decreasing nutri-ent availability (e.g. Fritz, 1999; Borchard et al., 2011) and a decrease in the PIC / POC ratio under nutrient limitation has also been reported (Langer et al., 2013a). A recent study by Langer et al. (2012) examined the effect of P- and nitrogen (N-) limitation on the PIC / POC ratio ofCalcidiscus lepto-porusand showed this ratio to be insensitive to limitation by these macronutrients. Given the species- and strain-specific response to ocean acidification (Langer et al., 2006, 2009; Krug et al., 2011), it is not surprising that the response to macronutrient limitation is not uniform among strains and species. The response may also depend on the experimental method, i.e. batch vs. (semi-) continuous cultures (Langer et al., 2013a). In addition, only a few species have been studied to date. It is therefore necessary to examine more species and lineages of coccolithophores to gain a more general view of the possible responses of coccolithophores to changing nu-trient availability.
Coccolithus pelagicus (Wallich) Schiller, 1930 is one of the largest and most heavily calcified extant coccolithophores with a PIC / POC ratio of generally >1.5 (Langer et al., 2006; Krug et al., 2011). The calcite weights of individual coccoliths are at least two orders of magnitude higher than the average weight of coccoliths produced by the smaller E. huxleyi(Beaufort and Heussner, 1999; Young and Ziveri, 2000; Cubillos et al., 2012). Hence, this species is an impor-tant contributor to calcite export into the sediments (Broerse
et al., 2000).Coccolithus pelagicusis divided into at least two morphotypes on the basis of heterococcolith size and distribution (Geisen et al., 2002; Sáez et al., 2003). Although genetic information suggests that they are separated at the species level (Sáez et al., 2003), we here use the division of the two morphotypes into subspecies, C. pelagicus subsp. braarudii (Gaarder) Geisen et al., 2002 and C. pelagicus subsp. pelagicus, according to Geisen et al. (2002) as the genetic and morphological differentiations are slight (Jordan et al., 2004). The subarctic morphotypeC. pelagicussubsp. pelagicuscan form substantial blooms in the North Atlantic and North Pacific regions (e.g. Winter et al., 1994; Ziveri et al., 2004), while the temperate morphotypeC. pelagicus subsp.braarudiiis common in coastal upwelling regions of the Northeast and Southeast Atlantic (e.g. Cachão and Moita, 2000; Henderiks et al., 2012).
We investigated the combined effect of P-limitation and elevated temperature on the physiology, elemental quotas, and the PIC / POC ratio of this species. One strain of each subspecies was grown in batch culture under P-limited and nutrient-replete conditions to test for physiological differ-ences between the two subspecies. Subspeciespelagicuswas grown in P-limited and nutrient-replete batch culture at two temperatures to test the effect of a temperature increase. Cal-cification was evaluated by the PIC quota of cells, individual coccolith volumes and the occurrence of coccolith malforma-tions. Whereas altered carbonate chemistry has been shown to increase the malformation of coccoliths (e.g. Langer et al., 2006, 2011; Rickaby et al., 2010), Langer et al. (2012) con-cluded that nutrient limitation does not significantly affect coccolith morphology. Particulate organic carbon production was monitored by growth rate and the POC quota of the cells.
2 Methods
2.1 Experimental design
Two strains ofC. pelagicus were obtained from the Roscoff Culture Collection. Strain RCC1200 is a clone ofC. pelag-icussubsp.braarudii and was isolated from the South At-lantic offshore Namibia. Strain RCC3776 is a clone of C. pelagicus subsp. pelagicus and was isolated from the North Atlantic near Scotland. Clonal batch cultures were grown in triplicate in sterile-filtered modified K/2 medium (Keller et al., 1987; with the following modifications: omis-sion of Tris and Si, addition of NiCl2×6H2O (3.14 nM),
experiment. Each subspecies was cultured near its respective isolation temperature, subsp.braarudii at 15◦C and subsp. pelagicus at 10◦C. The latter was also subjected to high-P and low-P treatments at elevated temperature (15◦
C). Cells were acclimated to experimental light and tempera-ture conditions for at least 10 generations before starting the experiments. Cultures were kept in culture flasks (350 mL, BD Biosciences, USA) in an environmental test chamber (MLR-350, Panasonic, Japan) on a 12:12 h light : dark cy-cle at an irradiance of ca. 100 µmol photons m−2s−1. Cul-ture flasks were agitated manually on a daily basis. Two experiments of paired high-P and low-P treatments (main and additional experiments; see Tables 1–3) were carried out for subsp. braarudii(15◦C) and subsp. pelagicus (10◦C). Each high-P and low-P treatment consisted of three repli-cate cultures. Additionally, one paired high-P and low-P ex-periment was performed in triplicate with subsp. pelagicus at 15◦C. Cell densities were determined daily on an elec-tronic particle counter (CASY, Roche Diagnostics, Switzer-land) 2 hours after the onset of the light phase. Exponen-tial growth rates (µmax) were calculated by linear regres-sion of log-transformed cell densities in exponential phase over time. Low-P cultures were sampled upon reaching sta-tionary phase (on the day that cell densities had increased not more than 5 % compared to the previous day). High-P cultures were sampled at similar cell densities while still in exponential phase to ensure similar carbonate chemistry be-tween the treatments.
High-P and low-P culture media were sampled for ini-tial chemistry (T0, Table 1). Upon sampling the cultures,
the growth media were again sampled to analyse carbonate chemistry parameters and residual phosphate concentrations at the time of sampling (Tsample, Table 1). Culture samples were collected for elemental analysis (particulate organic phosphorus (POP), particulate nitrogen (PN), POC, and to-tal particulate carbon (TPC)), for morphological analysis of coccoliths by polarized light (POL), and for measuring coc-cosphere diameters, coccolith coverage and coccolith mal-formations by scanning electron microscopy (SEM).
2.2 Medium chemistry
2.2.1 Residual phosphate
Culture media were sterile filtered (0.2 µm) into plastic scin-tillation vials (Kartell, Germany) and stored at−20◦C
un-til analysis. Orthophosphate concentrations were determined colorimetrically on a spectrophotometer (UV 2550, Shi-madzu, Japan) as molybdate reactive phosphate following Murphy and Riley (1962) with a precision of±4 %. Residual
phosphate concentrations near or below the detection limit (ca. 0.05 µM) confirmed that low-P cultures had taken up all available phosphate from the medium by the time of sam-pling (Tsample, Table 1), whereas phosphate concentrations of high-P cultures remained>6.4 µM.
2.2.2 Carbonate chemistry
Samples for total alkalinity (AT) and pH were filtered through GF/F filters (Whatman, GE Healthcare, UK), stored airtight at 4◦
C and analysed within 24 h. Total alkalinity was calculated from Gran plots (Gran, 1952) after dupli-cate potentiometric titration using an automatic titrator (TTA 80 Titration assembly, Radiometer, Denmark) or manual titration with a precision of ±50 µmol kg−1. The pH was
measured with a combined electrode (Red Rod, Radiome-ter) which was two-point calibrated to NBS scale (preci-sion±0.4 %). The carbonate system was calculated using the
program CO2sys (version 2.1 developed for MS Excel by D. Pierrot from E. Lewis and D. W. R. Wallace) using the dissociation constants for carbonic acid of Roy et al. (1993).
2.3 Elemental quotas and ratios
2.3.1 Particulate organic phosphorus
Samples for POP were filtered onto precombusted (500◦ C, 2 h) GF/C filters (Whatman) and stored at −20◦C.
Par-ticulate organic phosphorus was converted to orthophos-phate by oxidative hydrolysis with potassium persulfate un-der high pressure and temperature in an autoclave (3150EL, Tuttnauer, Netherlands) according to Menzel and Cor-win (1965). This was then quantified as molybdate reactive phosphate as described in Sect. 2.2.1.
2.3.2 Particulate total and organic carbon and nitrogen
Samples for TPC, POC and PN were filtered onto precom-busted GF/C filters, dried at 60◦
C overnight in a drying oven and stored in a desiccator until analysis on an elemental anal-yser (Flash 1112, Thermo Finnigan, USA; detection limit 2 µg) with a precision of±8 %. Particulate inorganic carbon
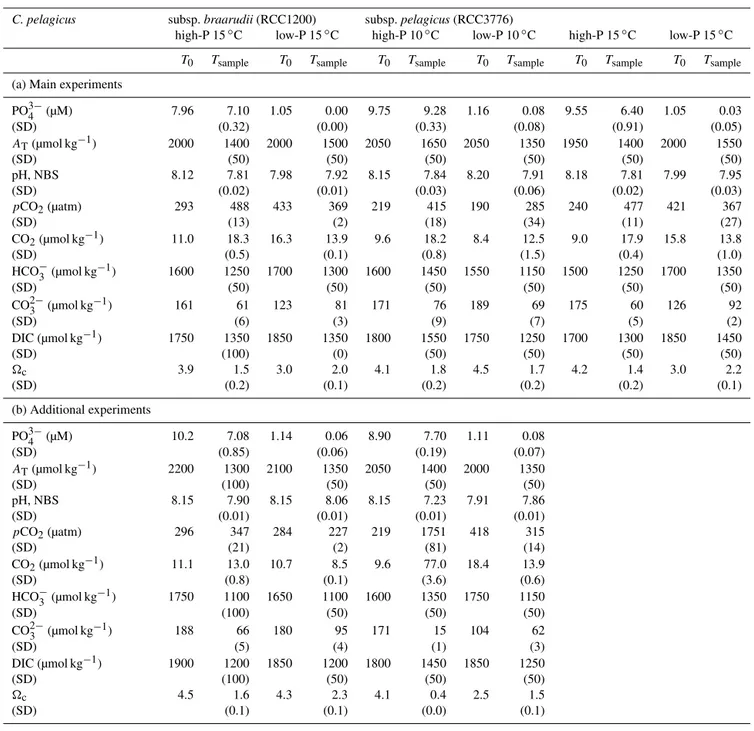
Table 1.Initial (T0)and residual (Tsample)medium chemistry: phosphate concentrations and carbonate chemistry parameters in paired high-P and low-P media batch experiments withCoccolithus pelagicussubsp.braarudii(RCC1200) grown at 15◦
C and subsp.pelagicus
(RCC3776) grown at 10 and 15◦C. Initial values (
T0,n=2) were measured directly from the high-P and low-P medium. The residual
medium chemistry represents the average of triplicate batch cultures (Tsample,n=3) with standard deviation (SD) in brackets.
C. pelagicus subsp.braarudii(RCC1200) subsp.pelagicus(RCC3776) high-P 15◦
C low-P 15◦
C high-P 10◦
C low-P 10◦
C high-P 15◦
C low-P 15◦ C
T0 Tsample T0 Tsample T0 Tsample T0 Tsample T0 Tsample T0 Tsample (a) Main experiments
PO3−
4 (µM) 7.96 7.10 1.05 0.00 9.75 9.28 1.16 0.08 9.55 6.40 1.05 0.03
(SD) (0.32) (0.00) (0.33) (0.08) (0.91) (0.05)
AT(µmol kg−1) 2000 1400 2000 1500 2050 1650 2050 1350 1950 1400 2000 1550
(SD) (50) (50) (50) (50) (50) (50)
pH, NBS 8.12 7.81 7.98 7.92 8.15 7.84 8.20 7.91 8.18 7.81 7.99 7.95
(SD) (0.02) (0.01) (0.03) (0.06) (0.02) (0.03)
pCO2(µatm) 293 488 433 369 219 415 190 285 240 477 421 367
(SD) (13) (2) (18) (34) (11) (27)
CO2(µmol kg−1) 11.0 18.3 16.3 13.9 9.6 18.2 8.4 12.5 9.0 17.9 15.8 13.8
(SD) (0.5) (0.1) (0.8) (1.5) (0.4) (1.0)
HCO−
3 (µmol kg
−1) 1600 1250 1700 1300 1600 1450 1550 1150 1500 1250 1700 1350
(SD) (50) (50) (50) (50) (50) (50)
CO2−
3 (µmol kg
−1) 161 61 123 81 171 76 189 69 175 60 126 92
(SD) (6) (3) (9) (7) (5) (2)
DIC (µmol kg−1) 1750 1350 1850 1350 1800 1550 1750 1250 1700 1300 1850 1450
(SD) (100) (0) (50) (50) (50) (50)
c 3.9 1.5 3.0 2.0 4.1 1.8 4.5 1.7 4.2 1.4 3.0 2.2
(SD) (0.2) (0.1) (0.2) (0.2) (0.2) (0.1)
(b) Additional experiments
PO3−
4 (µM) 10.2 7.08 1.14 0.06 8.90 7.70 1.11 0.08
(SD) (0.85) (0.06) (0.19) (0.07)
AT(µmol kg−1) 2200 1300 2100 1350 2050 1400 2000 1350
(SD) (100) (50) (50) (50)
pH, NBS 8.15 7.90 8.15 8.06 8.15 7.23 7.91 7.86
(SD) (0.01) (0.01) (0.01) (0.01)
pCO2(µatm) 296 347 284 227 219 1751 418 315
(SD) (21) (2) (81) (14)
CO2(µmol kg−1) 11.1 13.0 10.7 8.5 9.6 77.0 18.4 13.9
(SD) (0.8) (0.1) (3.6) (0.6)
HCO−
3 (µmol kg
−1
) 1750 1100 1650 1100 1600 1350 1750 1150
(SD) (100) (50) (50) (50)
CO2−
3 (µmol kg
−1) 188 66 180 95 171 15 104 62
(SD) (5) (4) (1) (3)
DIC (µmol kg−1) 1900 1200 1850 1200 1800 1450 1850 1250
(SD) (100) (50) (50) (50)
c 4.5 1.6 4.3 2.3 4.1 0.4 2.5 1.5
(SD) (0.1) (0.1) (0.0) (0.1)
2.4 Coccosphere and coccolith morphology
2.4.1 Coccolith dimensions
Samples for POL were filtered onto cellulose nitrate filters (0.8 µm, Whatman) after dispersing the coccoliths with a Triton–NaOCl treatment (Paasche et al., 1996). Filters were dried at 60◦
C in a drying oven, mounted with Canada Bal-sam (Merck, USA) on microscope slides and viewed
un-der crossed polarizers with a DM6000B Leica microscope, which had a modified turret accommodating polarizing fil-ters at different angles (Beaufort et al., 2014). Individual coccoliths were randomly selected and captured at 1000×
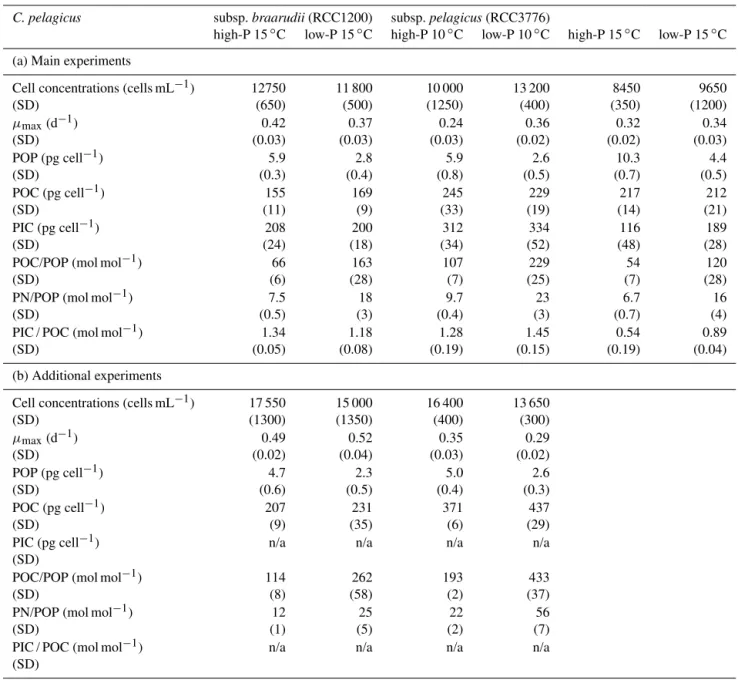
Table 2.Cellular quotas and molar ratios derived from paired high-P and low-P media batch experiments (n=3) ofCoccolithus pelagicus
subsp.braarudii(RCC1200) grown at 15◦
C, and subsp.pelagicus(RCC3776) grown at 10 and 15◦
C. Note that cell concentrations reflect those at time of sampling, and that maximum growth rate (µmax)was calculated during exponential growth phase. Low-P cultures were in stationary phase at time of harvest. Reported are the averages of triplicate batch cultures with standard deviation (SD) in brackets.
C. pelagicus subsp.braarudii(RCC1200) subsp.pelagicus(RCC3776)
high-P 15◦C low-P 15◦C high-P 10◦C low-P 10◦C high-P 15◦C low-P 15◦C
(a) Main experiments
Cell concentrations (cells mL−1) 12750 11 800 10 000 13 200 8450 9650
(SD) (650) (500) (1250) (400) (350) (1200)
µmax(d−1) 0.42 0.37 0.24 0.36 0.32 0.34
(SD) (0.03) (0.03) (0.03) (0.02) (0.02) (0.03) POP (pg cell−1) 5.9 2.8 5.9 2.6 10.3 4.4
(SD) (0.3) (0.4) (0.8) (0.5) (0.7) (0.5) POC (pg cell−1) 155 169 245 229 217 212
(SD) (11) (9) (33) (19) (14) (21)
PIC (pg cell−1
) 208 200 312 334 116 189
(SD) (24) (18) (34) (52) (48) (28)
POC/POP (mol mol−1
) 66 163 107 229 54 120
(SD) (6) (28) (7) (25) (7) (28)
PN/POP (mol mol−1) 7.5 18 9.7 23 6.7 16
(SD) (0.5) (3) (0.4) (3) (0.7) (4)
PIC / POC (mol mol−1) 1.34 1.18 1.28 1.45 0.54 0.89
(SD) (0.05) (0.08) (0.19) (0.15) (0.19) (0.04) (b) Additional experiments
Cell concentrations (cells mL−1) 17 550 15 000 16 400 13 650
(SD) (1300) (1350) (400) (300)
µmax(d−1) 0.49 0.52 0.35 0.29
(SD) (0.02) (0.04) (0.03) (0.02) POP (pg cell−1) 4.7 2.3 5.0 2.6
(SD) (0.6) (0.5) (0.4) (0.3)
POC (pg cell−1) 207 231 371 437
(SD) (9) (35) (6) (29)
PIC (pg cell−1) n/a n/a n/a n/a
(SD)
POC/POP (mol mol−1) 114 262 193 433
(SD) (8) (58) (2) (37)
PN/POP (mol mol−1) 12 25 22 56
(SD) (1) (5) (2) (7)
PIC / POC (mol mol−1) n/a n/a n/a n/a
(SD)
grey level (MGL) of the selected area measured in intensity values of 0 (black) to 255 (white). Mean grey level was used as a proxy for a change in coccolith thickness based on the birefringence of calcite (Beaufort, 2005). Coccolith length measured by this method considers the proximal shield only as the larger distal shield is non-birefringent under crossed polarizers (e.g. Cubillos et al., 2012).
2.4.2 Coccolith malformations and coccosphere dimensions
Samples for SEM were filtered onto polycarbonate filters (0.8 µm, Cyclopore, Whatman), air-dried and sputter-coated with gold-palladium. Imaging was performed with an S-4800 field emission scanning electron microscope (Hitachi, Japan) at 2500×magnification. Coccolith morphology was
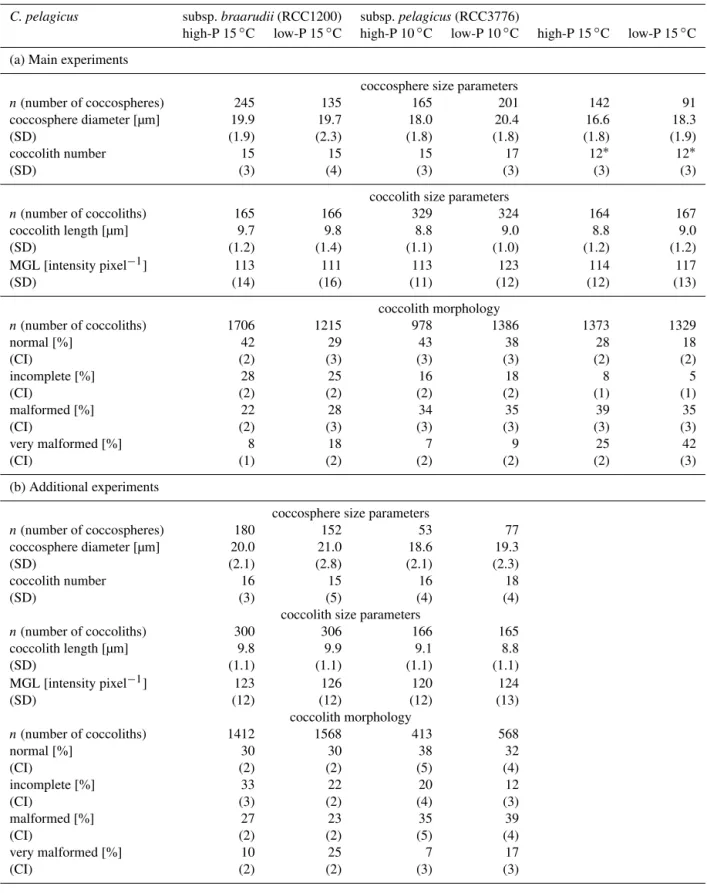
Table 3.Coccosphere and coccolith size parameters as well as coccolith morphology from paired high-P and low-P media batch experiments (n=3) withCoccolithus pelagicussubsp.braarudii(RCC1200) grown at 15◦C, and subsp.pelagicus(RCC3776) grown at 10 and 15◦C.
Reported is sample size (n), average value of pooled triplicate batch cultures with standard deviation (SD) or 95 % confidence interval (CI) in brackets.
C. pelagicus subsp.braarudii(RCC1200) subsp.pelagicus(RCC3776)
high-P 15◦C low-P 15◦C high-P 10◦C low-P 10◦C high-P 15◦C low-P 15◦C
(a) Main experiments
coccosphere size parameters
n(number of coccospheres) 245 135 165 201 142 91
coccosphere diameter [µm] 19.9 19.7 18.0 20.4 16.6 18.3 (SD) (1.9) (2.3) (1.8) (1.8) (1.8) (1.9) coccolith number 15 15 15 17 12∗
12∗
(SD) (3) (4) (3) (3) (3) (3)
coccolith size parameters
n(number of coccoliths) 165 166 329 324 164 167 coccolith length [µm] 9.7 9.8 8.8 9.0 8.8 9.0 (SD) (1.2) (1.4) (1.1) (1.0) (1.2) (1.2) MGL [intensity pixel−1] 113 111 113 123 114 117
(SD) (14) (16) (11) (12) (12) (13)
coccolith morphology
n(number of coccoliths) 1706 1215 978 1386 1373 1329
normal [%] 42 29 43 38 28 18
(CI) (2) (3) (3) (3) (2) (2)
incomplete [%] 28 25 16 18 8 5
(CI) (2) (2) (2) (2) (1) (1)
malformed [%] 22 28 34 35 39 35
(CI) (2) (3) (3) (3) (3) (3)
very malformed [%] 8 18 7 9 25 42
(CI) (1) (2) (2) (2) (2) (3)
(b) Additional experiments
coccosphere size parameters
n(number of coccospheres) 180 152 53 77 coccosphere diameter [µm] 20.0 21.0 18.6 19.3 (SD) (2.1) (2.8) (2.1) (2.3) coccolith number 16 15 16 18
(SD) (3) (5) (4) (4)
coccolith size parameters
n(number of coccoliths) 300 306 166 165 coccolith length [µm] 9.8 9.9 9.1 8.8 (SD) (1.1) (1.1) (1.1) (1.1) MGL [intensity pixel−1] 123 126 120 124
(SD) (12) (12) (12) (13)
coccolith morphology
n(number of coccoliths) 1412 1568 413 568
normal [%] 30 30 38 32
(CI) (2) (2) (5) (4)
incomplete [%] 33 22 20 12
(CI) (3) (2) (4) (3)
malformed [%] 27 23 35 39
(CI) (2) (2) (5) (4)
very malformed [%] 10 25 7 17
(CI) (2) (2) (3) (3)
number of coccoliths covering one sphere were estimated from the same calibrated SEM images.
3 Results
3.1 Phosphorus-limited growth
Division rates during exponential growth were comparable between high-P and low-P treatments for both subspecies (Table 2). The temperate morphotype subsp. braarudii (RCC1200) had higher maximum growth rates (0.44±0.06
d−1) than the subarctic morphotype subsp. pelagicus (RCC3776) (0.32±0.05 d−1). In low-P medium subsp. braarudiigrew to final cell concentrations of 1.3±0.2 ×10⁴
cells mL−1 (Table 2). Subspecies pelagicus grew to sim-ilar final cell concentrations of 1.3±0.1×10⁴cells mL−1
at 10◦C. At 15◦C, however, stationary phase was reached at lower cell densities (1.0±0.1×10⁴ cells mL−1) even though exponential growth rates were the same between the two temperatures. All low-P cultures were P-limited at the time of sampling as demonstrated by lower POP quotas and higher ratios of POC and PN to POP, compared to high-P treatments (Table 2; Fig. 1a). The two subspecies had the same POP quota when comparing low-P and high-P cul-tures, respectively. Particulate organic phosphorus produc-tion, however, was lower in subsp. pelagicusthan in subsp. braarudiibecause of lower growth rates (Fig. 1b). Most strik-ing is the high POP quota of subsp.pelagicuscultures grown at high temperature (15◦C). This almost doubled in both low-P and high-P treatments. Accordingly, POP production rates in high-P cultures of subsp.pelagicuswere more than twice as high at 15◦C.
The initial carbonate chemistry of the medium (T0, Ta-ble 1) was modified by culture growth in all treatments with a drawdown of alkalinity (AT)of 25–41 % in subsp.braarudii and of 20–34 % in subsp. pelagicus(Tsample, Table 1). The availability of dissolved inorganic carbon (DIC) was reduced by up to 37 % and there was a shift towards lower pH val-ues in all cultures from an initial pH=8.10±0.09 to a
min-imum pH=7.81. The high-P treatment of the additional
ex-periment of subsp.pelagicusgrown at 10◦
C showed a strong shift in the system towards pH=7.23 (Table 1b). The
satu-ration state for calcite (c)calculated for this treatment was below one whereas all other treatments were saturated in cal-cite (c>1, Table 1). This low pH value likely represents
a technical error (no other samples were measured on that same day) rather than an actual shift in the system because the culture parameters of this high-P treatment were other-wise very similar to the high-P treatment of the main experi-ment and there was no evidence for coccolith dissolution. 3.2 Cellular carbon quotas and ratios
The cellular POC quota was similar between low-P and high-P treatments for each experiment of the two subspecies (t
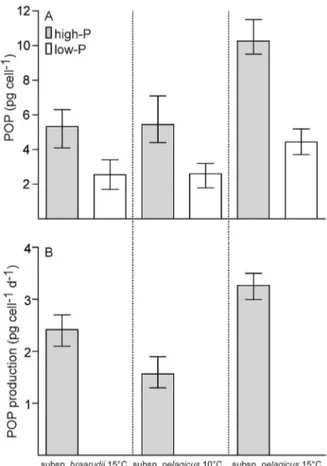
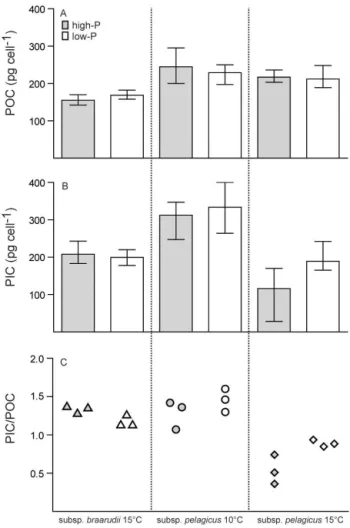
-Figure 1. (A)Particulate organic phosphorus (POP) quotas of Coc-colithus pelagicus subsp. braarudii grown at 15◦
C and subsp.
pelagicusgrown at 10 and 15◦C, in high-P and low-P medium. (B)POP production in high-P cultures. Mean±min/max; values
for subsp.braarudiiat 15◦C and subsp.
pelagicusat 10◦C are
av-erages of the main and additional experiments (n=6); for subsp. pelagicusat 10◦C,
n=3.
test:p >0.05; Table 2), except for the additional experiment of subsp.pelagicusgrown at 10◦
C in which the cells of low-P cultures contained significantly more low-POC than those of high-P cultures (t-test:p=0.02; Table 2b). High
tempera-ture (15◦
C) did not affect POC quotas in either P-treatment of subsp.pelagicus when only the main experiments were considered (t-test:p >0.05; Table 2a; Fig. 2a). In the
addi-tional experiments, POC quotas were higher in both low-P and high-P treatments of both subspecies compared to the main experiments (one-way ANOVA:p <0.001; Table 2b).
Figure 2. (A) Particulate organic carbon (POC) quotas of
Coccolithus pelagicussubsp.braarudiigrown at 15◦C and subsp. pelagicus grown at 10 and 15◦C, in high-P and low-P medium. (B)Particulate inorganic carbon (PIC) quotas.(C)PIC / POC ratios. Mean±min/max. Values are from main experiments only,n=3.
temperature (15◦
C) in both P-treatments (t-test:p <0.001; Fig. 2b). In consequence, the PIC / POC ratio of subsp. pelag-icuswas below one at 15◦
C compared to PIC / POC ratios of 1.37±0.18 at 10◦C (Fig. 2c). The decrease was strongest
(t-test:p=0.009) in exponentially growing high-P cultures.
These had a PIC / POC ratio of 0.54±0.19 compared to
a significantly higher PIC / POC ratio of 0.89±0.04 in
P-limited cultures at this temperature (t-test:p=0.003). The
reduced PIC / POC ratio of high-P cultures of subsp. pelag-icus at high temperature (15◦C) was mainly due to the de-creased rate of PIC production, although POC production rate increased by ca. 20 % (Fig. 3).
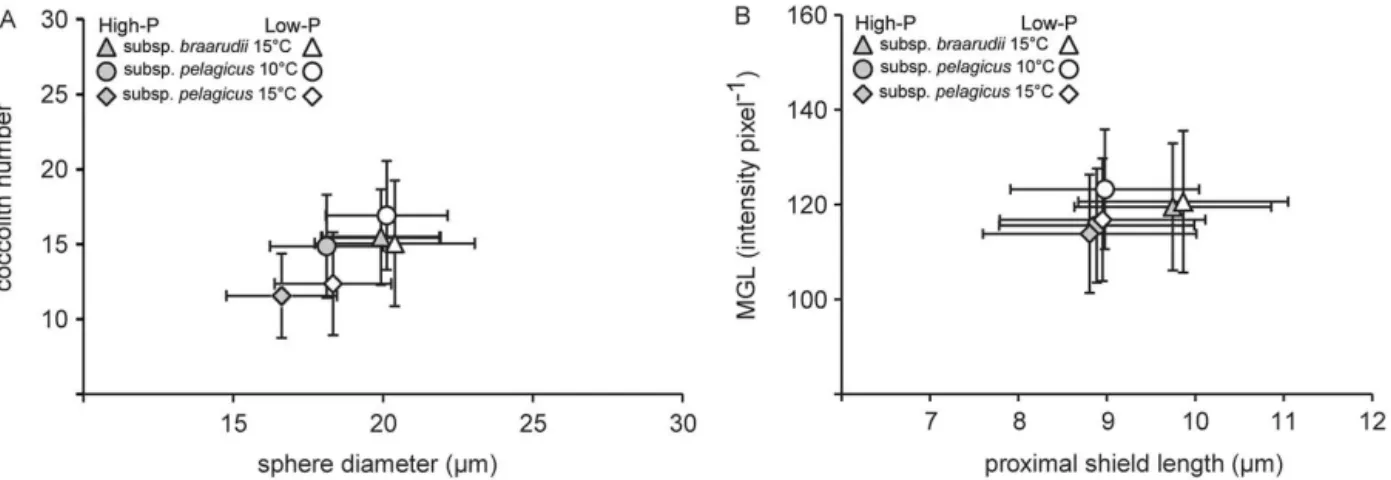
3.3 Coccosphere and coccolith dimensions
The average coccosphere diameter of subsp. pelagicus was smaller (18.1±1.9 µm) than that of subsp. braarudii
(19.9±2.0 µm) (Table 3; Fig. 4a). Phosphorus limitation
led to an increase in coccosphere size in subsp.
pelagi-Figure 3.Particulate organic (POC) and particulate inorganic car-bon (PIC) production of Coccolithus pelagicussubsp. braarudii
grown at 15◦C and subsp.
pelagicusgrown at 10 and 15◦C in
high-P medium. Mean±min/max. Values are from main experiments
only,n=3.
cus, but not subsp. braarudii. Temperature, on the other hand, decreased coccosphere size in subsp.pelagicus. These smaller spheres were composed of fewer coccoliths (12±3
coccoliths sphere−1
)compared to spheres of high-P cultures grown at 10◦
C (15±3 coccoliths sphere−1).
In both subspecies, the mean length of the proximal shield (PSL) was unaffected by changes in P-availability (t -test:p >0.05; Fig. 4b). Temperature did not change mean PSL in subsp.pelagicuseither (one-way ANOVA:p >0.05; Fig. 4b). Coccoliths produced by subsp.pelagicuswere sig-nificantly smaller than those produced by subsp.braarudii (t-test: p <0.001). Yet, PSL showed a wide range of 6.4–
14 µm in subsp.braarudiiand 5.8–12 µm in subsp. pelagi-cus. Coccoliths of low-P cultures of subsp.pelagicusin the main experiment had a significantly higher mean grey level (MGL), a proxy for coccolith thickness (t-test:p <0.0001;
Table 3a). However, this increase in thickness in low-P cul-tures could not be confirmed in the additional experiment or between P-treatments at high temperature (15◦
C). The dif-ference in mean coccolith thickness between P-treatments of subsp.braarudiiwas<3 %, which is not considered biologi-cally significant (Table 3). There was no effect of temperature on coccolith thickness (t-test:p >0.05).
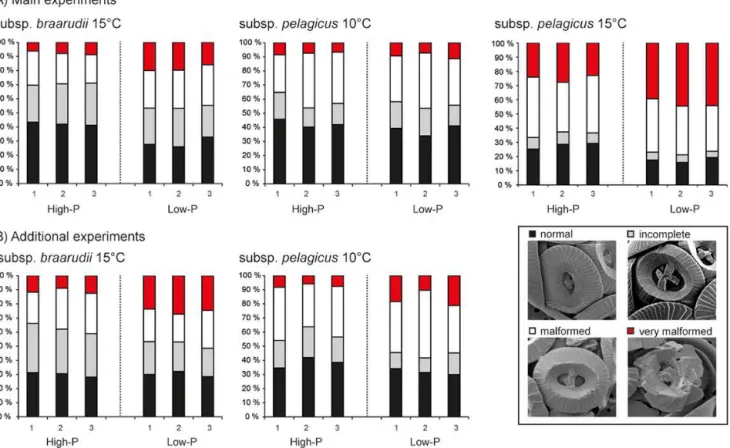
3.4 Coccolith malformations
Scanning electron microscopy revealed a background per-centage of malformed coccoliths in high-P cultures of subsp. braarudii of 30 and 37 % in the main and additional ex-periment, respectively (Table 3; Fig. 5). This percentage in-creased to 46–48 % under P-limitation, mainly due to an increased presence of coccoliths with blocky structures or holes, classified as “very malformed” (Table 3; Fig. 5). In subsp.pelagicus, the background percentage of malformed coccoliths in high-P cultures grown at 10◦
Figure 4. (A)Number of coccoliths per coccosphere plotted against the diameter of that coccosphere produced in high-P and low-P medium byCoccolithus pelagicussubsp.braarudiigrown at 15◦C and subsp.
pelagicusgrown at 10 and 15◦C.(B)Mean grey level (MGL) plotted
against mean proximal shield length (PSL) of individual coccoliths. Mean±SD. Values for subsp.braarudiiat 15◦C and subsp.
pelagicus
at 10◦
C are combined for the main and additional experiments.
coccoliths than subsp.braarudii(Table 3; Fig. 5). Malforma-tions increased to 56 % under P-limitation in the additional, but not in the main experiment. When subsp.pelagicuswas grown at elevated temperature (15◦
C), malformations in-creased to 64 % in high-P cultures. The highest abundance of malformed coccoliths (77 %) was observed in subsp. pelag-icuscultures grown under P-limitation and high temperature with 42 % of coccoliths classified as “very malformed” (Ta-ble 3; Fig. 5).
4 Discussion
Laboratory experiments are useful to systematically test the short-term physiological (plastic) response of coccolithophores to various environmental factors and could constrain how the PIC / POC (production) ratio is likely to change under future climate scenarios. The experiments presented here provide the first available data set to test the effect of P-limitation and elevated temperature onC. pelag-icus. We ran batch cultures of this species into P-limitation at moderate final cell densities (ca. 13 000 cells mL−1) to obtain enough sampling material at feasible culture volumes. The production of both POC and PIC created a drift in the carbonate system during culture growth. The (up to 37 %) consumption of DIC by the time of sampling depended mainly on the final cell densities reached in the culture. These final cell densities varied more strongly between the main and additional experiments of the same treatment (e.g. low-P) than between treatments (high-P vs. low-P). Yet, the observed trends, such as increased coccolith malformations in low-P cultures, were similar between the experiments, making carbonate chemistry an unlikely candidate for explaining the observed differences between treatments. Although bicarbonate, a known substrate for calcification, was reduced down to ca. 1100 µmol kg−1,
Rickaby et al. (2010) have shown that a reduction in bicarbonate down to 1000 µmol kg−1had no effect on either culture growth (same growth rate as control) or calcification (low percentage of malformed coccoliths) in C. pelagicus subsp.braarudii. The changes in calcification observed in the current study (reduced PIC quota and increased coccolith malformations) at high temperature were therefore not due to reduced substrate availability as the cultures were kept above the threshold for bicarbonate limitation. Furthermore, due to lower final cell densities, bicarbonate availability was actually higher in 15◦
C than in 10◦
C degree cultures of subsp.pelagicus. The reduction in PIC quota at 15◦C was therefore not related to bicarbonate availability.
4.1 Effect of phosphorus limitation and temperature on culture growth and phosphorus quotas
Initial phosphate concentrations of the growth medium did not influence cell division in exponential phase in either sub-species. The exponential growth rate of subsp. braarudii was similar to those determined previously under similar experimental conditions (Taylor et al., 2007; Buitenhuis et al., 2008). Although other studies have observed higher ex-ponential growth rates (up to 0.9 d−1) for the same strain (Langer et al., 2006; Krug et al., 2011), these authors used a higher irradiance and a longer light phase which probably in-creased cell division rates. The subarctic subspecies (subsp. pelagicus) had a lower exponential growth rate than the tem-perate subsp. braarudii, even when these two subspecies were grown at the same temperature (15◦
C). This may be due to strain-specific differences as have been described for different strains ofE. huxleyi(Langer et al., 2009).
We found clear evidence for P-limitation with signifi-cantly lower POP quotas and higher C/P and N/P ratios in low-P cultures. The doubled POP quota of subsp. pelagi-cusgrown at 15◦
C instead of 10◦
Figure 5.Morphology of coccoliths observed by scanning electron microscopy, shown as the percentage of four categories: normal (black), incomplete (grey), malformed (white) and very malformed (red).(A)Main experiments and(B)additional experiments of high-P and low-P cultures ofCoccolithus pelagicussubsp.braarudiiat 15◦
C and subsp.pelagicusat 10 and 15◦
C. Triplicate batch cultures (1, 2, 3) are presented separately for each experiment.
P-requirements at elevated temperature. Because of this, the same phosphate supply (1 µM) in low-P cultures sup-ported lower final cell densities at 15◦C although exponen-tial growth rates were unaffected. This increased requirement for P under temperature stress may be linked to increased energy demands and deserves further study as an increased P-requirement at high temperature could exacerbate nutrient limitation in a warmer ocean (Sarmiento et al., 2004). Most of cellular P is to be found in RNA (Geider and La Roche, 2002). The higher POP content of subsp.pelagicusgrown at high temperature (15◦
C) could therefore also be related to an increased RNA content caused by upregulated expression of genes related to a temperature stress response. However, the nitrogen content of the cells did not increase, offering no evidence for an increase in enzyme production.
4.2 Effect of phosphorus limitation and temperature on the PIC / POC ratio
Temperature had a stronger effect on the PIC / POC ratio than P-availability. Whereas P-limitation did not affect the PIC / POC ratio when the subspecies were grown near their respective isolation temperature, elevated temperature de-creased the PIC / POC ratio by more than half in high-P
cul-tures of subsp.pelagicus. This decrease in the PIC / POC ra-tio was driven by the 40–60 % decrease in PIC quota whereas POC quotas were similar between the two temperatures. In high-P cultures, PIC production declined by ca. 60 %. This sharp reduction in PIC quota and production in subsp. pelag-icusat elevated temperature, points towards a lower produc-tion of coccoliths or a decreased calcite content of single coc-coliths. Although the variation in calcite content of individ-ual coccoliths was high within one strain, the mean coccolith calcite content was unaffected by the tested environmental parameters (see also Sect. 4.3) and can therefore not explain the reduced PIC quota. Light microscope images showed that high-P cultures of subsp.pelagicus at elevated temperature (15◦
C) contained ca. 12 % naked cells whereas no naked cells where observed at 10◦
C. The coccolith coverage es-timated by SEM was 12 coccoliths sphere−1at 15◦
coccoliths than cultures at 10◦C. Reduced PIC production at elevated temperature was therefore due to a reduction in coccolith production with cells being covered by fewer coc-coliths and an increased percentage of naked cells. This, to-gether with an increased percentage of malformed coccoliths, apparently made the coccospheres unstable.
High temperature (15◦
C) changed the response of subsp. pelagicus to P-limitation. At 15◦
C the PIC / POC ratio, al-though still lower than at 10◦
C, was significantly higher un-der P-limitation. This was due to a higher PIC quota of low-P compared to high-P cultures. This observation seems coun-terintuitive considering that at 10◦C there was no effect of P-limitation on the PIC quota in subsp.pelagicus. We suggest that this difference lies in high-P and low-P cultures being harvested in different growth phases (exponential vs. station-ary phase) and the stronger dependence of POC production on P-availability. We explain this hypothesis in more detail in the following.
Coccolithus pelagicushas so far not been described to pro-duce multiple coccolith layers (this study; Gibbs et al., 2013), whereasE. huxleyican more than double its PIC / POC ratio by forming multiple layers of coccoliths around the cell (Lin-schooten et al., 1991; Paasche, 1998). It is therefore likely that there is an upper constraint to the PIC / POC ratio in C. pelagicus dictated by cell geometry. Without producing multiple layers, this species cannot increase PIC quota with-out increasing the cell surface area necessary to accommo-date further coccoliths. However, increasing the surface area entails an increase in cell volume and thereby POC quota. Under such a scenario, there is a limit as to how freely the PIC / POC ratio can vary. This may explain the lack of in-crease in the PIC / POC ratio under P-limitation at “normal” temperature (15◦C for subsp. braarudii, 10◦C for subsp. pelagicus). Similarly, Langer et al. (2012) observed that the PIC / POC ratio ofC. leptoporusis stable under nutrient lim-itation. Riegman et al. (2000), on the other hand, reported sustained PIC production inE. huxleyiduring decreasing nu-trient availability in P-limited chemostats in which POC pro-duction decreased.
The reason for the reduction in coccolith coverage in subsp.pelagicusat elevated temperature (15◦
C) is unclear. However, at this temperature the coccolith coverage of the cells was overall reduced, alleviating the spatial constraint to the production of new coccoliths. High-P cultures were harvested in exponential phase, in which cells were divid-ing and POC production was relatively constant. Low-P cul-tures, on the other hand, were sampled in stationary phase when cell division and POC production had declined due to the depletion of phosphate from the medium. If we assume PIC production to be less dependent on P-availability than POC production, as suggested by Riegman et al. (2000) for one particular strain ofE. huxleyi, low-P cultures could have continued producing coccoliths while cell division was slow-ing down. Sustained PIC production while POC production was decreasing in cultures going into stationary phase would
explain the observed increase in the PIC / POC ratio in low-P cultures.
4.3 Effect of phosphorus limitation and temperature on coccolith morphology
The two subspecies overlapped in their size distribution, both in regard to coccosphere diameter and coccolith length. Overlapping coccolith size ranges have been previously de-scribed for these two subspecies, and our results confirm that subsp.pelagicusis the smaller morphotype of the two (Bau-mann et al., 2000; Geisen et al., 2002; Cubillos et al., 2012). There was no effect of either temperature or P-limitation on the mean coccolith volume and the same amount of cal-cite was fixed into individual coccoliths independently of the tested abiotic factors. Gibbs et al. (2013) have shown that mean coccolith size in C. pelagicussubsp. braarudii does not change during different growth phases and in E. hux-leyi, coccolith dimensions have also been described as re-maining constant among different dilution rates in N-limited cyclostats (Fritz, 1999). It therefore seems that within one strain, mean coccolith volume is not a plastic trait.
Using a conversion factor for mean grey level (MGL) to coccolith thickness (Beaufort et al., 2014), we esti-mated mean coccolith calcite weight for the two subspecies. Subspecies braarudii produced coccoliths with an average weight of 117±34 pg calcite whereas subsp.pelagicus
coc-coliths were lighter at 100±27 pg calcite. These estimates
are lower than the estimates obtained using the shape fac-tor of Young and Ziveri (2000). By means of this species-specific shape factor (0.06 forC. pelagicus), mean coccolith weight was estimated from the proximal shield length (PSL), rendering values of 159±54 pg calcite for subsp.braarudii and 120±44 pg calcite for subsp.pelagicus. The main
rea-son for this difference in calcite content estimates is that Coccolithus coccoliths are not entirely birefringent (Beau-fort, 2005; Cubillos et al., 2012), therefore calculations based on birefringence will underestimate absolute weight but are useful for comparative purposes.
densities (Langer et al., 2013b). This may explain the low level of malformations observed by Rickaby et al. (2010) in highly dilute batch cultures (<2 300 cells mL−1)compared to our higher cell concentrations (ca. 13 000 cells mL−1
). However, the 50 % malformed coccoliths reported by Langer et al. (2006) were observed in batch cultures at cell concen-trations of ca. 6 000 cells mL−1, indicating that the percent-age of malformations may not be constant over time (Langer et al., 2013b). Another factor leading to malformations in culture is a lack of mixing (Langer et al., 2013b). Our cul-tures were agitated only once a day which may have con-tributed to the high degree of malformations observed in our control cultures.
Phosphorus limitation increased the percentage of mal-formed coccoliths further by ca. 14 %. Nutrient limitation has previously been suggested to increase malformations in E. huxleyiin both mesocosm and laboratory experiments (e.g. Båtvik et al., 1997; Paasche, 1998). However, the malforma-tion increases described by these authors are slight and/or poorly quantified and Langer et al. (2012) argued that a dif-ference of less than 10 % in malformations may be within the range of natural variation. Also, these authors failed to observe an effect of nutrient availability on coccolith mor-phology inC. leptoporusand concluded that the influence of nutrient availability on the coccolith machinery is negligible. Our study is therefore the first to show that coccolith mor-phology can be significantly (>10 %) modified by limitation
by a macronutrient, in this case phosphate. In subsp. pelagi-cus, elevated temperature had an even stronger effect than P-limitation on coccolith morphology. The percentage of nor-mal coccoliths in high-P cultures of subsp. pelagicus went down to ca. 30 % at 15◦C. This temperature was probably above the temperature tolerance of this subarctic strain and increased malformations could have been related to a stress response to high temperature. Similarly, Langer et al. (2010) observed a decrease of normal coccoliths inE. huxleyi from 81 % at 10◦
C to only 29 % at 25◦
C. The highest degree of malformation in this study was observed in subsp.pelagicus cultures faced with both P-limitation and temperature stress indicating that several environmental stressors can add up to compromise coccolith morphology.
5 Conclusions
The two strains of C. pelagicus, representing the two recognized subspecies, responded in the same manner to P-limitation, although exponential growth rates differed. Phosphorus-limited cells of C. pelagicus had consistently lower P-quotas, but showed no change in the PIC / POC ratio when grown near the subspecies’ respective isolation temper-ature. As C. pelagicusdoes not produce multiple coccolith layers, there is likely an upper constraint to the PIC / POC ra-tio in this species. Temperature stress, on the other hand, had a strong impact on the PIC / POC ratio which decreased by
40–60 %. This was due to a reduced production of coccoliths, whereas the mean calcite content of individual coccoliths was not affected by experimental conditions. However, mal-formations of coccoliths increased under both P-limitation and elevated temperature, with the highest percentage of malformed coccoliths observed under a combination of P-limitation and high temperature stress. Although increased malformations under nutrient limitation have been previ-ously suggested (e.g. Båtvik et al., 1997; Paasche, 1998), the evidence has so far been poor (Langer et al., 2012). This study is therefore the first to show that limitation by a macronutrient can indeed impact coccolith morphology.
Elevated temperature doubled P-quotas, indicating an in-creased P-requirement to maintain similar growth and POC production rates at higher temperature. Thus, warmer ocean temperatures may reinforce P-limitation in natural popula-tions, potentially leading to lower cell densities as species-and even strain-specific sensitivities to climate change will contribute to changes in the abundance and composition of phytoplankton communities (Thomas et al., 2012; Barnard et al., 2004). This in turn will affect global biogeochemi-cal cycles. Species- and strain-specific differences in phys-iology need to be taken into consideration when predicting general responses of coccolithophores to changing environ-mental parameters and possible changes in CO2feedback to the atmosphere. It is unlikely that a more nutrient-poor ocean will increase CO2release byC. pelagicusas this species does not increase calcification over POC production when faced by nutrient limitation. However, a decrease in PIC produc-tion at elevated temperature and changes in the abundance of this species may influence feedback mechanisms of ocean– atmosphere CO2exchange.
Acknowledgements. This research was funded by the Research Council of Norway (FRIMEDBIO project 197823) and the Royal Swedish Academy of Sciences through a grant from the Knut and Alice Wallenberg Foundation (KAW 2009.0287). Preliminary experiments at the Biological Station Roscoff were supported by an FP7 ASSEMBLE research grant. We thank Sissel Brubak, Vladyslava Hostyeva, and Viljar Skylstad for laboratory support and Berit Kaasa for running CN analyses. We would furthermore like to thank J.-P. Gattuso and an anonymous reviewer for their helpful comments on the paper. A special thank you goes to Gerald Langer, whose constructive comments greatly improved this paper.
References
Archer, D.: Modeling the calcite lysocline, J. Geophys. Res., 96, 17037–17050, 1991.
Armstrong, R. A., Lee, C., Hedges, J. I., Honjo, S., and Wakeham, S. G.: A new, mechanistic model for organic carbon fluxes in the ocean based on the quantitative association of POC with ballast minerals, Deep-Sea Res. Pt. II, 49, 219–236, 2002.
Balch, W. M., Holligan, P. M., Ackleson, S. G., and Voss, K. J.: Biological and optical properties of mesoscale coccolithophore blooms in the Gulf of Maine, Limnol. Oceanogr., 36, 629–643, 1991.
Barnard, R., Batten, S. D., Beaugrand, G., Buckland, C., Conway, D. V. P., Edwards, M., Finlayson, J., Gregory, L. W., Halliday, N. C., John, A. W. G., Johns, D. G., Johnson, A. D., Jonas, T. D., Lindley, J. A., Nyman, J., Pritchard, P., Reid, P. C., Richardson, A. J., Saxby, R. E., Sidey, J., Smith, M. A., Stevens, D. P., Taylor, C. M., Tranter, P. R. G., Walne, A. W., Wootton, M., Wotton, C. O. M., and Wright, J. C.: Continuous plankton records: Plankton atlas of the North Atlantic Ocean (1958–1999). II. Biogeograph-ical charts, Mar. Ecol.-Prog. Ser., 11–75, 2004.
Baumann, K.-H., Young, J. R., Cachão, M., and Ziveri, P.: Biomet-ric study ofCoccolithus pelagicusand its palaeoenvironmental utility, J. Nannoplankton Res., 22, 82, 2000.
Beardall, J. and Raven, J. A.: The potential effects of global cli-mate change on microalgal photosynthesis, growth and ecology, Phycologia, 43, 26–40, 2004.
Beaufort, L.: Weight estimates of coccoliths using the optical prop-erties (birefringence) of calcite, Micropaleontology, 51, 289– 297, 2005.
Beaufort, L. and Heussner, S.: Coccolithophorids on the continental slope of the Bay of Biscay – production, transport and contribu-tion to mass fluxes, Deep-Sea Res. Pt. II, 46, 2147–2174, 1999. Beaufort, L., Barbarin, N., and Gally, Y.: Optical measurements to
determine the thickness of calcite crystals and the mass of thin carbonate particles such as coccoliths, Nat. Protoc., 9, 633–642, 2014.
Borchard, C., Borges, A. V., Händel, N., and Engel, A.: Biogeo-chemical response of Emiliania huxleyi (PML B92/11) to el-evated CO2 and temperature under phosphorous limitation: A chemostat study, J. Exp. Mar. Biol. Ecol., 410, 61–71, 2011. Broerse, A. T. C., Ziveri, P., and Honjo, S.: Coccolithophore
(−CaCO3)flux in the Sea of Okhotsk: seasonality, settling and
alteration processes, Mar. Micropaleontol., 39, 179–200, 2000. Buitenhuis, E. T., van Bleijswijk, J., Bakker, D., and Veldhuis, M.:
Trends in inorganic and organic carbon in a bloom ofEmiliania huxleyi in the North Sea, Mar. Ecol.-Prog. Ser., 143, 271–282, 1996.
Buitenhuis, E. T., Pangerc, T., Franklin, D. J., Le Quéré, C., and Ma-lin, G.: Growth rates of six coccolithophorid strains as a function of temperature, Limnol. Oceanogr., 53, 1181–1185, 2008. Båtvik, H., Heimdal, B. R., Fagerbakke, K. M., and Green, J. C.:
Effects of unbalanced nutrient regime on coccolith morphology and size inEmiliania huxleyi(Prymnesiophyceae), Eur. J. Phy-col., 32, 155–165, 1997.
Cachão, M. and Moita, M. T.:Coccolithus pelagicus, a productivity proxy related to moderate fronts off Western Iberia, Mar. Mi-cropaleontol., 39, 131–155, 2000.
Cubillos, J. C., Henderiks, J., Beaufort, L., Howard, W. R., and Hallegraeff, G. M.: Reconstructing calcification in ancient coccolithophores: Individual coccolith weight and morphology of Coccolithus pelagicus (sensu lato), Mar. Micropaleontol., 92/93, 29–39, 2012.
Feng, Y., Warner, M. E., Zhang, Y., Sun, J., Fu, F.-X., Rose, J. M., and Hutchins, D. A.: Interactive effects of increasedpCO2, tem-perature and irradiance on the marine coccolithophoreEmiliania huxleyi(Prymnesiophyceae), Eur. J. Phycol., 43, 87–98, 2008. Fernández, E., Boyd, P., Holligan, P. M., and Harbour, D. S.:
Pro-duction of organic and inorganic carbon within a large-scale coc-colithophore bloom in the northeast Atlantic Ocean, Mar. Ecol.-Prog. Ser., 97, 271–285, 1993.
Findlay, H. S., Calosi, P., and Crawfurd, K.: Determinants of the PIC:POC response in the coccolithophoreEmiliania huxleyi un-der future ocean acidification scenarios, Limnol. Oceanogr., 56, 1168–1178, 2011.
Fritz, J. J.: Carbon fixation and coccolith detachment in the coc-colithophoreEmiliania huxleyiin nitrate-limited cyclostats. Mar. Biol., 133, 509–518, 1999.
Gattuso, J.-P., Pichon, M., and Frankignoulle, M.: Biological con-trol of air-sea CO2fluxes: effect of photosynthetic and calcifying
marine organisms and ecosystems, Mar. Ecol.-Prog. Ser., 129, 307–312, 1995.
Geider, R. and La Roche, J.: Redfield revisited: variability of C : N : P in marine microalgae and its biochemical basis, Eur. J. Phycol., 37, 1–17, 2002.
Geisen, M., Billard, C., Broerse, A. T. C., Cros, L., Probert, I., and Young, J. R.: Life-cycle associations involving pairs of holococ-colithophorid species: intraspecific variation or cryptic specia-tion? Eur. J. Phycol. 37, 531–550, 2002.
Gibbs, S. J., Poulton, A. J., Bown, P. R., Daniels, C. J., Hop-kins, J., Young, J. R., Jones, H. L., Thiemann, G. J., O’Dea, S. A., and Newsam, C.: Species-specific growth response of coccolithophores to Palaeocene-Eocene environmental change, Nat. Geosci., 6, 218–222, 2013.
Gran, G.: Determination of the equivalence point in potentiometric titrations of seawater with hydrochloric acid, Oceanol. Acta, 5, 209–218, 1952.
Guillard, R. R. L.: Culture of phytoplankton for feeding marine in-vertebrates, in: Culture of marine invertebrate animals, edited by: Smith, W. L. and Chanley, M. H., Plenum Press, New York, USA, 29–60, 1975.
Henderiks, J., Winter, A., Elbrächter, M., Feistel, R., van der Plas, A., Nausch, G., and Barlow, R.: Environmental controls on Emil-iania huxleyi morphotypes in the Benguela coastal upwelling system (SE Atlantic), Mar. Ecol.-Prog. Ser., 448, 51–66, 2012. Holligan, P. M., Fernández, E., Aiken, J., Balch, W. M., Boyd, P.,
Burkill, P. H., Finch, M., Groom, S. B., Malin, G., Muller, K., Purdie, D. A., Robinson, C., Trees, C. C., Turner, S. M., and van der Wal, P.: A biogeochemical study of the coccolithophore,
Emiliania huxleyi, in the North Atlantic, Global Biogeochem. Cy., 7, 879–900, 1993.
Jordan, R. W., Cros, L., and Young, J. R.: A revised classification scheme for living haptophytes, Micropaleontology, 50, 55–79, 2004.
Klaas, C. and Archer, D. E.: Association of sinking organic mat-ter with various types of mineral ballast in the deep sea: Im-plications for the rain ratio. Global Biogeochem. Cy., 16, 1116, doi:10.1029/2001GB001765, 2002.
Krug, S. A., Schulz, K. G., and Riebesell, U.: Effects of changes in carbonate chemistry speciation on Coccolithus braarudii: a discussion of coccolithophorid sensitivities, Biogeosciences, 8, 771–777, doi:10.5194/bg-8-771-2011, 2011.
Langer, G. and Benner, I.: Effect of elevated nitrate concentration on calcification inEmiliania huxleyi, J. Nannoplankton Res. 30, 77–80, 2009.
Langer, G., Geisen, M., Baumann, K.-H., Klaes, J., Riebesell, U., Thoms, S., and Young, J. R.: Species-specific responses of calci-fying algae to changing seawater carbonate chemistry, Geochem. Geophy. Geosy., 7, Q09006, doi:10.1029/2005GC001227, 2006. Langer, G., Nehrke, G., Probert, I., Ly, J., and Ziveri, P.: Strain-specific responses of Emiliania huxleyi to changing seawater carbonate chemistry, Biogeosciences, 6, 2637–2646, doi:10.5194/bg-6-2637-2009, 2009.
Langer, G., de Nooijer, L. J., and Oetjen, K.: On the role of the cy-toskeleton in coccolith morphogenesis: The effect of cytoskele-ton inhibitors, J. Phycol., 46, 1252–1256, 2010.
Langer, G., Probert, I., Nehrke, G., and Ziveri, P.: The morpholog-ical response ofEmiliania huxleyito seawater carbonate chem-istry changes: an inter-strain comparison, J. Nannoplankton Res., 32, 29–34, 2011.
Langer, G., Oetjen, K., and Brenneis, T.: Calcification of Calcidis-cus leptoporusunder nitrogen and phosphorus limitation, J. Exp. Mar. Biol. Ecol., 413, 131–137, 2012.
Langer, G., Oetjen, K., and Brenneis, T.: coccolithophores do not increase particulate carbon production under nutrient limitation: A case study usingEmiliania huxleyi(PML B92/11), J. Exp. Mar. Biol. Ecol., 443, 155–161, 2013a.
Langer, G., Oetjen, K., and Brenneis, T.: On culture artefacts in coc-colith morphology, Helgoland Mar. Res., 67, 359–369, 2013b. Linschooten, C., van Bleijswijk, J. D. L., van Emburg, P. R., de
Vrind, J. P. M., Kempers, E. S., Westbroek, P., and de Vrind-de Jong, E. W.: Role of the light-dark cycle and medium composi-tion on the produccomposi-tion of coccoliths byEmiliania huxleyi (Hap-tophyceae), J. Phycol., 27, 82–86, 1991.
Menzel, D. W. and Corwin, N.: The measurement of total phospho-rus in seawater based on the liberation of organically bound frac-tions by persulfate oxidation, Limnol. Oceanogr., 10, 280–282, 1965.
Murphy, J. and Riley, J. P.: A modified single solution method for the determination of phosphate in natural waters, Anal. Chim. Acta, 27, 31–36, 1962.
Paasche, E.: Roles of nitrogen and phosphorus in coccolith forma-tion in Emiliania huxleyi(Prymnesiophyceae), Eur. J. Phycol., 33, 33–42, 1998.
Paasche, E.: A review of the coccolithophorid Emiliania huxleyi
(Prymnesiophyceae), with particular reference to growth, coccol-ith formation, and calcification-photosynthesis interactions, Phy-cologia, 40, 503–529, 2002.
Paasche, E. and Brubak, S.: Enhanced calcification in the coccol-ithophoridEmiliania huxleyi(Haptophyceae) under phosphorus limitation, Phycologia, 33, 324–330, 1994.
Paasche, E., Brubak, S., Skattebøl, S., Young, J. R., and Green, J. C.: Growth and calcification in the coccolithophoridEmiliania
huxleyi(Haptophyceae) at low salinities, Phycologia, 35, 394– 403, 1996.
Rickaby, R. E. M., Henderiks, J., and Young, J. R.: Perturbing phy-toplankton: response and isotopic fractionation with changing carbonate chemistry in two coccolithophore species, Clim. Past, 6, 771–785, doi:10.5194/cp-6-771-2010, 2010.
Ridgwell, A., Schmidt, D. N., Turley, C., Brownlee, C., Maldon-ado, M. T., Tortell, P., and Young, J. R.: From laboratory ma-nipulations to Earth system models: scaling calcification im-pacts of ocean acidification, Biogeosciences, 6, 2611–2623, doi:10.5194/bg-6-2611-2009, 2009.
Riebesell, U., Zondervan, I., Rost, B., Tortell, P. D., Zeebe, R. E., and Morel, F. M. M.: Reduced calcification of marine plankton in response to increased atmospheric CO2, Nature, 407, 364–367, 2000.
Riegman, R., Stolte, W., Noordeloos, A. A. M., and Slezak, D.: Nu-trient uptake and alkaline phosphatase (EC 3:1:3:1) activity
ofEmiliania huxleyi(Prymnesiophyceae) during growth under N and P limitation in continuous cultures, J. Phycol., 36, 87–96, 2000.
Rost, B. and Riebesell, U.: coccolithophores and the biological pump: responses to environmental changes, in: coccolithophores – from molecular processes to global impact, edited by: Thier-stein, H. R. and Young, J. R., Springer, Heidelberg, Germany, 99–125. 2004.
Roy, R. N., Roy, L. N., Vogel, K. M., Porter-Moore, C., Pearson, T., Good, C. E., Millero, F. J., and Campbell, D. M.: The dissociation constants of carbonic acid in seawater at salinities 5 to 45 and temperatures 0 to 45◦
C, Mar. Chem., 44, 249–267, 1993. Sáez, A. G., Probert, I., Geisen, M., Quinn, P., Young, J. R., and
Medlin, L. K.: Pseudo-cryptic speciation in coccolithophores, P. Natl. Acad. Sci. USA, 100, 7163–7168, 2003.
Sarmiento, J. L., Slater, R., Barber, R., Bopp, L., Doney, S. C., Hirst, A. C., Kleypas, J., Matear, R., Mikolajewicz, U., Monfray, P., Soldatov, V., Spall, S. A., and Stouffer, R.: Response of ocean ecosystems to climate warming, Global Biogeochem. Cy., 18, GB3003, doi:10.1029/2003GB002134, 2004.
Schiller, J.: Coccolithineae, in: Kryptogamen-Flora von Deutsch-land, Österreich und der Schweiz, Akademische Verlagsge-sellschaft, Leipzig, Germany, 10, 89–226, 1930.
Taylor, A. R., Russel, M. A., Harper, G. M., Collins, T., and Brown-lee, C.: Dynamics of formation and secretion of heterococcoliths byCoccolithus pelagicusssp.braarudii, Eur. J. Phycol., 42, 125– 136, 2007.
Thomas, M. K., Kremer, C. T., Klausmeier, C. A., and Litchman, E.: A global pattern of thermal adaptation in marine phytoplankton, Science, 338, 1085–1088, 2012.
van Bleijswijk, J. D. L., Kempers, R. S., van der Wal, P., Westbroek, P., Egge, J. K., and Lukk, T.: Standing stocks of PIC, POC, PON andEmiliania huxleyicoccospheres and liths in sea water en-closures with different phosphate loadings, Sarsia, 79, 307–317, 1994.
van der Wal, P., Kempers, R. S., and Veldhuis, M. J. W.: Produc-tion and downward flux of organic matter and calcite in a North Sea bloom of the coccolithophoreEmiliania huxleyi, Mar. Ecol.-Prog. Ser., 126, 247–265, 1995.
by: Winter, A. and Siesser, W., Cambridge University Press, UK, 13–37, 1994.
Young, J. R. and Ziveri, P.: Calculation of coccolith volume and its use in calibration of carbonate flux estimates, Deep-Sea Res. Pt. II, 47, 1679–1700, 2000.