RESEARCH ARTICLE
Development of a Korean Fracture Risk Score
(KFRS) for Predicting Osteoporotic Fracture
Risk: Analysis of Data from the Korean
National Health Insurance Service
Ha Young Kim1‡, Eun Jin Jang2‡, ByeongJu Park3, Tae-Young Kim4, Soon-Ae Shin5, Yong-Chan Ha6☯*, Sunmee Jang7☯*
1Department of Internal Medicine, Wonkwang University Sanbon Hospital, Gunpo, Republic of Korea,
2Department of information Statistics, Andong National University, Andong, South Korea,3Department of Statistics, Kyungpook National University, Daegu, South Korea,4Department of Orthopaedic Surgery, School of Medicine, Hallym University, Anyang, Korea,5Big Data Steering Department, National Health Insurance Service, Seoul, Korea,6Department of Orthopaedic Surgery, Chung-Ang University College of Medicine, Seoul, South Korea,7College of Pharmacy, Gachon University, Incheon, Korea
☯These authors contributed equally to this work. ‡These authors also contributed equally to this work.
*[email protected](SJ);[email protected](Y-CH)
Abstract
Background
Asian-specific prediction models for estimating individual risk of osteoporotic fractures are rare. We developed a Korean fracture risk prediction model using clinical risk factors and assessed validity of the final model.
Methods
A total of 718,306 Korean men and women aged 50–90 years were followed for 7 years in a national system-based cohort study. In total, 50% of the subjects were assigned randomly to the development dataset and 50% were assigned to the validation dataset. Clinical risk factors for osteoporotic fracture were assessed at the biennial health check. Data on osteo-porotic fractures during the follow-up period were identified by ICD-10 codes and the nation-wide database of the National Health Insurance Service (NHIS).
Results
During the follow-up period, 19,840 osteoporotic fractures were reported (4,889 in men and 14,951 in women) in the development dataset. The assessment tool called the Korean Frac-ture Risk Score (KFRS) is comprised of a set of nine variables, including age, body mass index, recent fragility fracture, current smoking, high alcohol intake, lack of regular exercise, recent use of oral glucocorticoid, rheumatoid arthritis, and other causes of secondary osteo-porosis. The KFRS predicted osteoporotic fractures over the 7 years. This score was vali-dated using an independent dataset. A close relationship with overall fracture rate was
PLOS ONE | DOI:10.1371/journal.pone.0158918 July 11, 2016 1 / 15
a11111
OPEN ACCESS
Citation:Kim HY, Jang EJ, Park B, Kim T-Y, Shin S-A, Ha Y-C, et al. (2016) Development of a Korean Fracture Risk Score (KFRS) for Predicting Osteoporotic Fracture Risk: Analysis of Data from the Korean National Health Insurance Service. PLoS ONE 11(7): e0158918. doi:10.1371/journal. pone.0158918
Editor:Tuan Van Nguyen, Garvan Institute of Medical Research, AUSTRALIA
Received:February 11, 2016
Accepted:June 23, 2016
Published:July 11, 2016
Copyright:© 2016 Kim et al. This is an open access article distributed under the terms of theCreative Commons Attribution License, which permits unrestricted use, distribution, and reproduction in any medium, provided the original author and source are credited.
Data Availability Statement:All relevant data are within the paper.
observed when we compared the mean predicted scores after applying the KFRS with the observed risks after 7 years within each 10th of predicted risk.
Conclusion
We developed a Korean specific prediction model for osteoporotic fractures. The KFRS was able to predict risk of fracture in the primary population without bone mineral density testing and is therefore suitable for use in both clinical setting and self-assessment. The website is available athttp://www.nhis.or.kr.
Introduction
Osteoporosis is characterized by low bone mass, microarchitectural deterioration of bone tis-sue, and reduced bone quality [1]. The importance of this disease arises from its complication of fragility fractures which are associated with high morbidity and mortality. Osteoporotic frac-tures have become a major health and economic burden in Asian countries as in North Amer-ica and Europe. With the aging population rapidly increasing in Asia, it is projected that by 2050, half of the world’s hip fractures will occur in Asians[2]. In Korea, 12.3% of women aged 50 years experiences a hip fracture in their life. In addition, 59.5% have osteoporotic fractures during their lifetime[3]. The socioeconomic burden of osteoporotic fractures is predicted to increase dramatically in the future because the rate of increase in the elderly population in Korea is greater than that of elsewhere. Therefore, early detection of individuals with high frac-ture risk would have a substantial impact on reducing the burden caused by fracfrac-tures in Korea.
Low bone mineral density (BMD) is a strong predictor of osteoporotic fracture risk [4]. However, BMD alone is insufficient to identify all individuals with high risk because osteopo-rotic fractures can occur in patients with any given T-score [5], and even in those with normal BMD values, according to the current World Health Organization (WHO) classification. Thus, a number of clinical risk factors that provide information on fracture risk independent of BMD have been identified [6–13]. Recently, several algorithms have been developed to estimate frac-ture probability using additional risk factors for fracfrac-ture. Among these algorithms, the WHO Fracture Risk Assessment Tool (FRAX) algorithm[14], Q fracture algorithm[15], and Garvan Fracture Risk Calculator(Garvan)[16,17] are widely available and used. Several studies have compared various tools for their ability to identify women at highest risk of fracture[18–20]. Most of these studies reached the conclusions that the simpler tools perform as well as the more complex tools. The FRAX algorithm, which has been incorporated into several national guidelines, provides 10-year absolute fracture risk utilizing a set of clinical risk factors with or without BMD data in different populations[14], including Korea. These factors include low body mass index (BMI), current smoking, mean alcohol intake of three or more units daily, parental history of hip fracture, prior fragility fracture, long-term use of oral glucocorticoids, rheumatoid arthritis, and other secondary causes of osteoporosis. However, the clinical risk factors included in FRAX are slightly different than those identified in prospective population studies [15,16,21,22]. The risk and incidence of osteoporotic fractures varies widely between populations [23]. Thus, ethnic- and other population-specific data are needed to effectively predict new fracture risk in a given population. However, few studies have investigating the clinical risk factors of osteoporotic fractures in Korea.
The main concern when managing osteoporosis is identifying individuals at high risk for pharmacological intervention. To do this, better risk assessment tools are needed to enhance
fracture predictions. A nationwide database is required to develop a fracture risk assessment tool for Korea. The Korean government operates a mandatory national health insurance sys-tem with a central database called the Nation Health Insurance Service (NHIS). This database contains all prescription drug and treatment claim records for almost all Koreans. The purpose of our study was to develop and validate a practical tool for osteoporotic fracture risk assess-ment using this Korean nationwide database.
Materials and Methods
Study Population
The Korean NHIS provides health insurance to all Koreans, and all Koreans are obliged to become members of this national insurance system. The Korean NHIS performs the National Health Checkup every 2 years to insured Koreans over 40 years, and this checkup is enforced by law. Local hospitals that are fully qualified based on the NHIS criteria perform these health checkups. The National Health Checkup includes height, weight, blood pressure measure-ments, chest radiography, urinalysis, blood count, and blood chemistry. In addition, a self-administered questionnaire is used to collect medical history, current health status, family his-tory, tobacco and alcohol consumption, dietary preferences, and leisure-time physical
activities.
Two million men and women were randomly selected from participants who had taken health checkups from January 1 to December 31, 2006. We excluded subjects aged<50
and>90 years (n = 1,269,844). In addition, subjects who had missing information for height or weight (n = 300) were excluded. There was no missing data in other variables. Subjects who had been prescribed osteoporosis medication (e.g., bisphosphonate, selective estrogen receptor modulator, calcitonin, or calcium /vitamin D) or who had used any of these medications>30
days during the year prior to the health checkup (n = 11,550) were also excluded. The final study population consisted of 718,306 participants (370,242 men and 348,604 women) who were followed-up for 7 years. We linked all 718,306 patients from the National Health Checkup database to the KNHIS database to track the fracture occurrence. The Institutional Review Board of Chung-Ang University Hospital reviewed and approved this study (IRB No. C201486 (1282)).
Clinical Risk Factor Assessment
Information on potentially significant clinical risk factors selected based on a reported associa-tion with osteoporotic fractures was obtained from self-administered quesassocia-tionnaires. The ques-tionnaire included questions about age, smoking status, alcohol consumption, and exercise (frequency and duration). The participants were classified as“current smokers”if they were currently smoking for at least 1 year,“nonsmokers”if they had never smoked, and“former smokers: if they had quit smoking. Total daily alcohol intake was measured by the number of glasses of“Soju”consumed per week. One glass of Soju contains about one unit of ethanol. The recommended amount suggested by the WHO is<5 units per day for men and 2.5 units per
day for women. In this study, five or more units for men and three or more units for women were considered high alcohol intake. Exercise was categorized as none, 1–2 times per week, 3–4 times per week and daily.
Height and body weight were measured with the subjects wearing light clothes. BMI was calculated as weight divided by height squared (kg/m2), and weight was stratified into the fol-lowing four categories; underweight,<18.5 kg/m2; normal, 18.5–22.9 kg/m2; overweight,
23.0–24.9 kg/m2; and obese,25.0 kg/m2[24].
Development of a Korean Fracture Risk Score (KFRS)
A history of recent fragility fracture, previous medication use, and other diseases that could cause osteoporosis were also investigated in the KNHIS database. The KNHIS data covers the entire population, including 97% of the population using health insurance and 3% who use medical aid[25]. All clinics and hospitals submit claims data for inpatient and outpatient care, including diagnoses (using the International Classification of Diseases, 10th revision [ICD-10] codes), procedures, prescription records, demographic information, and direct medical costs. Therefore, virtually all information about patients and their medical records are available. We analyzed the data from 2004 to 2006. History of a recent fragility fracture was defined if the fra-gility fracture (vertebrae, hip, upper arm, and wrist fracture) had occurred during the past two years before baseline. Recent use of an oral glucocorticoid was defined if it was prescribed for more than 30 days in the past year before baseline. The diagnosis of rheumatoid arthritis was defined if the subject visited the outpatient clinic more than twice or was admitted more than once using a related code in the 1 year before baseline. Pharmaceutical or medical conditions that cause secondary osteoporosis were also investigated. Medications included anticonvul-sants, anticoagulants (e g, warfarin and heparin), aromatase inhibitors, and a suppressive dose of thyroid hormone. Medical conditions included thyrotoxicosis, hyperparathyroidism, hyper-prolactinemia, hypopituitarism, Cushing’s syndrome, hypogonadism, r premature menopause (<45 years), chronic renal failure, chronic obstructive lung disease, bypass surgery, inflamma-tory bowel disease, multiple myeloma, and idiopathic hypercalciuria.
Outcomes
Our primary outcome was the first diagnosis of an osteoporotic fracture (hip, vertebral, upper arm, or wrist)[26]. We identified all claims records of outpatient visits or hospital admissions of patients from January 1, 2006 to December 31, 2013 in the KNHIS data. We used particular ICD-10 codes and procedures to identify osteoporosis-related fractures. [27,28]. These were hip (ICD-10 code S72.0 [fracture of the femoral neck], S72.1 [pertrochanteric fracture] and seven procedures [open reduction of fractured extremity-femur, closed pinning-femur, external fixa-tion-pelvis/femur, closed reduction of fractured extremity-pelvis/femur, bone traction, skin traction, hemiarthroplasty-hip]); spine (S22.0 [fracture of the thoracic spine], S22.1 [multiple fractures of the thoracic spine], S32.0 [fracture of the lumbar spine], M48.4 [fatigue fracture of vertebra] and M48.5 [collapsed vertebra, NEC]); distal radius (S52.5 [fracture of the distal radius] and S52.6 [combined fracture of the distal radius/ulna]); humerus (S42.2 [fracture of the proximal humerus] and S42.3 [fracture of shaft of humerus]); and overall any fractures[3]. Each fracture code had to be accompanied by a physician’s claim for site-specific fracture reduction or fixation (either open or closed) to enhance the specificity of the coding. The total number of men and women>50 years in the Korean population was obtained from Statistics Korea (http://www.kosis.kr/), which is the central governmental statistical organization.
Model Development and Validation
estimated using the Fine and Gray model by considering death as a competing risk in the modeling set. The risk might be overestimated in the predictive model using standard Cox’s proportional hazards regression model by treating death as a censored case because subjects with death events are considered as if they could have fracture in the future[29]. Therefore, the Fine and Gray model is used as the appropriate predictive model with competing risk. We fol-lowed each patient from the examination date in 2006 until the fracture or December 31, 2013. Patients who did not develop a fracture until the last day were censored. We considered pre-specified risk factors and all interaction terms in the predictive models.
Cumulative incidence function in the Fine and Gray model with k risk factors for time t (t = 7) was estimated for each sex using the following equation:
IðtjxÞ ¼1 expð exp½fðx;MÞSðtÞÞ
wheref(x,M) =β1(x1−M1)+β2(x2−M2)+ +βk(xk−Mk). Here,β1,β2, ,βkare regression coef-ficients;x1,x2, ,xkare risk factors for each individual;M1,M2, ,Mkare mean values for
each risk factor in the total cohort; andS(t) is the cumulative subdistribution baseline hazard at time t (t = 7). The mean follow-up period was 6.9 years in men and 6.6 years in women.
The proportionality assumptions in the Fine and Gray model for each variable were checked using Schoenfeld residuals plots. The subdistribution hazard ratios (sHRs) of the predictive model, 95% CIs, andp-values were presented.
The predictive accuracy for the occurrence of a fracture within a 7-year period was assessed for calibration and discrimination. We tested the performances of the final models using the validation dataset. Calibration or how closely the prediction reflected an actual event was assessed using the ratio of observed and predicted probabilities. We calculated observed proba-bilities using the cumulative incidence function estimate and the ratio of observed and pre-dicted probabilities in deciles. Discrimination or the ability to distinguish between those who experienced the event and those who did not was assessed using c-statistics for the survival model with competing risk[29,30]
All statistical analyses were performed using SAS ver. 9.4 (SAS Institute, Cary, NC, USA) and R package ver. 3.2.2.P-values<0.05 were considered significant.
Results
Baseline Characteristics of the Development and Validation Groups
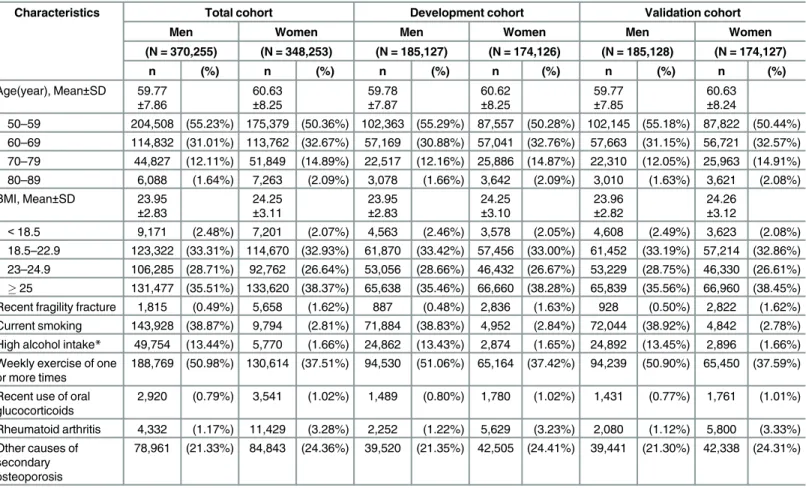
Overall, 718,306 subjects met the inclusion criteria, of which 50% were randomly assigned to the development dataset and the rest 50% were assigned to the validation dataset. The baseline characteristics of the two datasets are compared inTable 1. Mean age and BMI were similar between the two sexes. Clinical risk factors, such as current smoking, high alcohol intake, and one or more times of weekly exercise, were more common in men than those in women. How-ever, risk factors, such as a recent fragility fracture, recent use of an oral glucocorticoid, rheu-matoid arthritis, and other causes of secondary osteoporosis, were more common in women than those in men. Although the validation cohort was randomized as an independent group, the baseline characteristics were similar to those of the development cohort across all measures in men and women.
Fracture Incidence
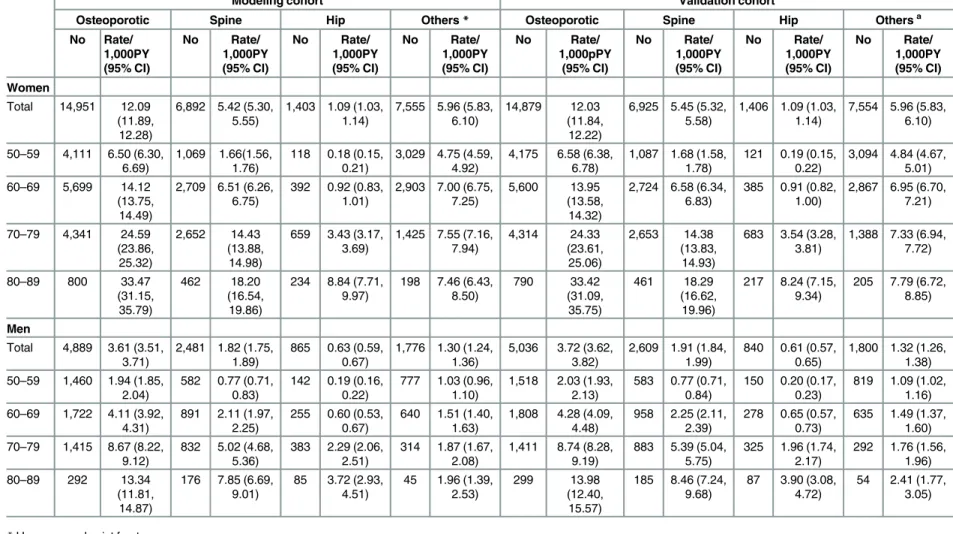
The incidence rates of osteoporotic fracture in each cohort are shown inTable 2. During the follow-up period, 19,840 new osteoporotic fractures (4,889 in men and 14,951 in women) were reported in the development cohort. Fracture incidences per 1000 person-years were 12.09
Development of a Korean Fracture Risk Score (KFRS)
(95% CI, 11.89–12.28) in women and 3.61 (95% CI, 3.51–3.71) in men. A total of 6,892 (46.1%) vertebral fractures, 1,403 (9.4%) hip fractures, and 7,555 (50.5%) humerus and wrist fractures occurred in women. In men, there were 2,481 (50.7%) vertebral fractures, 865 (19.3%) hip frac-tures, and 1,776 (39.6%) humerus and wrist fractures.
Incidence rates were higher in women than in men and rose steeply with age. In the devel-opment cohort, fracture incidence rates per 1000 person-years according to age were 1.94, 4.11, 8.67, and 13.34 for men aged 50–59, 60–69, 70–79, and 80–89 years, respectively. The corre-sponding fracture incidences in women were 6.5, 14.12, 24.59, and 33.47, respectively. Similar incidence rates were found in the validation cohort (Table 2).
Model Development
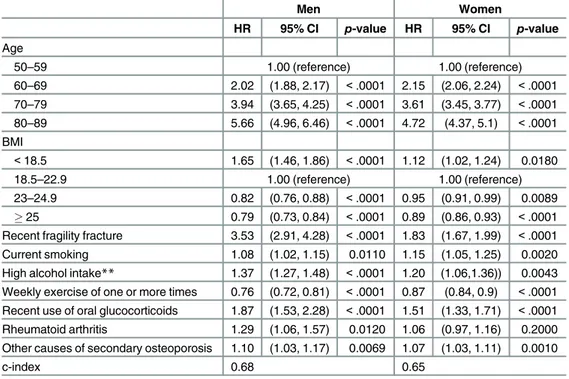
Results of the final Fine and Gray model for osteoporotic fractures in men and women are shown inTable 3. The interactions among all considered risk factors were tested. High daily alcohol intake and other causes of secondary osteoporosis were significant in the osteoporotic fracture prediction model for men. However, the coefficients and accuracy of the model with-out the interaction terms were similar to those of the model with interactions. Thus, the predic-tive models without the interactions were selected as the final models. There was no evidence that the proportionality assumption was not satisfied in any of these models.
Table 1. Baseline characteristics of the study population.
Characteristics Total cohort Development cohort Validation cohort
Men Women Men Women Men Women
(N = 370,255) (N = 348,253) (N = 185,127) (N = 174,126) (N = 185,128) (N = 174,127)
n (%) n (%) n (%) n (%) n (%) n (%)
Age(year), Mean±SD 59.77 ±7.86
60.63
±8.25
59.78
±7.87
60.62
±8.25
59.77
±7.85
60.63
±8.24
50–59 204,508 (55.23%) 175,379 (50.36%) 102,363 (55.29%) 87,557 (50.28%) 102,145 (55.18%) 87,822 (50.44%) 60–69 114,832 (31.01%) 113,762 (32.67%) 57,169 (30.88%) 57,041 (32.76%) 57,663 (31.15%) 56,721 (32.57%) 70–79 44,827 (12.11%) 51,849 (14.89%) 22,517 (12.16%) 25,886 (14.87%) 22,310 (12.05%) 25,963 (14.91%) 80–89 6,088 (1.64%) 7,263 (2.09%) 3,078 (1.66%) 3,642 (2.09%) 3,010 (1.63%) 3,621 (2.08%) BMI, Mean±SD 23.95
±2.83
24.25
±3.11
23.95
±2.83
24.25
±3.10
23.96
±2.82
24.26
±3.12
<18.5 9,171 (2.48%) 7,201 (2.07%) 4,563 (2.46%) 3,578 (2.05%) 4,608 (2.49%) 3,623 (2.08%)
18.5–22.9 123,322 (33.31%) 114,670 (32.93%) 61,870 (33.42%) 57,456 (33.00%) 61,452 (33.19%) 57,214 (32.86%) 23–24.9 106,285 (28.71%) 92,762 (26.64%) 53,056 (28.66%) 46,432 (26.67%) 53,229 (28.75%) 46,330 (26.61%)
25 131,477 (35.51%) 133,620 (38.37%) 65,638 (35.46%) 66,660 (38.28%) 65,839 (35.56%) 66,960 (38.45%) Recent fragility fracture 1,815 (0.49%) 5,658 (1.62%) 887 (0.48%) 2,836 (1.63%) 928 (0.50%) 2,822 (1.62%) Current smoking 143,928 (38.87%) 9,794 (2.81%) 71,884 (38.83%) 4,952 (2.84%) 72,044 (38.92%) 4,842 (2.78%) High alcohol intake* 49,754 (13.44%) 5,770 (1.66%) 24,862 (13.43%) 2,874 (1.65%) 24,892 (13.45%) 2,896 (1.66%) Weekly exercise of one
or more times
188,769 (50.98%) 130,614 (37.51%) 94,530 (51.06%) 65,164 (37.42%) 94,239 (50.90%) 65,450 (37.59%)
Recent use of oral glucocorticoids
2,920 (0.79%) 3,541 (1.02%) 1,489 (0.80%) 1,780 (1.02%) 1,431 (0.77%) 1,761 (1.01%)
Rheumatoid arthritis 4,332 (1.17%) 11,429 (3.28%) 2,252 (1.22%) 5,629 (3.23%) 2,080 (1.12%) 5,800 (3.33%) Other causes of
secondary osteoporosis
78,961 (21.33%) 84,843 (24.36%) 39,520 (21.35%) 42,505 (24.41%) 39,441 (21.30%) 42,338 (24.31%)
Table 2. Incidence of osteoporotic facture.
Modeling cohort Validation cohort
Osteoporotic Spine Hip Others* Osteoporotic Spine Hip Othersa
No Rate/ 1,000PY (95% CI) No Rate/ 1,000PY (95% CI) No Rate/ 1,000PY (95% CI) No Rate/ 1,000PY (95% CI) No Rate/ 1,000pPY (95% CI) No Rate/ 1,000PY (95% CI) No Rate/ 1,000PY (95% CI) No Rate/ 1,000PY (95% CI) Women
Total 14,951 12.09
(11.89, 12.28)
6,892 5.42 (5.30, 5.55)
1,403 1.09 (1.03, 1.14)
7,555 5.96 (5.83, 6.10)
14,879 12.03
(11.84, 12.22)
6,925 5.45 (5.32, 5.58)
1,406 1.09 (1.03, 1.14)
7,554 5.96 (5.83, 6.10)
50–59 4,111 6.50 (6.30, 6.69)
1,069 1.66(1.56, 1.76)
118 0.18 (0.15, 0.21)
3,029 4.75 (4.59, 4.92)
4,175 6.58 (6.38, 6.78)
1,087 1.68 (1.58, 1.78)
121 0.19 (0.15, 0.22)
3,094 4.84 (4.67, 5.01) 60–69 5,699 14.12
(13.75, 14.49)
2,709 6.51 (6.26, 6.75)
392 0.92 (0.83, 1.01)
2,903 7.00 (6.75, 7.25)
5,600 13.95
(13.58, 14.32)
2,724 6.58 (6.34, 6.83)
385 0.91 (0.82, 1.00)
2,867 6.95 (6.70, 7.21)
70–79 4,341 24.59 (23.86,
25.32)
2,652 14.43 (13.88,
14.98)
659 3.43 (3.17, 3.69)
1,425 7.55 (7.16, 7.94) 4,314 24.33 (23.61, 25.06) 2,653 14.38 (13.83, 14.93)
683 3.54 (3.28, 3.81)
1,388 7.33 (6.94, 7.72)
80–89 800 33.47
(31.15, 35.79)
462 18.20
(16.54, 19.86)
234 8.84 (7.71, 9.97)
198 7.46 (6.43, 8.50) 790 33.42 (31.09, 35.75) 461 18.29 (16.62, 19.96)
217 8.24 (7.15, 9.34)
205 7.79 (6.72, 8.85)
Men
Total 4,889 3.61 (3.51, 3.71)
2,481 1.82 (1.75, 1.89)
865 0.63 (0.59, 0.67)
1,776 1.30 (1.24, 1.36)
5,036 3.72 (3.62, 3.82)
2,609 1.91 (1.84, 1.99)
840 0.61 (0.57, 0.65)
1,800 1.32 (1.26, 1.38) 50–59 1,460 1.94 (1.85,
2.04)
582 0.77 (0.71, 0.83)
142 0.19 (0.16, 0.22)
777 1.03 (0.96, 1.10)
1,518 2.03 (1.93, 2.13)
583 0.77 (0.71, 0.84)
150 0.20 (0.17, 0.23)
819 1.09 (1.02, 1.16) 60–69 1,722 4.11 (3.92,
4.31)
891 2.11 (1.97, 2.25)
255 0.60 (0.53, 0.67)
640 1.51 (1.40, 1.63)
1,808 4.28 (4.09, 4.48)
958 2.25 (2.11, 2.39)
278 0.65 (0.57, 0.73)
635 1.49 (1.37, 1.60) 70–79 1,415 8.67 (8.22,
9.12)
832 5.02 (4.68, 5.36)
383 2.29 (2.06, 2.51)
314 1.87 (1.67, 2.08)
1,411 8.74 (8.28, 9.19)
883 5.39 (5.04, 5.75)
325 1.96 (1.74, 2.17)
292 1.76 (1.56, 1.96)
80–89 292 13.34
(11.81, 14.87)
176 7.85 (6.69, 9.01)
85 3.72 (2.93, 4.51)
45 1.96 (1.39, 2.53)
299 13.98
(12.40, 15.57)
185 8.46 (7.24, 9.68)
87 3.90 (3.08, 4.72)
54 2.41 (1.77, 3.05)
*Humerus and wrist fracture
We found significant associations between overall fracture risk and age, BMI, recent fragility fracture, current smoking, high alcohol intake, exercise, recent use of oral glucocorticoids and other causes of secondary osteoporosis in both men and women after adjusting for all other variables in the models.
Age was the strongest predictor of any new fracture. Advanced age showed a trend of increased fracture risk. With the exception of age, recent fragility fracture and recent use of glu-cocorticoids were associated with the highest predicted 7-year risk of osteoporotic fracture: the hazard ratio (HR) was 3.53 and 1.87 in men 1.83 and 1.51 in women, respectively. Other risk factors listed in decreasing order of impact on fracture risk were BMI<18.5 kg/m2, high alco-hol intake, rheumatoid arthritis, secondary osteoporosis, and current smoking. Overweight, obesity and exercise at least once per week were protective factors for osteoporotic fracture risk, with HR of 0.82, 0.78 and 0.76 in men and 0.95, 0.89 and 0.87 in women, respectively. Rheumatoid arthritis was significantly associated with risk of osteoporotic fracture in men but not in women. The magnitude and direction of the coefficient was similar to those for overall risk of fracture, so it was included in the final osteoporotic fracture models for consistency.
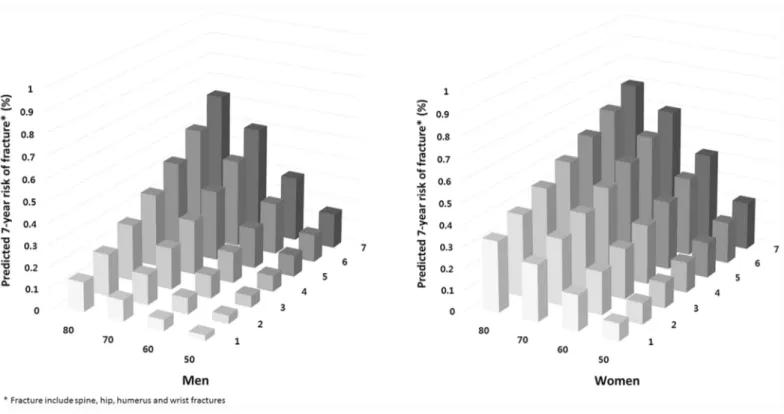
The impact of age on the risk of osteoporotic fracture was analyzed.Table 4shows the 7-year fracture probability of various risk factors and how they were affected by age and sex. BMI is held constant in the normal range. As expected, the fracture risk increased with age in the absence of any clinical risk factors. The presence of any single risk factor increased fracture risk. The contributions of recent fragility fracture and recent use of oral glucocorticoid were attenuated with advancing age and were higher in men than in women.Fig 1shows that the risk of major osteoporotic fractures was increased with increasing number of risk factors and
Table 3. Hazard ratios (HR) for fracture*risk factors in men and women in the modeling cohort.
Men Women
HR 95% CI p-value HR 95% CI p-value
Age
50–59 1.00 (reference) 1.00 (reference)
60–69 2.02 (1.88, 2.17) <.0001 2.15 (2.06, 2.24) <.0001 70–79 3.94 (3.65, 4.25) <.0001 3.61 (3.45, 3.77) <.0001 80–89 5.66 (4.96, 6.46) <.0001 4.72 (4.37, 5.1) <.0001
BMI
<18.5 1.65 (1.46, 1.86) <.0001 1.12 (1.02, 1.24) 0.0180
18.5–22.9 1.00 (reference) 1.00 (reference)
23–24.9 0.82 (0.76, 0.88) <.0001 0.95 (0.91, 0.99) 0.0089
25 0.79 (0.73, 0.84) <.0001 0.89 (0.86, 0.93) <.0001
Recent fragility fracture 3.53 (2.91, 4.28) <.0001 1.83 (1.67, 1.99) <.0001 Current smoking 1.08 (1.02, 1.15) 0.0110 1.15 (1.05, 1.25) 0.0020 High alcohol intake** 1.37 (1.27, 1.48) <.0001 1.20 (1.06,1.36)) 0.0043
Weekly exercise of one or more times 0.76 (0.72, 0.81) <.0001 0.87 (0.84, 0.9) <.0001
Recent use of oral glucocorticoids 1.87 (1.53, 2.28) <.0001 1.51 (1.33, 1.71) <.0001 Rheumatoid arthritis 1.29 (1.06, 1.57) 0.0120 1.06 (0.97, 1.16) 0.2000 Other causes of secondary osteoporosis 1.10 (1.03, 1.17) 0.0069 1.07 (1.03, 1.11) 0.0010
c-index 0.68 0.65
BMI = body mass index
*Fracture include spine, hip, humerus and wrist fractures
Table 4. 7- year osteoporotic fracture risk*with normal BMI according to age and the absence or presence of single clinical risk factors.
50 60 70 80
Men
None 2.14 4.27 8.16 11.51
Recent fragility fracture 7.35 14.29 25.98 35.07
Current smoking 2.31 4.61 8.8 12.38
High alcohol intake* 2.93 5.82 11.04 15.46
Weekly exercise of one or more times 1.63 3.27 6.28 8.89
Recent use of oral glucocorticoids 3.95 7.82 14.69 20.4
Rheumatoid arthritis 2.75 5.47 10.39 14.57
Other causes of secondary osteoporosis 2.34 4.68 8.92 12.56
Women
None 7.49 15.41 24.48 30.75
Recent fragility fracture 13.24 26.32 40.1 48.87
Current smoking 8.5 17.39 27.42 34.26
High alcohol intake* 8.9 18.17 28.57 35.62
Weekly exercise of one or more times 6.51 13.49 21.58 27.25
Recent use of oral glucocorticoids 11.08 22.32 34.54 42.57
Rheumatoid arthritis 7.91 16.25 25.73 32.25
Other causes of secondary osteoporosis 7.97 16.35 25.89 32.44
*Fracture include spine, hip, humerus and wrist fractures doi:10.1371/journal.pone.0158918.t004
Fig 1. 7- year osteoporotic fracture risk for Koreans according to age and number of risk fractors.
doi:10.1371/journal.pone.0158918.g001
Development of a Korean Fracture Risk Score (KFRS)
age in men and women. Fracture probability at an advanced age was increased markedly with more risk factors.
Validation of the KFRS
The mean predicted scores after applying the KFRS with the observed risks at 7 years within each 10th of predicted risk were compared to assess calibration of the models in the validation sample (Fig 2). Close correspondence was observed between predicted and observed 7 year risks within each model 10thfor overall fracture. For example, in the top 10th of risk in women, the mean predicted 7-year risk of fracture was 19.06%, and the observed risk was 19.05%. The ratio of predicted risk to observed risk in this 10thwas 0.999, indicating almost perfect calibra-tion (a ratio of 1 indicates perfect calibracalibra-tion, that is, no underestimacalibra-tion or overestimacalibra-tion). In men, the predicted event calculated from the KFRS in the top 10thwas slightly higher than the observed event (observed/predicted ratio: 0.964). The C statistics for the KFRS in the vali-dation cohort were 0.68 for men and 0.65 for women, indicating that the discriminatory power of the KFRS is moderate.
Discussion
Using data from a nationwide retrospective cohort of Korean men and women aged50 years, we developed a novel predictive model called the KFRS to provide an easy method to estimate individual risk of osteoporotic fracture based on routinely available clinical informa-tion. More than 19,840 osteoporotic fractures occurred in the development cohort of more than 359,253 Koreans during the 7 years. The KFRS was developed based on these data. Our new model does not require laboratory testing or clinical measurements. All variables used in the model were collected from self-administered questionnaires that could be easily obtained from an individual at a primary care setting. The risk factors included age, BMI, history of recent fragility fracture, lack of regular exercise, higher alcohol intake, current smoking, recent use of oral glucocorticoid, history of rheumatoid arthritis, and use of medication or disease causing a low BMD. This model performed well when compared to the actual osteoporotic
Fig 2. Predicted and observed risk for osteoporotic fracture at 7 years by 10thof predicted risk using KFRS in the validation cohort.
fracture cases in an independent sample cohort from which data had not been used to develop the algorithm. Previous studies related to osteoporotic fracture risk in Asian populations have been small community cohort studies [21,22]. Our study may be the first nationwide study using an Asian cohort to develop a new risk prediction model.
Our new model can be used at a population level to identify high risk patients and support the clinical guidelines in Korea. The algorithm can be used for self-assessment at a web based calculator (http://www.nhis.or.kr) without BMD measurement. It can help inform patients regarding their absolute risk, so they can recognize the need for treatment. Current threshold interventional approaches based on BMD in Korea may result in under-treatment of high risk osteopenic patients. Further study is required to determine the threshold of individual absolute risk at which intervention will become cost-effective.
Most risk factors for fracture identified in the present study have also been identified in sev-eral recent meta-analyses of other population-specific cohorts [7,8,13,31,32]. Age contributes to fracture risk independently of BMD, and changes in age are approximately seven-fold more important than changes in BMD in another ethnic cohort [31]. In the present study, HRs were 5.66 and 4.72 for men and women aged 80–89 years, respectively, compared to those aged 50–
59 years. Although only 2.3% of the cohort had a BMI<18.5 kg/m2, it was identified as a
sig-nificant independent risk factor for fracture. The mean BMI of the study participants was 23.9 kg/m2in men and 24.3 kg/m2in women, which was within the overweight BMI range for adult Asian women[24].
Recent fragility fracture was the strongest predictor of osteoporotic fracture after adjusting for age and BMI, confirming the results of earlier studies showing that a history of fracture at any site significantly increases the risk of future fracture[13,33]. Kanis et al. have reported that osteoporotic fracture risk increases approximately two-fold in subjects with a previous fracture compared with those without a previous fracture in a meta-analysis[13]. No difference in the risk ratio was detected between men and women. In addition, other studies in postmenopausal women have found that the risk of subsequent vertebral fracture within 1 year of the original event is up to five times[34]. In our study population, the HR in men was higher than in other studies. In addition, a significant difference was detected between men and women (HR, 3.53 in men and 1.83 in women). Because we analyzed the history of fragility fracture within the past 2 years, HR for subsequent fracture could be higher than in other studies despite the low prevalence. However, the reason for the higher HR of recent fragility fracture in men remains unclear. As most studies have been conducted in women, further studies targeting men are needed.
Long-term use of corticosteroids is a known risk factor for fracture[12]. The range of RR for osteoporotic fracture is 2.63–1.71 in Western societies. In our study population, the hazard ratio was slightly lower (HR, 1.87 in men and 1.51 in women). High alcohol intake confers a significant risk of future fracture. In a Caucasian study, alcohol intake of more than 4 units per day increased the osteoporotic fracture risk (HR, 1.81 in men and 1.38 in women) [8]. In our study, high alcohol intake (5 units/day in men and3 units/day in women) had a similar risk (HR, 1.37 in men and 1.2 in women). Current smoking is associated with significantly increased risk of osteoporotic fractures in both men and women, with risk being significantly higher in men than in women [10]. However, in our study, the risk was higher in women than in men (HR, 1.08 in men and 1.15 in women). Other contributing risk factors, such as lack of exercise[32], rheumatoid arthritis[31], and secondary osteoporosis[35] had slightly lower HRs compared to those of previous studies. Rheumatoid arthritis has been previously identified as a significant risk factor for any fracture[12], but it was significant only in men in this study. Eth-nic group differences and other population-specific variables may be responsible for discrepan-cies between the results of our study and those of previous studies in other cohorts. Some
Development of a Korean Fracture Risk Score (KFRS)
variables known to be clinical risk factors for fracture in previous Korean and other Asian cohorts[21,22] were not identified in the present study, including menopause, consumption of dairy products, history of one or more falls in 12 months, use of walking aids, and being housebound.
We did not include BMD as a result because it was not captured in the registry data. Our findings indicate that using clinical risk factors is sufficient to predict the risk of fracture. Add-ing BMD to the risk factor assessment would improve the osteoporotic fracture prediction. However, a recent review on the performance of osteoporosis absolute fracture risk assessment instruments by Nayak et al.[36] has reported that risk assessment instruments without BMD component have good calibration, similar to the proportion of risk assessment instruments with a BMD component. Therefore, the probability of fracture predicted from a risk factor assessment alone is sufficient enough to identify high risk patients who need treatment from subjects who have a combination of independent risk factors with high predictive value, such as history of fracture, advanced age, and low BMI. A risk factor assessment provides a far more amenable option than measuring BMD, particularly at primary care setting that often has lim-ited access to dual-energy X-ray absorptiometry technology. However, clinical trials are needed to demonstrate that anti-osteoporosis drug treatment can prevent fractures in women selected for therapy based on these clinical risk factors alone.
A particular strength of our study is its nationwide cohort design based on an analysis of a large representative population from a validated database. Our main outcome was hip, verte-bral, humeral, or distal radial fracture recorded by a clinician. Osteoporotic fracture incidence per 1000 person-years in our study was 3.61 in men and 12.09 in women. Our previous study using registry data including nationwide information compiled by the Korean government reported that the fracture incidence per 1000 subjects was 6.31 in men and 20.53 in women aged50 years in 2012 (submitted data). Our rates of hip fracture were also lower than those reported in other studies using nationwide registry data[27]. This difference might be due to different operational definitions of fracture. In our study, we not only used ICD-10 codes but also used site-specific fracture reduction or fixation to identify osteoporotic fractures. There-fore, there might have been some over-estimates in previous studies because they only used ICD codes. The lower fracture incidence in our study may have resulted from characteristics of our cohort. Our study was aimed at subjects who had regular health screening and who com-pleted a self-questionnaire. Therefore, we might have excluded subjects admitted to a nursing facility or acute-care hospital and those who had serious disease causing immobilization, such as stroke, Parkinson’s disease, and cancer; i.e. high risk subgroup for osteoporotic fracture. Our subjects were relatively healthy and had paid more attention to their health.
not detect asymptomatic vertebral fractures. Therefore, fracture risk might have been underes-timated due to the restrictive definition of a clinical vertebral fracture.
In conclusion, we developed the KFRS as a novel predictive model to predict the risk of oste-oporotic fracture over 7 years in Koreans. The three most important risk factors for osteoste-oporotic fracture in Koreans were advanced age, history of recent fragility fracture, and recent use of oral glucocorticoids. Our model will allow optimal risk assessment to identify Korean patients who would obtain the greatest benefit from treatment. It will be particularly useful in primary-care settings where there is limited access to instruments for measuring BMD. Further studies are needed to test the performance of our model in other Korean populations and to determine the interventional threshold based on the fracture probability in the Korean population.
Acknowledgments
The National Health Insurance Claims Database and National Health Checkup Database were provided by the National Health Insurance Service (NHIS) of Korea. The authors would like to thank the National Health Insurance Service for cooperation. This study was supported by a grant (grant number: HI13C1522) of the Korea Health Technology R&D Project through the Korea Health Industry Development Institute (KHIDI), funded by the Ministry of Health & Welfare, Republic of Korea.
Author Contributions
Conceived and designed the experiments: YCH SMJ. Performed the experiments: HYK EJJ. Analyzed the data: EJJ BJP. Contributed reagents/materials/analysis tools: TYK SAS. Wrote the paper: HYK EJJ.
References
1. Consensus development conference: diagnosis, prophylaxis, and treatment of osteoporosis. Am J Med. 1993; 94(6):646–50. PMID:8506892.
2. Cooper C, Campion G, Melton LJ 3rd. Hip fractures in the elderly: a world-wide projection. Osteoporosis international: a journal established as result of cooperation between the European Foundation for Oste-oporosis and the National OsteOste-oporosis Foundation of the USA. 1992; 2(6):285–9. PMID:1421796.
3. Park C, Ha YC, Jang S, Jang S, Yoon HK, Lee YK. The incidence and residual lifetime risk of osteopo-rosis-related fractures in Korea. J Bone Miner Metab. 2011; 29(6):744–51. doi: 10.1007/s00774-011-0279-3PMID:21644058.
4. Johnell O, Kanis JA, Oden A, Johansson H, De Laet C, Delmas P, et al. Predictive value of BMD for hip and other fractures. Journal of bone and mineral research: the official journal of the American Society for Bone and Mineral Research. 2005; 20(7):1185–94. doi:10.1359/JBMR.050304PMID:15940371.
5. Kanis JA, Black D, Cooper C, Dargent P, Dawson-Hughes B, De Laet C, et al. A new approach to the development of assessment guidelines for osteoporosis. Osteoporosis international: a journal estab-lished as result of cooperation between the European Foundation for Osteoporosis and the National Osteoporosis Foundation of the USA. 2002; 13(7):527–36. doi:10.1007/s001980200069PMID: 12111012.
6. Black DM, Steinbuch M, Palermo L, Dargent-Molina P, Lindsay R, Hoseyni MS, et al. An assessment tool for predicting fracture risk in postmenopausal women. Osteoporosis international: a journal estab-lished as result of cooperation between the European Foundation for Osteoporosis and the National Osteoporosis Foundation of the USA. 2001; 12(7):519–28. doi:10.1007/s001980170072PMID: 11527048.
7. De Laet C, Kanis JA, Oden A, Johanson H, Johnell O, Delmas P, et al. Body mass index as a predictor of fracture risk: a meta-analysis. Osteoporosis international: a journal established as result of coopera-tion between the European Foundacoopera-tion for Osteoporosis and the Nacoopera-tional Osteoporosis Foundacoopera-tion of the USA. 2005; 16(11):1330–8. doi:10.1007/s00198-005-1863-yPMID:15928804.
8. Kanis JA, Johansson H, Johnell O, Oden A, De Laet C, Eisman JA, et al. Alcohol intake as a risk factor for fracture. Osteoporosis international: a journal established as result of cooperation between the European Foundation for Osteoporosis and the National Osteoporosis Foundation of the USA. 2005; 16(7):737–42. doi:10.1007/s00198-004-1734-yPMID:15455194.
Development of a Korean Fracture Risk Score (KFRS)
9. Kanis JA, Johansson H, Oden A, De Laet C, Johnell O, Eisman JA, et al. A meta-analysis of milk intake and fracture risk: low utility for case finding. Osteoporosis international: a journal established as result of cooperation between the European Foundation for Osteoporosis and the National Osteoporosis Foundation of the USA. 2005; 16(7):799–804. doi:10.1007/s00198-004-1755-6PMID:15502959.
10. Kanis JA, Johnell O, Oden A, Johansson H, De Laet C, Eisman JA, et al. Smoking and fracture risk: a meta-analysis. Osteoporosis international: a journal established as result of cooperation between the European Foundation for Osteoporosis and the National Osteoporosis Foundation of the USA. 2005; 16(2):155–62. doi:10.1007/s00198-004-1640-3PMID:15175845.
11. Kanis JA, Johansson H, Oden A, Johnell O, De Laet C, Eisman JA, et al. A family history of fracture and fracture risk: a meta-analysis. Bone. 2004; 35(5):1029–37. doi:10.1016/j.bone.2004.06.017PMID: 15542027.
12. Kanis JA, Johansson H, Oden A, Johnell O, de Laet C, Melton IL, et al. A meta-analysis of prior cortico-steroid use and fracture risk. Journal of bone and mineral research: the official journal of the American Society for Bone and Mineral Research. 2004; 19(6):893–9. doi:10.1359/JBMR.040134PMID: 15125788.
13. Kanis JA, Johnell O, De Laet C, Johansson H, Oden A, Delmas P, et al. A meta-analysis of previous fracture and subsequent fracture risk. Bone. 2004; 35(2):375–82. doi:10.1016/j.bone.2004.03.024 PMID:15268886.
14. Kanis JA, Oden A, Johnell O, Johansson H, De Laet C, Brown J, et al. The use of clinical risk factors enhances the performance of BMD in the prediction of hip and osteoporotic fractures in men and women. Osteoporosis international: a journal established as result of cooperation between the Euro-pean Foundation for Osteoporosis and the National Osteoporosis Foundation of the USA. 2007; 18 (8):1033–46. doi:10.1007/s00198-007-0343-yPMID:17323110.
15. Hippisley-Cox J, Coupland C. Predicting risk of osteoporotic fracture in men and women in England and Wales: prospective derivation and validation of QFractureScores. Bmj. 2009; 339:b4229. doi:10. 1136/bmj.b4229PMID:19926696; PubMed Central PMCID: PMC2779855.
16. Nguyen ND, Frost SA, Center JR, Eisman JA, Nguyen TV. Development of a nomogram for individual-izing hip fracture risk in men and women. Osteoporosis international: a journal established as result of cooperation between the European Foundation for Osteoporosis and the National Osteoporosis Foun-dation of the USA. 2007; 18(8):1109–17. doi:10.1007/s00198-007-0362-8PMID:17370100.
17. Nguyen ND, Frost SA, Center JR, Eisman JA, Nguyen TV. Development of prognostic nomograms for individualizing 5-year and 10-year fracture risks. Osteoporosis international: a journal established as result of cooperation between the European Foundation for Osteoporosis and the National Osteoporo-sis Foundation of the USA. 2008; 19(10):1431–44. doi:10.1007/s00198-008-0588-0PMID:18324342.
18. Sambrook PN, Flahive J, Hooven FH, Boonen S, Chapurlat R, Lindsay R, et al. Predicting fractures in an international cohort using risk factor algorithms without BMD. Journal of bone and mineral research: the official journal of the American Society for Bone and Mineral Research. 2011; 26(11):2770–7. doi: 10.1002/jbmr.503PMID:21887705; PubMed Central PMCID: PMC4881744.
19. Cummins NM, Poku EK, Towler MR, O'Driscoll OM, Ralston SH. clinical risk factors for osteoporosis in Ireland and the UK: a comparison of FRAX and QFractureScores. Calcified tissue international. 2011; 89(2):172–7. doi:10.1007/s00223-011-9504-2PMID:21647704.
20. Bolland MJ, Siu AT, Mason BH, Horne AM, Ames RW, Grey AB, et al. Evaluation of the FRAX and Gar-van fracture risk calculators in older women. Journal of bone and mineral research: the official journal of the American Society for Bone and Mineral Research. 2011; 26(2):420–7. doi:10.1002/jbmr.215PMID: 20721930.
21. Lee SH, Khang YH, Lim KH, Kim BJ, Koh JM, Kim GS, et al. Clinical risk factors for osteoporotic frac-ture: a population-based prospective cohort study in Korea. Journal of bone and mineral research: the official journal of the American Society for Bone and Mineral Research. 2010; 25(2):369–78. doi:10. 1359/jbmr.090722PMID:19594298.
22. Kung AW, Lee KK, Ho AY, Tang G, Luk KD. Ten-year risk of osteoporotic fractures in postmenopausal Chinese women according to clinical risk factors and BMD T-scores: a prospective study. Journal of bone and mineral research: the official journal of the American Society for Bone and Mineral Research. 2007; 22(7):1080–7. doi:10.1359/jbmr.070320PMID:17371165.
23. Barrett-Connor E, Siris ES, Wehren LE, Miller PD, Abbott TA, Berger ML, et al. Osteoporosis and frac-ture risk in women of different ethnic groups. Journal of bone and mineral research: the official journal of the American Society for Bone and Mineral Research. 2005; 20(2):185–94. doi:10.1359/JBMR. 041007PMID:15647811.
25. Yoon HK, Park C, Jang S, Jang S, Lee YK, Ha YC. Incidence and mortality following hip fracture in Korea. J Korean Med Sci. 2011; 26(8):1087–92. doi:10.3346/jkms.2011.26.8.1087PMID:21860561; PubMed Central PMCID: PMC3154346.
26. Yoo JH, Moon SH, Ha YC, Lee DY, Gong HS, Park SY, et al. Osteoporotic Fracture: 2015 Position Statement of the Korean Society for Bone and Mineral Research. J Bone Metab. 2015; 22(4):175–81. doi:10.11005/jbm.2015.22.4.175PMID:26713308; PubMed Central PMCID: PMC4691591.
27. Lim S, Koo BK, Lee EJ, Park JH, Kim MH, Shin KH, et al. Incidence of hip fractures in Korea. J Bone Miner Metab. 2008; 26(4):400–5. doi:10.1007/s00774-007-0835-zPMID:18600408.
28. Lippuner K. [Epidemiology of osteoporotic fractures in Switzerland]. Rev Med Suisse. 2009; 5 (207):1304–8. PMID:19626929.
29. Wolbers M, Blanche P, Koller MT, Witteman JC, Gerds TA. Concordance for prognostic models with competing risks. Biostatistics. 2014; 15(3):526–39. doi:10.1093/biostatistics/kxt059PMID:24493091; PubMed Central PMCID: PMC4059461.
30. Wolbers M, Koller MT, Witteman JC, Steyerberg EW. Prognostic models with competing risks: methods and application to coronary risk prediction. Epidemiology. 2009; 20(4):555–61. doi:10.1097/EDE. 0b013e3181a39056PMID:19367167.
31. Kanis JA, Borgstrom F, De Laet C, Johansson H, Johnell O, Jonsson B, et al. Assessment of fracture risk. Osteoporosis international: a journal established as result of cooperation between the European Foundation for Osteoporosis and the National Osteoporosis Foundation of the USA. 2005; 16(6):581– 9. doi:10.1007/s00198-004-1780-5PMID:15616758.
32. Gregg EW, Cauley JA, Seeley DG, Ensrud KE, Bauer DC. Physical activity and osteoporotic fracture risk in older women. Study of Osteoporotic Fractures Research Group. Annals of internal medicine. 1998; 129(2):81–8. PMID:9669990.
33. Klotzbuecher CM, Ross PD, Landsman PB, Abbott TA 3rd, Berger M. Patients with prior fractures have an increased risk of future fractures: a summary of the literature and statistical synthesis. Journal of bone and mineral research: the official journal of the American Society for Bone and Mineral Research. 2000; 15(4):721–39. doi:10.1359/jbmr.2000.15.4.721PMID:10780864.
34. Lindsay R, Silverman SL, Cooper C, Hanley DA, Barton I, Broy SB, et al. Risk of new vertebral fracture in the year following a fracture. JAMA. 2001; 285(3):320–3. PMID:11176842.
35. Kanis JA, Burlet N, Cooper C, Delmas PD, Reginster JY, Borgstrom F, et al. European guidance for the diagnosis and management of osteoporosis in postmenopausal women. Osteoporosis international: a journal established as result of cooperation between the European Foundation for Osteoporosis and the National Osteoporosis Foundation of the USA. 2008; 19(4):399–428. doi: 10.1007/s00198-008-0560-zPMID:18266020; PubMed Central PMCID: PMC2613968.
36. Nayak S, Edwards DL, Saleh AA, Greenspan SL. Performance of risk assessment instruments for pre-dicting osteoporotic fracture risk: a systematic review. Osteoporosis international: a journal established as result of cooperation between the European Foundation for Osteoporosis and the National Osteopo-rosis Foundation of the USA. 2014; 25(1):23–49. doi:10.1007/s00198-013-2504-5PMID:24105431; PubMed Central PMCID: PMC3962543.
Development of a Korean Fracture Risk Score (KFRS)