T. Itoh et alii, Frattura ed Integrità Strutturale, 34 (2015) 487-497; DOI: 10.3221/IGF-ESIS.34.54
487
Focussed on Crack Paths
Crack mode and life of Ti-6Al-4V under multiaxial low cycle fatigue
Takamoto Itoh, Masao Sakane
Department of Mechanical Engineering, College of Science & Engineering, Ritsumeikan University, Japan [email protected], [email protected]
Takahiro Morishita
Graduate School of Science & Engineering, Ritsumeikan University, Japan [email protected]
Hiroshi Nakamura
Engine Technology Department, Aero-Engine & Space Operation, IHI Corporation, Japan [email protected]
Masahiro Takanashi
Structural Strength Department, Research Laboratory, IHI Corporation, Japan [email protected]
ABSTRACT. This paper studies multiaxial low cycle fatigue crack mode and failure life of Ti-6Al-4V. Stress controlled fatigue tests were carried out using a hollow cylinder specimen under multiaxial loadings of =0, 0.4, 0.5 and 1 of which stress ratio R=0 at room temperature. is a principal stress ratio and is defined as =II/I,
where I and II are principal stresses of which absolute values take the largest and middle ones, respectively.
Here, the test at =0 is a uniaxial loading test and that at =1 an equi-biaxial loading test. A testing machine employed is a newly developed multiaxial fatigue testing machine which can apply push-pull and reversed torsion loadings with inner pressure onto the hollow cylinder specimen. Based on the obtained results, this study discusses evaluation of the biaxial low cycle fatigue life and crack mode. Failure life is reduced with increasing induced by cyclic ratcheting. The crack mode is affected by the surface condition of cut-machining and the failure life depends on the crack mode in the multiaxial loading largely.
KEYWORDS. Ti-6Al-4V; Low cycle fatigue; Multiaxial loading; Crack mode; Hollow cylinder specimen; Inner pressure
INTRODUCTION
i-6Al-4V is frequently used as a material in rotating aero engines because it has the properties of high strength, light weight, and excellent corrosion resistance. A rotating aero engine receives cyclic loading under thermal and mechanical stresses which cause multiaxial low cycle fatigue. Under non-proportional loading in which the
T. Itoh et alii, Frattura ed Integrità Strutturale, 34 (2015) 487-497; DOI: 10.3221/IGF-ESIS.34.54
488
principal directions of stress and strain are changed cyclically, previous studies have reported a drastic reduction in the failure life with accompanying additional cyclic hardening [1-16] depending on both the loading path and the material [6, 8, 10, 13, 16]. In addition, some studies about the fatigue property of Ti alloys have been reported [17, 18]. Meanwhile, only a paper by the authors [19] has dealt with multiaxial low cycle fatigue crack behavior of Ti-6Al-4V.
To evaluate fatigue lives under multiaxial loading conditions, multiaxial fatigue models which relate fatigue lives to uniaxial fatigue properties have been established. Equivalent strains and stresses based on the theories of von Mises and Tresca, which are considered the most commonly used theory, but lead to significant overestimation of fatigue lives under non-proportional loadings from those under non-proportional loading. Therefore, other life evaluation models have been proposed such as critical plane approaches; i) Stress based critical plane approaches presented by Findley [20] and McDiarmid [21], ii) Strain based critical plane approach by Brown and Miller [22] and Wang and Brown [23], iii) Strain-stress based critical plane approaches by Fatemi and Socie [7, 15] and Smith, Watson and Topper [24]. Most of these models are success on
life evaluation under non-proportional loadings, however, some of them have some limitation on application. Itoh et al. [8,
10, 13, 16] proposed a strain parameter taking into account the loading path and material dependencies of life, which shows good correlations with lives under non-proportional loadings for different materials [16]. The studies mentioned above treat the fatigue properties under limited multiaxial loadings of which the principal stress ratio range is –1≤
(= II/ I)≤0, where I is the principal stress whose absolute value is the maximum and II one of which absolute value the
middle. The reason why the performable principal stress ratio range was limited to 1≤ ≤0 mainly due to the testing
method to apply the axial and twist loads to hollow cylinder specimens. However, to carry out the multiaxial fatigue test beyond the principal stress ratio range, special multiaxial fatigue testing stands must be required. The authors developed a new testing machine which can apply push-pull and reversed torsion loadings and additionally inner pressure onto the
hollow cylinder specimen to perform the test in 1 1 under proportional and non-proportional loadings.
In this study, biaxial fatigue tests of the stress ratio range 0≤ ≤1 were carried out using the hollow cylinder specimen of Ti-6Al-4V by the developed multiaxial fatigue testing machine and properties of failure life and crack mode are discussed.
MULTIAXIAL LOADING AND TESTING MACHINE
Definition of stress and strain multiaxiality
ultiaxial stress and strain states can be expressed by using parameters, and φ which are the stress and the
strain ratios, as equated in Eq. (1) and Eq. (2),
(1)
(2)
where and are axial and shear stresses and and are axial and shear strains in plane stress state.
Besides the method above, this paper also employs principal stress ratio, , and the principal strain ratio, , to define
multiaxial stress and strain states, which are equated in Eq. (3) and Eq. (4),
II
I
(3)
II
I
(4)
where I and II are put as principal stresses, 1, 2 or 3 (123) of which absolute values takes the largest and
middle ones, e.g., if 1=100MP, 2=50MP and 3=200MP, I=200MPa and II=100MPa since |3||1||2|. On
the other hand, I and II are principal strains of which principal direction corresponding to those of I and II,
T. Itoh et alii, Frattura ed Integrità Strutturale, 34 (2015) 487-497; DOI: 10.3221/IGF-ESIS.34.54
489
respectively. In proportional fatigue test, and have constant values in a cycle. For tension-compression tests using the
hollow cylinder specimen, relationships among 1, 3, , and ε1, ε3, ε, γ are shown in Eq. (5) and Eq. (6).
1 2 2
3 1 4 2 2
(5)
21 2 2
3 1 1 1 2 2 (6)
In Eq. (6), ν is the Poisson’s ratio. Usually, the value of Poisson’s ratio is around 0.3 in elastic regime but it is 0.5 in a fully
plastic regime.
Uniaxial and multiaxial stress and strain states
A stress state is defined as multiaxial state if the multiple principal stresses operate and a strain state as multiaxial state when the multiple principal strains do. Using these definitions, the multiaxial stress state does not always correspond to the multiaxial strain state. For example, Fig. 1, an uniaxial tension loading is the uniaxial stress state because only one principal stress operates in tensile direction but this case becomes the multiaxial strain state because the two additional principal strains are caused by the lateral contraction as well as the tensile direction. These definitions of multiaxiality are most consistent for describing the multiaxial stress and strain states compared to using the other stress and strain components, whereas stress multiaxiality does not always correspond to strain multiaxiality.
Non-proportional loading is defined as the loading where the directions of the principal stresses or strains rotate, and proportional loading when they are fixed.
Applied
load Principal stress Principal strain Applied
load Principal stress Principal strain
Figure 1: Principal stress and principal strain in tension loading.
t 1 t 1
3=-1
t 1 1 x
y t
1
1 y
x
Uniaxial loading Multiaxial loading
Tension-compression Reversed torsion
Tension-compression and
reversed torsion Biaxial tension-compression
Princ ipa l s tress stat e Applied stre ss Type
Principal stress directions are fixed
= 0.5 = 1 = 10 = 11
t
1
-1
t
1
-1
t
1
1
x
y t
1
1 y
x
Uniaxial loading Multiaxial loading
Pr in cipa l st ra in st at e Ap plie d st ra in Type
Principal strain directions are fixed
= 0.5 = 1 = 1 = 11
Tension-compression Reversed torsion
Tension-compression and reversed torsion Biaxial tension-compression (a) (b)
Figure 2: Applied stresses/strains and stress/strain multiaxiality in proportional loading. (a) Stress state, (b) Strain state.
Proportional loading
Figs. 2 (a) and (b) summarize the applied stresses/strains and the stress/strain multiaxiality in various proportional
T. Itoh et alii, Frattura ed Integrità Strutturale, 34 (2015) 487-497; DOI: 10.3221/IGF-ESIS.34.54
490
to the specimen in Fig. 2 (a) and a uniaxial strain () is applied to the specimen but the multiple principal strains arise in
the specimen thickness direction in Fig. 2 (b). The lateral strain is is applied to the specimen. In the reversed torsion
test, the applied stress/strain is only the shear stress/stress (/) but the two principal stresses/strains with the opposite
sign are caused in this case. So, the reversed torsion test also becomes a multiaxial test. The combined tension-torsion and the biaxial tension-compression loadings also enable the fatigue test in multiaxial strain states. The former test only covers
the stress/strain biaxiality for 10/1 but the latter test does 1, 1.
Non-proportional loading
Fig. 3 shows the tension-compression and reversed torsion testing and the biaxial tension-compression testing with phase shift in applied strains. In the tension-torsion test with the phase shift, the direction of the principal strains rotates with time and this loading is non-proportional loading. The phase shift in applied strain in the biaxial tension-compression test causes no rotation of the principal strains but it causes the switch of the principal strain directions. The authors consider that this loading should be classified to a proportional loading because no large additional hardening and little reduction of fatigue life was confirmed in this type of test using type 304 steel cruciform specimens at 823 K [12]. However, another research [25] stated that this loading should be a type of non-proportional tests showing a fair reduction of fatigue lives in experiments. More detailed experimental studies and evidences are needed to have a definite conclusion on the classification of this type of loading.
t
11
1
1
= 10
y y t
1 1 y y
x x
Biaxial / Multiaxial loading Tension - compression and
cyclic torsion Biaxial tension - compression
Pr in cipa l st re ss/str ain sta te Applie d str ess/ stain Type
Principal stress/strain directions
rotate continuously. Principal stress/strain directions are fixed but they interchange.
Rotated
Fixed Changed
= 11 = 1 = 11
1 1
x x
Shape of specimen
Cylinder Cruciform Cubic
Type
ϨA
Type
ϨB
Type
ϩ Type Ϫ
Axial load Shear load Axial load Shear load Inter na l pr es sur e Exter na l pres su re Axial load Shear load Inter na l pr es sur e Exter na l pres su re Axial load Shear load load load load load load load
Figure 3: Definition of non-proportional loading. Figure 4: Type of specimens.
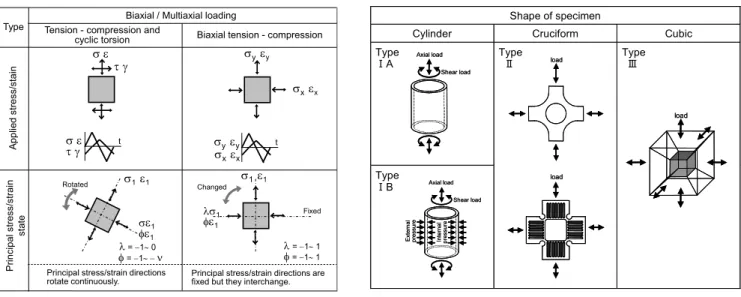
Types of multiaxial fatigue tests
Fig. 4 shows four types of common used multiaxial fatigue testing methods classified by types of loading and specimen. Type IA is the tension-compression and reversed torsion test using the hollow cylinder specimen, which is most widely used testing. Type IB is similar to Type IA from the point of using the hollow cylinder specimen but Type IB is applied with the internal and external pressures in addition to the tension-compression and reversed torsion loadings. Type II is the biaxial tension-compression testing using the cruciform specimen. Type III is the tri-axial tension-compression testing using a cubic specimen.
Principal stain and stress ratio ranges which can be performed in each type of test are summarized here. Type IA have
been used widely multiaxial fatigue studies,but the principal stress/strain ratio range performable by this testing is
1< 0/1<ν. Types IB and II can perform the multiaxial fatigue test under full ranged principal stress/strain ratio
range of 1< , 1. Type III also does the test under the same multiaxial strain state and tri-axial tension-compression
loading, too. However, Types II and III have no change in principal directions of stress and strain since the directions always fixed into the direction of applied loading. Only type IB can perform the multiaxial fatigue test in the full ranged principal stress/strain ratio range with non-proportional loading.
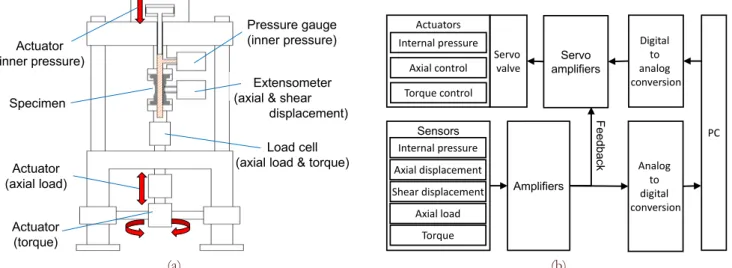
Multiaxial fatigue testing machine for tension-torsion and inner pressure
T. Itoh et alii, Frattura ed Integrità Strutturale, 34 (2015) 487-497; DOI: 10.3221/IGF-ESIS.34.54
491
used push-pull and reversed torsion testing machine. For measurements of axial, torsional and hoop strains, inductive displacement sensor type extensometers are mounted directly onto the specimen. To measure and evaluate axial, torsional
and hoop stresses, load cells for axial load and torque and pressure gauge are installed. The maximum loads are 50kN for
push-pull and 250Nm for torsion and the maximum inner pressures is 200MPa. By applying these loads, this testing
machine can perform the multiaxial fatigue tests under the principal stress ratio range of 1 1.
Test control system of this testing machine becomes more complicated than those in common used testing machines since three hydraulic actuators must be controlled simultaneously and independently by employing a test controller program and a system as shown in Fig. 5 (b). In order to raise the precision of control, three types of feedback (FB) loop are applied in this testing machine. First one is from load cell to servo amplifier for axial and torsional control, which operates on load-controlled mode. Second one is from strain gauge to servo amplifier for axial and torsional control, which operates on displacement-controlled mode. The load or the displacement control can be changed by FB selection switch. The last one is from pressure gauge to servo amplifier to control the inner pressure as test control programed.
The specimen employed is the hollow cylinder specimens designed for this testing machine of which shapes and
dimensions will be shown later.
Actuator (torque) Specimen
Actuator (axial load)
Load cell (axial load & torque)
Extensometer (axial & shear
displacement) Actuator
(inner pressure)
Pressure gauge (inner pressure)
Analog to digital conversion
Servo amplifiers
Amplifiers
Actuators
Servo valve
Axial displacement Shear displacement Internal pressure
Sensors
Axial load Torque Axial control
Torque control Internal pressure
PC Digital
to analog conversion
Feedba
ck
(a) (b) Figure 5: Multiaxial testing machine for push-pull, reversed torsion and inner pressure. (a) Schematic showing of multiaxial testing
machine, (b) Over view of control system.
TEST MATERIAL AND EXPERIMENTAL PROCEDURE
he material tested was Ti-6Al-4V, which was subject to solution treatment at 960°C for 1 hour followed by water cooling, annealing at 705°C for 2 hours and air cooling. Fig. 6 shows the micro structure, which consists of alpha phases (hexagonal close-packed crystal structure) and the dual alpha- and beta-phase mixture (body-centered cubic crystal structure).
Figure 6: Microstructure of Ti-6Al-4V alloy.
T
alpha+beta
T. Itoh et alii, Frattura ed Integrità Strutturale, 34 (2015) 487-497; DOI: 10.3221/IGF-ESIS.34.54
492
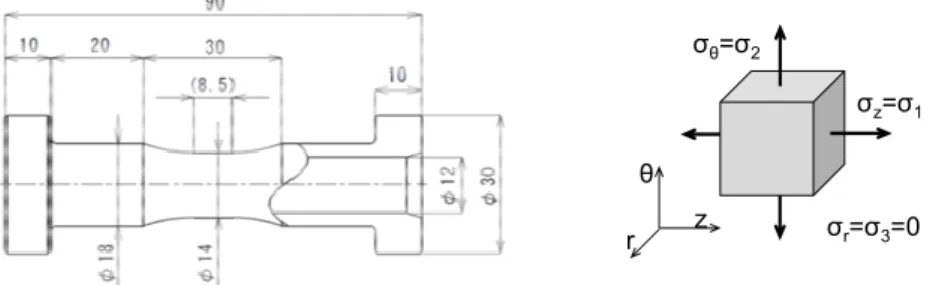
Fig. 7 shows the shape and dimensions of hollow cylinder specimen employed which has a 12 mm inner diameter, a 14 mm outer diameter, and an 8.5 mm parallel at gauge part. In the figure, a coordinate employed are indicated with principal
stresses. 1 is the maximum principal stress, 2 is the middle principal stress. In this test, 1 and 2 are equivalent to axial
stress z and hoop stress θ equated by the following equations,
2
1
2 2 2 2
4
4 4
i
z
o i o i
P D
F
D D D D
(7)
2
i
o i
P D
D D (8)
where F and P are axial load and inner pressure, respectively. Di and Do are inner and outer diameters at gauge part of the
specimen.
Figure 7: Shape and dimensions of test specimens (mm) with coordinate.
Stress controlled low cycle fatigue tests with proportional zero-peak loading were conducted under 4 types of stress paths shown in Fig. 8. In the figure, each stress path takes the principal stress ratio, =0, 0.4, 0.5 and 1.0. The dashed line shows
a constant Mises’ equivalent stress at 800 MPa. In the test at =0.4, peak stress was set at 858 MPa. The other ’s test at
800 MPa.
M
iddl
e
pr
inci
pal
s
tress
2
Maximum principal stress 1 ( =0) ( =1.0)
( =0.5)
( =0.4) Mises stress
eq=800MPa
τ
Figure 8: Principal stress path.
Fig. 9 shows strain waveforms of axial load (F), inner pressure (P) and axial stress (z), hoop stress (). Test frequencies
in the uniaxial fatigue test ( =0) and the biaxial fatigue tests ( =0.4, 0.5, 1.0) are 0.4 Hz and 0.2 Hz, respectively. Number
of cycles to failure (failure life), Nf, was determined as the cycle at which the maximum inner pressure was reduced due to
leak of oil by initiation of through crack or rupture of the specimen.
Tab. 1 summarizes test conditions conducted. In the table, z max and max are maximum values of z and obtained at
the peak load, respectively. eq max a maximum value of Mises’ equivalent stress (eq) equated by
r θ
z θ= 2
z= 1
T. Itoh et alii, Frattura ed Integrità Strutturale, 34 (2015) 487-497; DOI: 10.3221/IGF-ESIS.34.54
493
2 2
21 2
eq r r
(9)
The inner and outer surfaces at the gauge part of the specimen were ground to an averaged surface roughness 1.6m by
honing machine. After the honing, some specimen were also received polishing and buffing to 10m Al2O3 denoted by
‘Polish’ in Tab. 1.
Stress
Time t
Axial stress z
Hoop
stress θ Str
ess
Time t
Axial stress z
Hoop stress θ
Stress
Time t
Axial stress z
Hoop stress θ
Ax
ia
l l
oad
,
In
ne
r pre
ssu
re
Time t
Axial load F
Inner pressure P
Axia
l l
oad
,
In
ne
r p
re
ssure
Time t
Axial load F
Inner pressure P
Ax
ia
l l
oa
d,
In
ne
r pr
es
su
re
Time t
Axial load F
Inner pressure P
Load & Pressure
Axial & Hoop stresses
=0 =0.4, 0.5 =1
Figure 9: Wave forms of axial load, inner pressure, axial and hoop stresses.
Stress path Maximum stress (MPa) Polish/
Non-polish
Uniaxial/Biaxial Axial stress z max Hoop stress max Mises stress eq max
Uniaxial
Fatigue 0 800 ― 800
Non-polish Polish
Biaxial Fatigue
0.4 985 400 858 Non-polish
Polish
0.5 924 462 800 Polish
1.0 800 800 800 Polish
Table 1: List of fatigue test condition.
EXPERIMENTAL RESULTS AND DISCUSSION
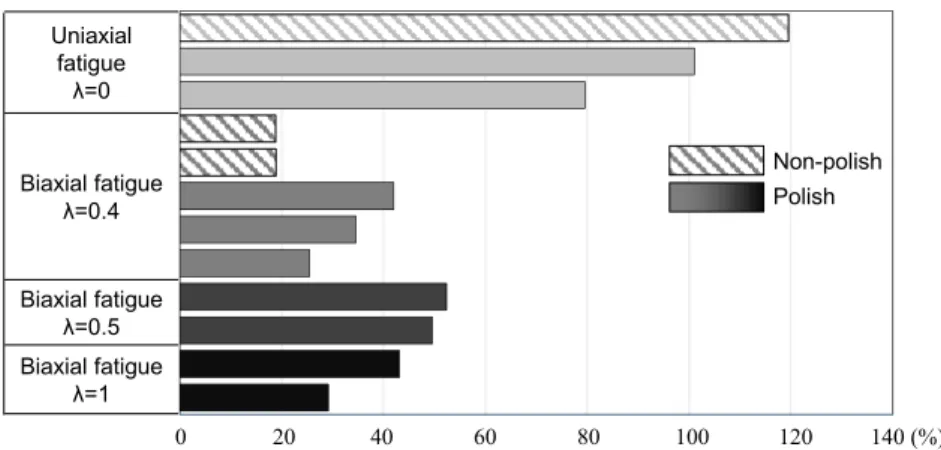
Failure life
ig. 10 shows a comparison of failure lives. In this figure, failure lives are normalized by the mean value of failure life in the uniaxial fatigue tests ( =0 tests) tested using polished and non-polished specimens. In comparing the
failure lives tested using the polished specimen, failure lives (Nf) tend to decrease with increase of the principal
stress ratio ( ) although Nf at =0.4 is slightly shorter than Nf at =0.5. The shorter life in the =0.4 test may come from
that the maximum Mises’ equivalent stress in the test is slightly larger than those in the other ’s tests as shown in Tab. 1.
The specimen polishing effect can be seen in the =0 and =0.4 tests. In the =0 test, Nf with non-polished specimen
have longer life by about 20 % than that with polished specimen. In the =0.4 test, conversely, Nf with non-polished
specimen is shorter than that with the polished specimen and the reduction ratio is down to approximately 50 % depending on each specimen.
The effects of and polishing on the failure life will be discussed in following sections.
T. Itoh et alii, Frattura ed Integrità Strutturale, 34 (2015) 487-497; DOI: 10.3221/IGF-ESIS.34.54
494
0 20 40 60 80 100 120 140
0 20 40 60 80 100 120 140 (%)
Uniaxial fatigue
=0
Biaxial fatigue =0.4
Biaxial fatigue =0.5 Biaxial fatigue
=1
σon-polish Polish
Figure 10: Comparison of failure lives at each principal stress ratio’s test.
Dependence of defamation behavior on multiaxiality
Fig. 11 shows variation of mean axial strain (z mean) as a function of cycle (N). In the figure,the vertical axis is normalized
by mean axial strain at 10 cycles (z mean10) and the horizontal normalized by (N/Nf). In all the tests, mean strains increase
gradually with increase of cycles, i.e., cyclic ratcheting occurs because the stress amplitude employed was relative high
comparing with the yield stress 113 GPa. The degree of the ratcheting becomes larger with increasing and the larger
ratcheting may leads to the reduction in failure life.
In structural components using Ti-6Al-4V, on the other hand, the stress level under service loadings is usually much lower
than that employed in this study. In this case, no or small ratcheting will occur resulting in smaller effect of on failure
life. However, the property of failure life under multiaxial loading at lower stress levels is still open question and additional experimental tests at the stress revel are required to confirm them.
Figure 11: Variation of mean axial strains at each principal stress ratio’s test.
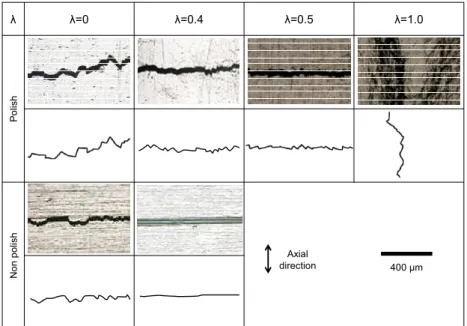
Surface crack and effects polishing on failure life
Fig. 12 shows cracks observed on specimen surface fatigued at each ’s test. In the figure, the upper side shows surface
cracks observed by optical microscope and the lower side schematic showings of the main crack.
Using the polished specimen, the crack in the =0 test shows a zigzag shape crack. Each zigzag crack is approximately 100
m in length and has propagation directions of 45 degrees from the specimen axial direction and then the macro-crack
formed by linking of each zigzag crack propagated normal to the axial direction. In the tests at =0.4 and 0.5, observed cracks are similar to that at =0 although length of each zigzag crack is slightly smaller. In the =1.0 test, a main crack is observed in the direction of specimen axis and small cracks are also observed around the main crack in various direction. Using the non-polished specimen, on the other hand, the crack at =0 test is slightly different from that at =0 test with the polished specimen. The crack shows the zigzag one but it may be formed by linking cracks propagating along cutting
0 0.2 0.4 0.6 0.8 1
0 1 2 3 4
λ=0
λ=0.4
λ=0.5
λ=1.0
M
ean
a
xi
al
s
trai
n
no
rm
al
ize
d
by
εz mea
n10
εz mea
n
/εz me
an10
T. Itoh et alii, Frattura ed Integrità Strutturale, 34 (2015) 487-497; DOI: 10.3221/IGF-ESIS.34.54
495
scratches yielded in machining. In the =0.4 test with the non-polishing specimen, a straight crack is observed propagating along the cutting scratch.
Fig. 13 shows Mohr’s stress circles and principal shear stress planes with normal and shear stresses on their planes in each state. At =0, the equivalent maximum shear stresses planes exists on planes normal and 45 degree incline to free surfaces. These two planes intersect with the surface plane in directions of 45 degree and normal to the specimen axis, respectively. So there are two possibilities of crack propagation which may results in the different crack mode between polish and non-polish specimens. In the =0.4 test, the maximum shear stress plane is 45 degree incline to the free surface on which normal and shear stresses are 493 MPa. The second principal shear stress plane is normal to the free surface of which normal and shear stresses are 693MPa and 293MPa, respectively. On this plane, the shear stress is much smaller but the normal stress is larger than those on the maximum shear stress plane. Comparing the equivalent Mises’ stresses on these planes, the values have a small difference, 985MPa on the maximum shear stress plane and 858MPa on the second principal shear stress plane, which may suggests that which plane cracks propagate is undecidable depending on specimen surface condition.
The crack mode may be affected by the specimen surface condition in uniaxial and biaxial fatigue tests and the difference in the crack mode has a possibility affecting on failure lives largely in the biaxial fatigue tests. However, more detail crack observation and discussion will be required about the crack modes in biaxial stress condition.
=0 =0.4 =0.5 =1.0
Po
lish
σo
n
po
lis
h
Axial
direction 400 m
Figure 12: Main crack shape on the surface of specimen.
=0 =0.4 =0.5 =1.0
M
ohr
’s
s
tres
s
ci
rc
le
She
ar
str
es
s
pl
ane
s
2
3 1
3 1
2
3 1
2
3 1
2
400 400 400
400
6λ3 2λ3
462 462
6λ3 231 4λ3
4λ3
400 400
400 400
T. Itoh et alii, Frattura ed Integrità Strutturale, 34 (2015) 487-497; DOI: 10.3221/IGF-ESIS.34.54
496
CONCLUSIONS
1. Multiaxial failure lives of Ti-6Al-4V depend on multiaxiality and decrease with increase of principal stress ratio, .
The reduction is caused by cyclic ratcheting.
2. Crack mode at each ’s test depends on specimen surface condition of machining. In biaxial loading test, failure life is
affected by the crack mode.
REFERENCES
[1] Kanazawa, K., Miller, K.J., Brown M.W., Cyclic deformation of 1%Cr-Mo-V steel under out-of-phase loads. Fatigue
Eng Mater Struct, 2(3) (1979) 217228.
[2] McDowell, F.L., On the path dependence of transient hardening and softening to stable states under complex biaxial
cyclic loading. In: Desai and Gallagher, editors. Proc int conf constitutive laws eng mater, (1983) 125-135.
[3] Krempl, E., Lu, H., Comparison of the stress response of an aluminum alloy tube to proportional and alternate axial
and shear strain paths at room temperature. Mechanics of Materials, 2(3) (1983) 183192.
[4] Socie, D.F., Multiaxial fatigue damage models. Trans Am Soc Mech Eng J Eng Mater Technol, 109(4) (1987)
293298.
[5] Nitta, A., Ogata, T., Kuwabara, K., The effect of axial-torsional straining phase on elevated-temperature biaxial
low-cycle fatigue life in SUS304 stainless steel. J Soc Mater Sci Jpn,. 36(403) (1987) 376382.
[6] Doong, S.H., Socie, D.F., Robertson, I.M., Dislocation substructures and nonproportional hardening. Trans Am Soc
Mech Eng J Eng Mater Technol, 112(4) (1987)456465.
[7] Fatemi, A., Socie, D.F., A critical plane approach to multiaxial fatigue damage including out-of-phase loading. Fatigue
Eng Mate Struct, 11(3) (1988) 149165.
[8] Itoh, T., Sakane, M., Ohnami, M., Socie, D.F., Non-proportional low cycle fatigue criterion for type 304 stainless
steel. Trans Am Soc Mech Eng J Eng Mater Technol, 117(3) (1995) 285292.
[9] Chen, X., Gao, Q., Sun, X.F., Low-cycle fatigue under non-proportional loading. Fatigue Eng Mater Struct, 19(7)
(1996) 839854.
[10]Itoh, T., Nakata, T., Sakane, M., Ohnami, M., Non-proportional low cycle fatigue of 6061 aluminum alloy under 14
strain path. In: Macha et al., editors. Multiaxial Fatigue and Fracture, Vol. 25. Elsevier International Series on
Structural Integrity, (1999) 4154.
[11]Socie, D.F., Marquis, G.B., Multiaxial fatigue. SAE Int, (2000).
[12]Itoh, T., Effect of direction change in maximum principal strain axis on multiaxial low cycle fatigue life of type 304
stainless steel at elevated temperature. J Soc Mater Sci Jpn, 49(9) (2000) 988993.
[13]Itoh, T., A model for evaluation of low cycle fatigue lives under non-proportional straining. J Soc Mater Sci, 50(12)
(2001) 13171322.
[14]Chen, X., An, K., Kim, K.S., Low-cycle fatigue of 1Cr-18Ni-9Ti stainless steel and related weld metal under axial,
torsional and 90°out-of-phase loading. Fatigue Eng Mater Struct, 27(6) (2004) 439448.
[15]Shamsaei, N., Gladskyi, M., Panasovskyi, K., Shukaev, S., Fatemi, A., Multiaxial fatigue of titanium including step
loading and load path alteration and sequence effects. Int J Fatigue, 32(11) (2010) 1862-1874.
[16]Itoh, T., Yang, T., Material dependence of multiaxial low cycle fatigue lives under non-proportional loading. Int J
Fatigue, 33(8) (2011) 10251031.
[17]Kallmeyer, A.R., Krgo, A., Kurath, P., Evaluation of multiaxial fatigue life prediction methodologies for Ti-6Al-4V.
Trans Am Soc Mech Eng J Eng Mater Technol, 124(2) (2002) 229237.
[18]Mall, S., Namjoshi, S.A., Porter, W.J., Effects of microstructure on fretting fatigue crack initiation behavior of
Ti-6Al-4V. Materials Science and Engineering A, 383(2) (2004) 334-340.
[19]Nakamura, H., Takanashi, M., Itoh, T., Wu, M., Shimizu, Y., Fatigue Crack Initiation and Growth Behavior of
Ti-6Al-4V under Non-Proportional Multiaxial Loading, 33(7) (2011) 842-848.
[20]Findley, W.N., Modified theory of fatigue failure under combined stress. In: Proc society experimental stress analysis,
T. Itoh et alii, Frattura ed Integrità Strutturale, 34 (2015) 487-497; DOI: 10.3221/IGF-ESIS.34.54
497
[21]McDiarmid, D.L., A shear stress based critical plane criterion of multiaxial fatigue failure for design and life
prediction. Fatigue Fract Eng Mater Struct, 17(12) (1994) 14751484.
[22]Brown, M.W., Miller, K.J., A theory for fatigue under multiaxial stress-strain conditions. In: Proc institution of
mechanical engineering, 187 (1973) 745756.
[23]Brown, M.W., Wang, C.H., A path-independent parameter for fatigue under proportional and non-proportional
loading. Fatigue Fract Eng Mater Struct, 16(12) (1993) 1285-1298.
[24]Smith, R.N., Watson, P.P., Topper, T.H., A stress-strain parameter for the fatigue of metals. J Materials, 5(4) (1970)
767778.
[25]Ogata, T., Nitta, A., Evaluation of multiaxial low-cycle fatigue failure based on new criterion and its application to