Fatigue crack growth assessments in welded components including crack
closure effects: Experiments and 3-D numerical modeling
Diego F.B. Sarzosa
a, Leonardo B. Godefroid
b, Claudio Ruggieri
a,⇑ aDepartment of Naval Architecture and Ocean Engineering, University of São Paulo, São Paulo, Brazil bDepartment of Materials Science and Metallurgy, Federal University of Ouro Preto, Ouro Preto, Brazila r t i c l e
i n f o
Article history:
Received 3 February 2012
Received in revised form 11 September 2012
Accepted 16 September 2012 Available online 26 September 2012
Keywords:
Fatigue crack growth Crack closure Fatigue tests Steel welds Numerical modeling
a b s t r a c t
This work provides a numerical and experimental investigation of fatigue crack growth behavior in steel weldments including crack closure effects and their coupled interaction with weld strength mismatch. A central objective of this study is to extend previously developed frameworks for evaluation of crack clo-sure effects on FCGR to steel weldments while, at the same time, gaining additional understanding of commonly adopted criteria for crack closure loads and their influence on fatigue life of structural welds. Very detailed non-linear finite element analyses using 3-D models of compact tensionC(T) fracture spec-imens with center cracked, square groove welds provide the evolution of crack growth with cyclic stress intensity factor which is required for the estimation of the closure loads. Fatigue crack growth tests con-ducted on plane-sided, shallow-crackedC(T) specimens provide the necessary data against which crack closure effects on fatigue crack growth behavior can be assessed. Overall, the present investigation pro-vides additional support for estimation procedures of plasticity-induced crack closure loads in fatigue analyses of structural steels and their weldments.
Ó2012 Elsevier Ltd. All rights reserved.
1. Introduction
Accurate assessments of the fatigue life for structural compo-nents and their weldments remain essential in design, fabrication and safe operation of critical engineering structures, including pressure vessels, piping systems, offshore oil facilities, bridges and cranes among others. Typical welding processes introduce strong thermal cycles and inhomogeneous residual stresses in the weld metal and surrounding region (including the HAZ) which often deteriorate the metallurgical quality and potentially lower the fatigue life of the weldment[1]. The reduced fatigue perfor-mance of the weld joint (as compared with the base plate material) largely increases the likelihood of failure from the crack propaga-tion of an undetected weld defect. Experimental observapropaga-tions con-sistently reveal the occurrence of a variety of crack-like defects in the welded region which are either planar (e.g., hot or cold crack-ing, lack of penetration, undercut) or volumetric (e.g., porosity and entrapped slag)[2,3]even if good workmanship and proper selec-tion of the welding procedure and filler-metal composiselec-tion are em-ployed. Indeed, the history of in-service weldment failures over the past decades clearly reveal that fatigue cracking represents a major source of catastrophic fracture in fabricated steel structures[3].
Conventional fatigue design of unwelded structural compo-nents based on stress-life approaches most often employs
simpli-fied models incorporating an implicit crack initiation criterion which essentially link the nominal stress range, DS, or nominal stress amplitude,Sa, with the material’s fatigue strength[4]. These
approaches have led to a substantial broadening of fatigue analyses of cyclic loaded structures while, at the same time, producing con-servative predictions of the fatigue life for several classes of struc-tural components. However, the much higher incidence of weld flaws, coupled with a relatively large variety of weld joint geome-tries, greatly complicates generalization and direct extension of conventional stress-life procedures to fatigue design of welds thereby prompting further developments in fatigue strength assessments of load-carrying welded joints. The early work of Gurney [5] introduced the concept of fatigue design curves (SN) for welded steel joints in which each specific design curve reflects the general influence of weld geometry, weld details and residual stresses on the fatigue life. Within Gurney’s approach, these SNcurves range from a ground flush butt welded joint (highest fatigue strength) to a transverse fillet welded joint (lowest fatigue strength)[6]. Subsequent study by Gurney and Maddox[7]
derived from a statistical analysis of experimental fatigue data pro-vided the basis for a number of current standards and guidelines incorporating design curves representing 95% survival probability for a given weld detail or weld joint configuration such as, for example, AWS D1.1[8], BS 7608[9]and DNV C-203[10]among others. A comprehensive investigation on the fatigue behavior of welded components including fatigue strength assessments and design rules is given by Maddox[11]and Lassen and Récho[12].
0142-1123/$ - see front matterÓ2012 Elsevier Ltd. All rights reserved.
http://dx.doi.org/10.1016/j.ijfatigue.2012.09.009
⇑ Corresponding author. Tel.: +55 11 30915184; fax: +55 11 30915717.
E-mail address:[email protected](C. Ruggieri).
Contents lists available atSciVerse ScienceDirect
International Journal of Fatigue
While stress-life fatigue analyses have been used effectively in many structural applications, it is now generally recognized that crack propagation from pre-existing defects dominates the fatigue life of welded joints. Consequently, advanced procedures for fati-gue assessments of critical weldments should include the effects of crack extension under cyclic loading on fatigue life predictions for structural components.
Experimental studies reveal that fatigue crack growth rates (FCGR) in welds may display strong sensitivity to welding process, weld geometry, localized changes in material and mechanical properties of the weldment, including the heat affected zone. These effects arise from the complex interplay between macroscale fea-tures (crack size and geometry, material properties including weld strength mismatch, weld residual stresses, load ratio, etc.) and the micromechanism of fatigue crack growth. At the macroscale re-gime, there is a clear correlation between crack propagation rate under cyclic loading and load ratio (R) in which the FCGR increases withR. Here, crack closure effects play a key role in controlling the rate of crack propagation with varying load ratios by strongly affecting the (effective) stress intensity factor (SIF) range. However, despite the technological importance of fatigue crack extension in welded structural components, a full understanding of the fatigue crack growth phenomenon in welds remains limited as does a more extensive body of experimental data. Early work of Benoit et al.[13]on fatigue crack propagation in the heat affected zone (HAZ) for a structural steel weld showed that FCGR in welded materials are lower than the corresponding rates in the base plate material. Link [14] conducted FCGR experiments using compact tension specimens for both the base plate and weldments of a 5456-H116 aluminum alloy and an ASTM A710 Grade A steel with and without post-weld heat treatment (PWHT); these results show a strong influence of welding residual stresses on the measured FCGRs due to the effects of crack closure. Later, Shankar and Wu
[15]showed that fatigue crack growth behavior in welded 5083-H321 aluminum alloys is essentially similar to the parent material. These previous research efforts clearly demonstrate that accurate evaluation procedures for effective stress intensity factors which are applicable to welded fracture specimens remain essential in more refined defect assessment procedures capable of including ef-fects of crack closure on fatigue crack growth rates.
Motivated by these observations, this work provides a numeri-cal and experimental investigation of fatigue crack growth behav-ior in steel weldments including crack closure effects and their coupled interaction with weld strength mismatch. A central objec-tive of this study is to extend previously developed frameworks for evaluation of crack closure effects on FCGR to steel weldments while, at the same time, gaining additional understanding of com-monly adopted criteria for crack closure loads and their influence on fatigue life of structural welds. Very detailed non-linear finite element analyses using 3-D models of compact tensionC(T) frac-ture specimens with center cracked, square groove welds provide the evolution of crack growth with cyclic stress intensity factor which is required for the estimation of the closure loads. Fatigue crack growth tests conducted on plane-sided, shallow-cracked
C(T) specimens provide the necessary data against which crack clo-sure effects on fatigue crack growth behavior can be assessed. Overall, the present investigation provides additional support to estimation procedures of plasticity-induced crack closure loads in fatigue analyses of structural steels and their weldments.
2. Brief perspective on fatigue crack growth including crack closure
Elber’s pioneering work[16]on plasticity-induced crack closure (PICC) provided a major impetus for bringing new concepts and a
more comprehensive understanding to bear on problems of fatigue crack propagation. While a number of other closure mechanisms have since received considerable attention, PICC remains as the primary mechanism in stage II fatigue crack growth associated with acceleration and retardation effects under cyclic loading as well as load ratio effects and short crack behavior in fatigue among others. Much research has been continuously spent in the past years aiming at developing adequate techniques to describe PICC and its effects on fatigue crack growth behavior. This section pro-vides a brief overview of fatigue crack growth description includ-ing crack closure effects. The presentation that follows also introduces key features of the evaluation procedures for crack clo-sure loads more widely adopted in fatigue crack growth analysis.
2.1. Overview of fatigue crack growth description
In the context of small scale yielding (SSY) conditions and lim-ited-scale plasticity, existing models generally describe crack extension under constant cyclic loading in the form[17–19]
da
dN¼fð
DK
;RÞ ð1ÞwhereDK¼KmaxKminis the (macroscopic) stress intensity range,
R¼Kmin=Kmaxdefines the load ratio andda=dNdenotes the amount
of crack growth per cycle. Here,KmaxandKminrepresent the
maxi-mum and minimaxi-mum values of the elastic stress intensity factor,K. A widely adopted simplified form of previous Eq.(1)applicable to characterize the stage II of crack growth behavior in metals is given by a power law defined as
da
dN¼Cð
DK
Þ mð2Þ
whereCandmare material’s constants. The above Eq.(2)is often known as Paris law[17–19].
However, even though the mechanism of fatigue crack growth associated with Eq.(2)(and, consequently, Eq.(1)) is strictly asso-ciated with SSY conditions and well-contained plasticity at the crack tip, the large tensile plastic strains that develop ahead of the growing fatigue crack tip are not fully reversed during subse-quent unloading[20,21]. This results in formation of a plastic wake associated with compressive residual stresses behind the fatigue crack tip which causes crack face contact before complete unload-ing. This phenomenon was first observed by Elber[16]and is most often referred to as plasticity-induced crack closure (PICC).
Because of premature crack face contact due to the PICC mech-anism just discussed, the stress intensity level at which Mode I opening loading,Kop, starts ‘‘driving’’ fatigue crack growth is larger
thanKmin. Elber [16] defined an effective stress intensity factor
range given byDKeff¼KmaxKop¼UDKso that Eq.(2)is rewritten
as
da
dN¼C
DK
eff m¼C UDKð Þm ð3Þ
in whichUdefines the closure ratio given byU¼Keff=K.
Inclusion of closure effects in fatigue crack growth analysis re-veals features that can be different from those emerging through application of the conventional treatment given by previous Eq.
(2). Based on the interpretation ofKeffas the effective cyclic
2.2. Crack closure evaluation procedures in fatigue crack growth analysis
There is a history of research efforts aimed at developing engineering approaches to evaluate crack closure loads. Most of evaluation procedures to estimate crack closure loads in fatigue testing of common fracture specimens have evolved essentially along two lines of development: (1) indirect estimation based on experimental measurements of specimen compliance variation due to contact of crack faces and (2) numerical evaluation of crack closure loads based on finite element descriptions of fatigue crack propagation. Approaches falling in the first category may be viewed as macroscopic procedures since they rely entirely on experimental measurements of load–displacement records to relate the macroscale variation of specimen compliance with the microscale closure loads; here the measured specimen compli-ance,Cm, (which is the inverse of the specimen stiffness) is defined
as the relationship between displacement, most often character-ized in terms of crack mouth opening displacement (CMOD), and applied load in the formCCMOD
m ¼Vm=Pm. In contrast, numerical
simulations of crack propagation by fatigue enable a local evalua-tion of closure loads over size scales which are similar to the size of the fracture process zone associated with fatigue crack extension.
Because of its relative ease with which the load–displacement records can be measured in conventional test specimens, the indi-rect method is most suited for testing protocols measuring crack closure loads such as ASTM E647[22]. However, while employed extensively to estimate crack closure loads due to its relative sim-plicity, analysis of the compliance variation during fatigue cycling may exhibit significant difficulties in accurate evaluations of crack flank contact based on global measurements of load with CMOD. Representative works of this technique include the methodologies proposed by Schijve[23]and Carman et al.[24]. These procedures essentially define the closure load,Pcl, based on an approximate
description for key portions of the experimentally measured
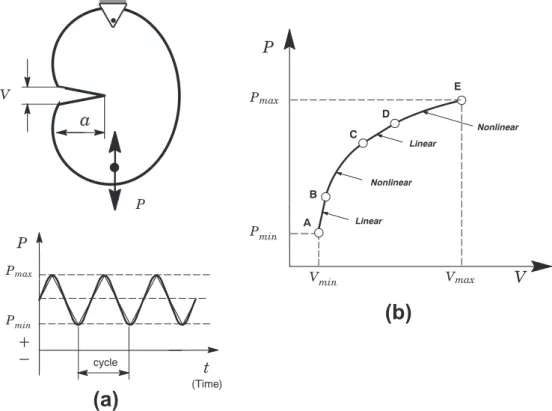
P-CMOD curve as illustrated inFig. 1. Here, the increased tensile loading ranging fromPmintoPmaxdepicted in this plot can be
de-scribed by four distinct regions depending on the measured com-pliance and whether the crack faces are in contact or the crack has extended: (1) Region AB corresponds to a linear relationship between load and displacement for which the crack is fully closed; (2) Region BC marks the beginning of crack opening thereby caus-ing a nonlinear evolution of load with CMOD with consequent in-crease (dein-crease) in specimen compliance (stiffness); (3) the crack is fully open in Region CD but no significant crack growth nor plas-tic deformation occur so that specimen compliance remains con-stant; and (4) finally, crack growth and plastic deformation take place in Region DE for which there is further increase (decrease) in specimen compliance (stiffness).
By assuming that the closure load,Pcl, has the same (absolute)
value of the opening load, Pop, the general features previously
observed support the viewpoint thatPcl(or, equivalently,Pop) can
be defined as the load value corresponding to the point marking the transition between region BC and CD (seeFig. 1). Because the measured P-CMOD curve is a discrete, rather than continuous, function, Schijve[23] defined the opening load,Pop, as the value
corresponding to the intersection between a linear fitting of region CD and a quadratic fitting for region AC. While a few other evaluation schemes have been proposed (see, e.g., the review of Stoychev and Kujawsky [25]), Schijve’s approach has proven effective in determining crack closure loads[26].
Despite the apparent simplicity of (macroscopic) compliance-based techniques, numerical schemes to evaluate crack closure loads based upon finite element analyses have been receiving increasingly attention. Early progress in developing numerical techniques to describe PICC was achieved by Newman [27] and McClung and Sehitoglu[28]. Approaches based on finite element simulations of fatigue crack propagation essentially rely on an ade-quate modeling of crack-tip behavior and the surrounding near-tip region to describe the closure mechanism. Most often, these meth-odologies implement widely adopted techniques in which a finite
(a)
(b)
element crack model is cyclic loaded between minimum and maximum values of prescribed remote stresses. Within each load cycle, crack extension occurs through conventional nodal release thereby advancing the crack by one element size. The residual plastic deformation region which develops behind the advancing crack front enables defining the closure/opening loads and, conse-quently, estimates ofKop-values. While relatively simple, several
modeling issues often complicate fatigue crack growth simulations and have a direct bearing on the computed closure/opening loads. These issues include mesh refinement, details of the node release scheme, opening load stabilization with increased crack extension, crack face contact and, perhaps more importantly, the criterion to define when the crack closes and opens.
Much work has been done on numerical modeling of PICC based on the finite element method which led to a number of criteria to define the levels of crack closure loads. Standard finite element analysis of fatigue crack propagation typically defines the opening loads based on the displacement and stress fields measured on nodes adjacent to the crack tip. The early work of Newman[27]
and McClung and Sehitoglu[28]introduced a simple criterion in whichPopwas identified as the applied remote load at which the
first node behind the current crack front opens relative to the crack plane. Sehitoglu and Sun[29]and Wu and Ellyin[30]advanced this viewpoint by defining the crack opening when the near-tip open-ing stress, which was compressive in previous cycle, changes from compression to tension; here, they simply identified the opening load as the load level at which the opening nodal stress at the crack tip changes from negative to a positive value. More recently, Roychowdhury and Dodds[31] proposed an alternative criterion in whichPopwas identified as the applied remote load at which
the second node behind the current crack front opens relative to the crack plane.
While all previous approaches have been relatively effective in describing closure effects for fatigue assessment applications, they remain rather limited with few comparisons between numerical predictions and experimentally measured results
[32–34]. Moreover, the large differences in predicted closure loads depending on the adopted criterion to definePop reported
in the literature [35,36] raise some concerns on the robustness of these methodologies. The analyses described subsequently address these issues and explore further extensions of crack clo-sure criteria to describe fatigue crack growth behavior for steel weldments.
3. Numerical modeling of plasticity-induced crack closure
3.1. Finite element description of fatigue crack growth analysis
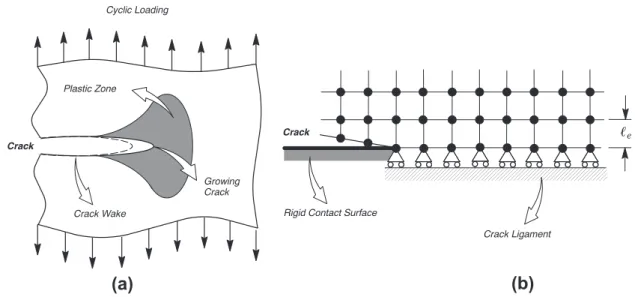
Fig. 2a illustrates a simplified view of fatigue crack growth in elastic–plastic materials under macroscopic Mode I loading. Devel-opment of plasticity-induced crack closure is related to plastic deformation left in the wake of the growing crack by cyclic loading.
Fig. 2b shows the finite element representation of the crack-tip region including the crack wake (contact region) behind the advancing crack. Within the 3-D framework adopted in the present work, constrained nodes on the crack plane (which is also the sym-metry plane) define the crack ligament. Crack growth occurs by uniform release of the constrained nodes defining the current crack front thereby advancing the crack.
Numerical simulation of fatigue crack propagation is based on a sufficiently refined mesh such as the effects of forward and reversed plasticity can be adequately described within the near-tip region, including the plastic wake zone behind the crack. A sin-gle row of uniformly sized, squared elements arranged along the crack ligament enables fatigue crack extension by an amount equals to the element size,le, in each cycle. Competing demands
dictate the choice of the element size: (1) adequate resolution of the stress–strain fields over a small, narrow region near the crack tip and (2) number of cycled which is necessary to simulate fatigue crack propagation. As described below, numerical crack propaga-tion by fatigue occurs by nodal release so that a very large number of loading and unloading cycles (order of thousand cycles) is re-quired if the element size,le, is too small. Conversely, using larger
le-values would likely result in poor representation of the near-tip
stress and strain fields as well as the plastic wake region thereby affecting estimates of crack closure loads. In previous work employing similar procedure, Roychowdhury and Dodds[31] uti-lized element sizes ranging from 0.005 to 0.02 mm. This range of values forlesatisfies issue (2) while providing satisfactory
resolu-tion of the near-tip fields required in issue (1). In the present 3-D analyses, we adoptle¼0:02 mm for the homogeneous C (T)
spec-imens andle¼0:01 mm for welded C (T) configuration described
later. Moreover, such element sizes also enable including at least three elements within the reverse plastic zone at all crack front locations[31]for both material conditions. Preliminary numerical analyses[37]to simulate crack closure in a single edge cracked tension SE (T) specimen agree very well with the results obtained
(a)
(b)
by Daniewicz and Ismonov[35]thereby providing strong support to our adopted approach.
The remote load is applied under load control conditions by cy-cling it fromPmintoPmaxin a triangular-type wave, i.e., the load
in-creases linearly fromPmintoPmaxand then decreases also linearly
fromPmax toPmin. The crack propagates by an amountMa¼lein
each cycle by releasing the crack-tip node at the beginning of the unloading step corresponding to that cycle (seeFig. 1a). Friction-less contact over the crack flanks is enforced by using a rigid sur-face at the crack symmetry plane to prevent crack sursur-face penetration as described next (seeFig. 2b).
3.2. Crack closure criteria
The computational framework for fatigue crack growth model-ing adopted here enables definmodel-ing the crack closure loads based on
Kop-values using essentially three different methodologies: (a)
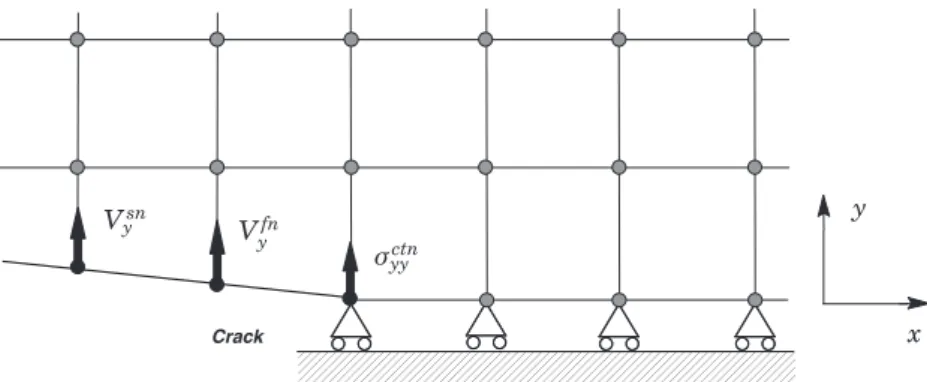
node displacement procedure, (b) crack-tip stress evolution and (c) specimen compliance measurements. Fig. 3 illustrates the essential features of crack opening evaluation using the first two methodologies for a growing crack in thexy-plane; fatigue crack growth occurs along thex-axis in which unconstrained (released) nodes define the crack face with its origin at the current crack tip. For the node displacement procedure, a widely adopted approach utilizes the concept of node contact to the (rigid) crack plane to characterize the opening load. Here,Popis defined when
the vertical displacement of the first node,Vfny, behind the crack
tip becomes positive during the opening phase of the loading cycle. Alternatively,Popcan also be defined based on the same strategy
but using the vertical displacement of the second node,Vsny, behind
the crack tip. In contrast, the second methodology utilizes the crack-tip node to assess crack opening but evaluates changes in crack-tip opening stresses rather than vertical displacements. Here,
Pop is defined when the crack-tip opening stress (which
corre-sponds to the crack-tip nodal stress,
r
ctnyy) changes from
compres-sion to tencompres-sion during the opening phase of the loading cycle. A number of previous studies have used the first two proce-dures (either directly or in slightly modified forms) to model crack closure loads in common fracture specimens against which exper-imentally measured closure loads are compared. McClung and Davidson[33]analyzed middle-crack tensionM(T) specimens with short cracks (a=W0:10:3) made of a 7091 aluminum alloy. By using similar numerical techniques developed in previous work of McClung and Sehitoglu[28], they found good agreement between experimentally measurements and numerical predictions of near-tip strains, crack opening displacements and crack closure loads. Wei and James[38]conducted a study of fatigue crack clo-sure in polycarbonate compact tensionC(T) specimens and showed that closure loads measured using the specimen compliance tech-nique are within 10–15% of the numerical predictions based on the
first-node displacement criterion. More recently, Simandjuntak et al.[32]and Kim et al.[39]performed 3-D finite element analyses coupled with the first-node displacement criterion to predict clo-sure loads in midle-crack tension M (T) specimens made of 2024 and 7075 aluminum alloys which are in good agreement with experiments.
The third methodology to evaluate crack closure loads based upon specimen compliance follows entirely the procedure using the compliance offset method described in ASTM E647[22] stan-dard. Here,Popis determined from tracing the changes in specimen
compliance due to closure of the crack derived from the computed evolution of load vs. displacement with increasing crack advance for the analyzed numerical models. When the crack becomes fully open during the loading portion of the load cycle, the specimen compliance attains a characteristic value,Cem, and remains
essen-tially unchanged upon further loading until large scale yielding con-ditions prevail in the crack-tip region. Upon unloading from the peak load attained in a cycle, the specimen compliance still has the characteristic value,eCm, for the fully-open crack. Consequently,
thePop-value corresponds to the force at which the measured load
vs. displacement in a cycle becomes linear (point C in previous
Fig. 1). While conceptually simple, a fully open load is difficult to identify during the evolution of load vs. displacement due to the gradual and rather subtle change in specimen compliance as it ap-proaches the open-crack value. By defining the opening load as the load corresponding to a compliance that is offset from the fully-open-crack value rather than the load at which the compliance attains the fully-open value (the point at which the curve becomes linear), evaluation of thePop-value within each cycle becomes less
sensitivity to the inherent noise and nonlinearity in the measure-ment system[22]. The selection of an appropriate compliance offset criterion remains somewhat arbitrary although it is clear that its choice should ideally reduce the scatter and errors inPop-estimates.
Readers are referred to ASTM E647[22]for additional details.
3.3. 3-D finite element models
3-D finite element analyses are conducted on a plane sided 0.5-T C (T) specimen (B¼12:5 mm) withW¼50 mm and having a square groove weld with a fixed weld groove width, 2h. The anal-ysis matrix includes C (T) specimens having varying crack size to specimen width ratio:a=W¼0:2;0:25;0:30;0:35;0:4;0:5;and 0:6. Here,ais the crack length,Wis the specimen width andBis the specimen thickness. The geometry and material flow properties match those for specimens tested in the experiments described in Section4(seeFig. 6a).
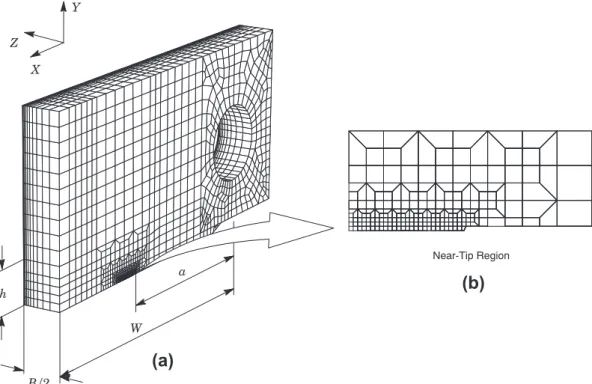
Fig. 4a shows the finite element model constructed for the 3-D analyses of the C (T) specimen previously described having
a=W¼0:6. Symmetry conditions enable analyses using one-quarter, 3-D model of the specimen. This 3-D model has
approximately 10100 8-node elements (13,200 nodes) arranged into 10 variable thickness layers over the half-thickness (B=2), as illustrated in Fig. 4a. This refinement in the thickness direction proved highly effective to resolve the out-of-plane (Z-direction) stresses. Within each of the 10 layers over the crack front, the ele-ment mesh contains a row of 200 squared cells along the remain-ing ligament (Wa) arranged as shown inFig. 4b. A series of numerical experiments suggest an optimal cell size ofle¼20
l
mfor the homogeneous specimen and le¼10
l
m for the weldedspecimen so that the slab of 2000 (10200) squared cells over which fatigue crack growth occurs can extend up to 2–4 mm uniformly over the half-thickness ahead of the initial crack front. Fatigue crack propagation takes place under load control conditions in which the prescribed forces are imposed at the pin hole indicated inFig. 4a.
3.4. Material models and finite element procedures
Evaluation of plasticity-induced crack closure loads requires nonlinear finite element solutions which include the effects of the plastic wake behind the crack tip on crack face contact. These analyses utilize an incremental, isotropic hardening constitutive model to describe the cyclic, elastic–plastic response of the mate-rial in small geometry change (SGC) setting. The numerical solu-tions employ a simple power-hardening model to characterize the uniaxial true stress (
r
)-logarithmic strain () in the form ys¼
r
r
ys6ys; ys¼
r
r
ysn
>ys ð4Þwhere
r
ysandysare the yield stress and strain, andnis the strainhardening exponent.
The finite element analyses consider material flow properties for an ASTM A516 Grade 70 and its weldment. Section4provides the tensile and mechanical properties for the analyzed materials and describes the uniaxial true stress vs. logarithm strain curves for the ASTM A516 steel (base plate and overmatch weld material) at
the test temperature,T= 20°C; these curves were used in the finite
element computations reported here. To facilitate addressing ef-fects of weld strength mismatch on fatigue crack growth, it proves convenient to define the mismatch ratio,My, as
My¼
r
WMys
r
BMys
ð5Þ
where
r
BMys and
r
WMys denote the yield stress for the base metal andweld metal.
The finite element code WARP3D[40]provides the numerical solutions for the 3-D analyses reported here. The code enables con-ventional linear elastic analysis and incorporates both a Mises (J2)
constitutive model in both small-strain and finite-strain frame-work. To simulate the contact interaction between the closing crack face to the rigid crack plane (seeFig. 2b), WARP3D imple-ments frictionless, rigid-body contact using a simple penalty meth-od to enforce displacement constraints in the solution of the finite element model by creating springs at the contact points. The spring stiffness corresponds to the penalty parameter, while the amount of remaining penetration corresponds to the error in the enforce-ment of the constraint. WARP3D adds each spring stiffness into the corresponding element stiffness matrices instead of directly into the global stiffness matrix.
4. Experimental program
4.1. Tested materials and fatigue specimens
The material utilized in this study was a normalized pressure vessel steel ASTM A516 Gr 70 with 16 mm thick base plate. A multipass butt weldment using the shielded metal arc welding (SMAW) process was produced with an overmatch between the yield strength of the base plate material and weld metal. A sin-gle-V type groove was used for fabrication of the test weld through an adequate choice of weld filler material and welding parameters.
Fig. 5a provides a schematic of the weld joint profile along with a summary of the geometry and welding variables for the weldment.
(a)
(b)
Mechanical tensile tests, conducted on longitudinal tensile specimens (ASTM E8), provide the room temperature (20°C)
stress–strain data for the base plate and weld materials. The test specimens for the weldments were machined from the weld fusion zone with their longitudinal axes parallel to the welding direction.
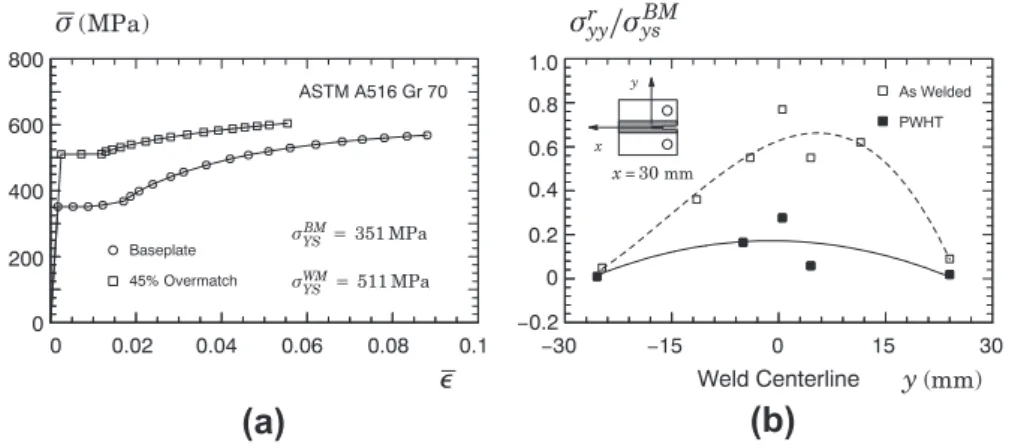
Fig. 6a shows the true stress-logarithmic strain curves for the base plate and weldments.Table 1summarizes the tensile data for the tested materials (average of three tensile tests) and indicates that the weldment overmatches the base plate material by 45% (My¼1:45 – refer to Eq.(5)for definition of the mismatch level)
at room temperature.
4.2. Experimental fatigue crack growth data
Fatigue crack growth tests at room temperature (20°C) were
conducted on plane-sidedC(T) specimens with a fixed crack length to width ratios,a=W¼0:25, illustrated inFig. 5b. The specimens have width,W¼50:8 mm, thicknessB¼12:5 mm, and were ex-tracted in theT–Lorientation for the base plate material and in the longitudinal weld direction for the weld material. The test ma-trix includes twoC(T) specimens for the base plate material and twoC(T) specimens for the weld material. The fatigue crack growth experiments were performed on a servo-hydraulic testing machine
at a frequency of 30 Hz (sine wave) under load control and con-stant amplitude loading with load ratio,R¼0:1. The current crack length in the specimens was estimated based upon a compliance procedure using the cyclic evolution of load vs. crack mouth open-ing displacement (CMOD) records as previously outlined.
Post-weld heat treatment (PWHT) at 590°C for 30 min with
controlled, slow cooling was performed on the welded specimens to promote stress relief in the weld joint. Evaluation of the residual stresses on the specimen surface was made using an X-ray diffrac-tion technique. X-ray diffracdiffrac-tion uses the distance between crystal-lographic planes as a strain gage measurement (see, for example, Anderoglu[41], for additional details). The residual deformation produces changes in the spacing of lattice plane from their stress free value to a new value that corresponds to the magnitude of
(a)
(b)
Fig. 5.(a) Schematic of the weld joint profile from which the fatigue specimens were extracted and (b) compactC(T) specimen used in fatigue testing.
(a)
(b)
Fig. 6.(a) True stress-logarithimic strain curves for the baseplate and weldments and (b) distribution of residual stress across the weld centerline,ryyr, normalized by the
yield stress for the base plate material,rys
BM, measured atx= 30 mm.
Table 1
Mechanical properties of tested ASTM A516 Gr70 steel at room temperature. Material rys(MPa) ru(MPa) ru/rys
Base plate 351 526 1.50 Weld metal 511 580 1.14
the residual stress. The diffraction measurements were carried out on a Shimadzu XRD-7000 diffractometer. The average of four incidence angles, (0;5;30;and 40), was utilized to calculate the residual stress values.Fig. 6b provides the measured distribu-tion of residual stresses normal to crack plane,
r
ryy, normalized by
r
BMys , with the distance from the center of seam weld before and
after the PWHT. In this plot, the open and solid symbols correspond to the measured residual stress values whereas the lines repre-sent a cubic fit to the experimental points. The residual stress values,
r
ryy, were measured at a remote distance from the crack
tip,x¼30 mm. While the applied PWHT does not fully eliminate the weld residual stress fields, it reduces significantly the residual stress levels; here, the
r
ryy-values do not exceed25% of the base
plate’s yield stress.
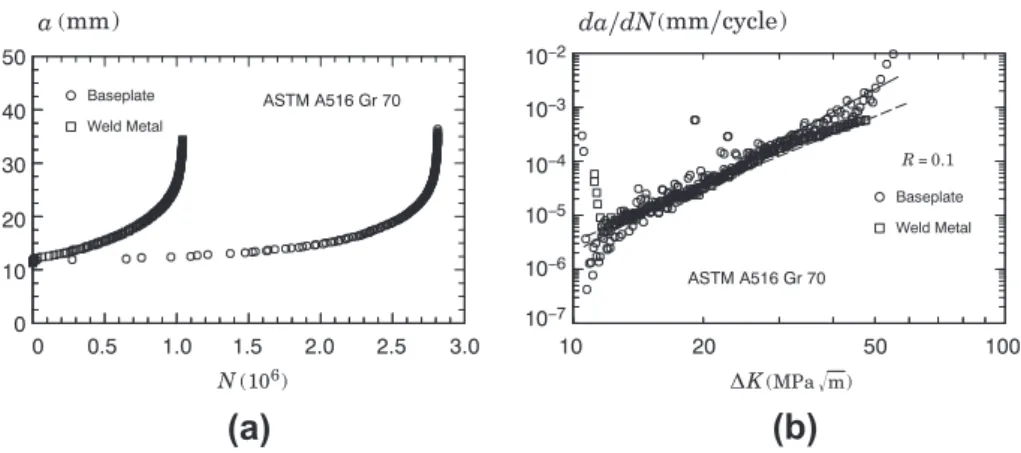
Fig. 7a and b displays the experimentally measured fatigue crack growth data for theC(T) specimens with both test conditions: base plate material and 45% overmatch weld. Two different levels of max-imum load were imposed during the tests: Pmax¼720 kgf e
Pmax¼900 kgf. As expected, the fatigue crack growth rate is not
influenced by the level of maximum applied load. Thus, only the results for the maximum load level corresponding to Pmax¼
720 kgf are presented here. The straight lines included inFig. 7b
represent the linear fitting on the log–log plot corresponding to the Paris law (refer to previous Eq.(2)) describing the experimental data in stage II region.Table 2provides the coefficientsCandmfor both data sets. Here, while the slope of both curves are similar, the coefficientCwhich characterizes the rate of crack propagation is more strongly affected by the overmatch condition.
5. Crack closure effects on fatigue behavior
5.1. Thickness effects on closure loads
Before undertaking the 3-D crack closure analyses of theC(T) specimens, it is instructive to first examine the variation of the closure loads over the specimen thickness for the homogeneous
C(T) specimen.Fig. 8a and b shows the computed crack closure loads,
Pop, normalized by Pmax with the amount of crack growth, Ma,
normalized by the initial size of crack-tip plastic zone, denoted as
rp, at five different locations over the specimen half-thickness for
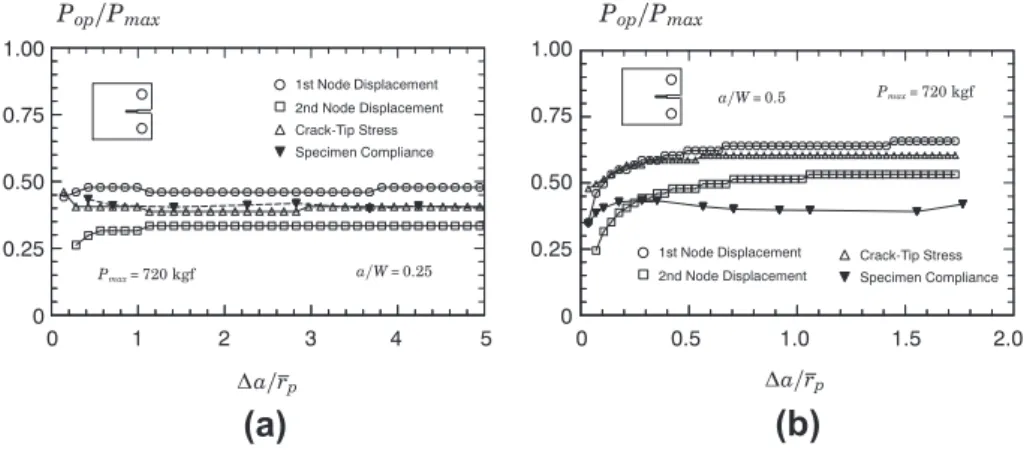
the crack configuration with a=W¼0:35;z=B¼0;0:217;0:347; 0:487;and 0:5 for two different closure criteria: (i) 1st-node dis-placement and (ii) 2nd-node disdis-placement. Here,zis the Cartesian axes perpendicular to the crack plane (seeFig. 4)andBis the speci-men thickness so thatz=B¼0 corresponds to the specimen center-plane andz=B¼0:5 defines the specimen surface. Further,rp is
simply taken as Irwin’s approximation for the size of crack-tip
plastic zone[17]defined byrp¼ K0I=
r
ys 2=ð3
p
Þin whichr
ys isthe material’s yield stress andK0
Irepresents the Mode I stress
inten-sity factor determined for the initial crack size,a0. In these plots,Pmax
is taken the value of 720 kgf.
The trends displayed in these plots are clear. Closure effects are maximum at the specimen surfaceðz=B¼0:5Þwhen the closure
(a)
(b)
Fig. 7.Experimentally measured fatigue crack growth data for the C (T) specimens with both test conditions: (a) base plate material and (b) 45% overmatch weld.
Table 2
CoefficientsCandmdefining the linear fitting on the log–log plot corresponding to the Paris law describing the experimental data in stage II region.
Data set Linear fitting
m C(Mpa, m) Base plate 3.85 4.461010
45% Overmatch weld 3.38 1.92109
(a)
(b)
loads reach a peak value (relative to the load levelPmax) and then fall
very rapidly after a short distance from the surface. Consider, for example, the evolution of the normalizedPopwith normalizedMa
de-rived from using the 1st-node displacement criterion provided in
Fig. 8a. The closure load has a peak value ofPop=Pmax0:6 and drops
toPop=Pmax0:38 atz=B60:347; similar behavior is observed for
the results shown inFig. 8b derived from using the 2nd-node dis-placement criterion (note, however, that thePop=Pmax-values are
consistently lower for all five crack front locations,z=B). Similar re-sults are obtained for other crack configurations with different
a=W-ratios; to conserve space, they are not shown here.
This behavior can be understood in terms of the plastic wake development at the near-tip region which remains relatively small for most of the specimen inner region but increases substantially when the specimen surface is approached. Therefore, the fully developed plastic zone formed in front of the growing crack tip at the specimen surface brings about an increase in the closure loads which most likely controls the overall fatigue crack advance. These observations support the viewpoint of evaluating the closure loads at specimen surface as addressed next.
5.2. 3-D crack closure analyses for C(T) specimens
The extensive 3-D finite element analyses of theC(T) specimen configurations provide the evolution of crack-tip displacements and stresses to define the closure loads in terms of the criteria pre-viously described.Figs. 9–11display the key results relating the variation ofPopwith cyclic crack extension in the analyzed fatigue
specimens. The material properties for the analyses covered in these plots correspond to the ASTM A516 Gr 70 for the base plate and 45% overmatch conditions.
Figs. 9 and 10shows the evolution ofPop normalized byPmax
with the amount of crack growth,Ma, normalized by the initial size of crack-tip plastic zone, denoted asrp, for two widely different
crack sizes, as defined by thea=W-ratio. As already discussed in previous section, thesePop-values correspond to the closure loads
evaluated at the crack front location defined atz=B¼0:5. The pres-ent study focuses on numerical simulations corresponding to
Pmax¼720 kgf; Sarzosa [42] also describes additional analyses
with other levels of maximum load and found trends qualitatively similar to the results shown inFigs. 9 and 10. In these plots, the
Pop-values attain a ‘‘plateau’’ following a short transient at early
stages of loading associated with development of near-tip plastic-ity. Analogous features are also observed for other a=W-ratios; these results are not shown here in interest of space.
A strong effect of the adopted closure criterion onPop-values
can be seen inFigs. 9 and 10. Further, observe that thePop-values
are also affected, albeit to a lesser degree, by increased crack sizes. Consider first the deep crack results shown inFigs. 9b and 10b. The 1st-node displacement criterion consistently produces the highest closure loads for both the base plate and overmatch condition whereas the specimen compliance criterion results in the lowest closure loads. Consider now the shallow crack results shown in
Figs. 9a and 10a. The 1st-node displacement criterion also pro-duces the highest closure load for the base plate condition. In con-trast, however, the specimen compliance criterion now results in the highest closure load for the overmatch condition. We also draw attention to a comparison among the local criteria covering the 1st-node and 2nd-node displacement as well as the crack-tip stress criterion. For all analyzed cases, the 2nd-node displacement criterion always gives the lowest closure loads irrespective of crack size and whether base plate or overmatch condition is considered.
(a)
(b)
Fig. 9.Evolution ofPopnormalized byPmaxwith the amount of crack growth,Da, normalized byrp, for the base plate C (T) specimen with differenta/W-ratios.
(a)
(b)
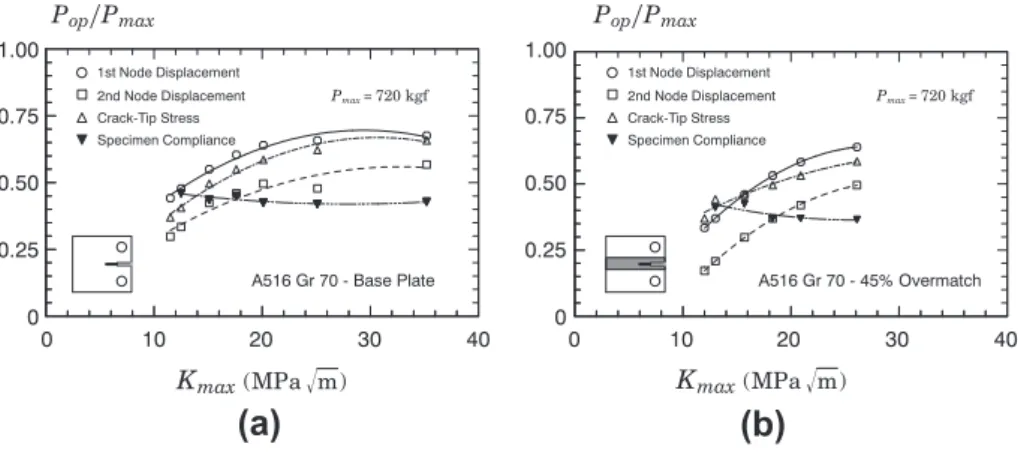
Now, using the results displayed in previousFigs. 9 and 10with the inclusion of corresponding results for othera=W-ratios,Fig. 11
shows the evolution of the normalized closure load,Pop=Pmax, with
increased values ofKmax, for both base plate and overmatch
condi-tion. Here, since the applied maximum load is kept constant during the analyses, i.e.,Pmax¼720 kgf, theKmax-value is directly
associ-ated with each analyzeda=W-ratio. Further, thePop-value for each
analyzed crack configuration is taken as the ‘‘plateau’’ value at-tained in the analyses. The significant features include: (1) Pop
-values increase with increased -values ofKmaxfor all local criteria
and both material conditions (base plate and overmatch weld); (2)Pop-values decrease with increased values ofKmaxfor the
spec-imen compliance criterion; (3)Pop-values are generally higher for
the base plate material when compared to corresponding values for the overmatch weld; and (4) the 1st-node displacement crite-rion produces the highest closure loads with increased values of
Kmaxfor both material conditions.
5.3. Fatigue behavior including closure effects
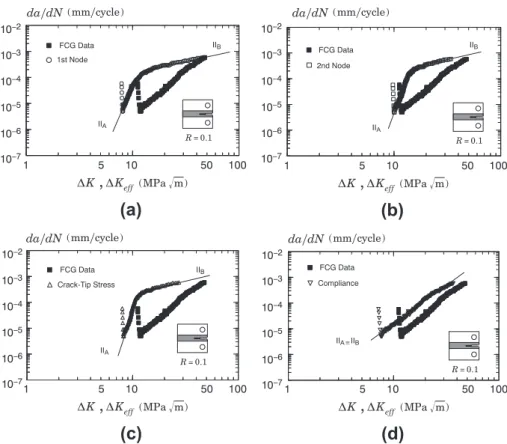
To examine the influence of crack closure loads as determined by the previous evaluation criteria,Figs. 12 and 13shows the fatigue crack growth response for theC(T) specimens in logarithmic scale with both material conditions (base plate material and 45% over-match weld) corrected for closure effects. Here,MKeff¼KmaxKop
as previously defined. To facilitate comparison, these plots also in-clude the experimental fatigue crack growth data measured using the testedC(T) specimens presented previously in Section4.2. Since they represent the experimentally measured data (no closure effects are considered), the corresponding fatigue curves are ex-pressed in terms ofMKrather thanMKeffas indicated in the plots.
The sets of results inFigs. 12 and 13demonstrate that fatigue crack growth response for the tested materials can be strongly affected by the adopted crack closure criterion. From these results, some key conclusions can be drawn. First, the 1st-node
(a)
(b)
Fig. 11.Evolution of the normalized closure load,Pop=Pmax, with increased values ofKmax, for both base plate and overmatch condition.
(a)
(c)
(d)
(b)
displacement criterion yields the largest correction of the measured fatigue curves. Second, the effects of crack closure on the measured fatigue curves are more prominent at early stages of fatigue crack growth corresponding to lower values of appliedMK, particularly for the 1st and 2nd node displacement criteria. At later stages of fatigue crack extension (higherMK-values), however, closure effects on the fatigue curves appear to diminish. Third, the relative effects of crack closure on the measured fatigue curves are similar irrespective of whether the base plate or overmatch material are considered.
5.4. Crack closure effects on fatigue life predictions
To further demonstrate the effects of crack closure criteria on fatigue behavior, the previously corrected curves are used to predict the fatigue life of the testedC(T) specimens for both mate-rial conditions. The evolution ofda=dNwithMKefffor all sets of
re-sults displayed inFigs. 12 and 13provides the basis to determine the number of cycles to failure, Nf, based on integration of the
modified Paris law described by previous Eq.(3). Such an analysis serves as a prototype for a wide class of integrity assessment and remaining life problems involving fitness-for-service evaluations of structural components containing crack-like flaws such as BS 7910[43]and API 579[44].
However, estimation ofNf by integration of the fatigue curves
corrected for closure using Eq.(3)raises practical difficulties re-lated to the nonlinear dependence of logðda=dNÞvs. log MKeff
in the region corresponding to stage II of fatigue crack propagation. As can be seen in the plots ofFigs. 12 and 13, there is a clear depar-ture of the corrected fatigue curves from a linear behavior, partic-ularly for the 1st-node and 2nd-node displacement criteria for both material conditions. As a simple approximation, we can model such behavior by describing the evolution of logðda=dNÞ
vs. log MKeff
as a bilinear function so that region II of fatigue crack propagation can be identified as two substages, denotedIIAandIIB.
Each substage refers to a linear dependence of logðda=dNÞ vs. log MKeff
thereby permitting simpler integration of Eq.(3)over substages IIA and IIB. Such a procedure is a direct analog of the
methodology adopted by BS 7910[43]and API 579[44]to describe experimentally measured fatigue curves used in remaining life assessments.
Figs. 12 and 13include straight lines derived from a best fit that defines the bilinear behavior of the fatigue curves corrected for clo-sure based on the above procedure. The fit was made over the
stress intensity factor range starting at MKeff¼ 105=C 1=m
to theMKeff corresponding to final failure for the tested C (T)
speci-mens (base plate and overmatch weld condition).Table 3provides the coefficients C and m for each of the substagesIIAandIIB
corre-sponding to the corrected data sets which then entail integration of Eq.(3)to generate the number of cycles to failure,Nf, for each
ana-lyzed case.Table 4compares the predicted values ofNf, denoted
Nfpred, and measured experimental number of cycles to failure,
Nfexp, for the tested C (T) specimens based upon different crack
closure criteria. To facilitate interpretation of closure effects (and associated crack closure criterion) on predicted number of cycles to failure, this table also includes predicted values ofNf derived
from integrating the experimentally measured fatigue curves (which are not corrected for closure).
The results displayed by these analyses are rather conclusive and reveal a clear sensitivity of fatigue life predictions on crack clo-sure load estimates. Consider first the values ofNfpred
correspond-ing to the experimentally measured fatigue curves (for which no closure effect is included); here, the analyses largely underesti-mates the measured number of cycles to failure,Nfexp. Now direct
attention to the fatigue life predictions using the four crack closure criteria. Errors in predicted values ofNf range from12% to less
than 1% depending on the closure criterion and material condition. Overall, the significant features associated with these results
(a)
(b)
(c)
(d)
include: (1) Analyses using the 1st-node displacement criterion provide predictions of fatigue life in good agreement with the mea-sured number of cycles to failure, yielding values ofNfpredwithin
2% ofNfexp; however, the analyses result in nonconservative
pre-dictions for the C (T) specimen made of the base plate material; (2) there is no clear trend that could suggest a coupling between the closure criteria and material condition for the analyzed cases; for example, the specimen compliance criterion provides the largest error in fatigue life prediction for the base plate material whereas the crack-tip stress criterion translates into a lower value ofNfpred
for the overmatch weld; and (3) analyses using the 2nd-node dis-placement criterion appear to produce more consistent predictions of fatigue life since relative values ofNfpred=Nfexpare fairly similar
irrespective of material condition.
6. Concluding remarks
The 3-D finite element simulations under constant amplitude loading of fatigue crack propagation provide quantitative estimates of plasticity-induced crack closure (PICC) loads for homogeneous and weldedC(T) fracture specimens. The numerical computations are conducted on crack models subjected to cyclic loading under prescribed remote stresses to simulate the formation of a plastic wake behind the fatigue crack tip as the macroscopic crack advances through nodal release by one element size each cycle. Estimation of crack closure loads based onKop-values derive from
three different methodologies which include: (a) node displace-ment procedure, (b) crack-tip stress evolution and (c) specimen compliance measurements.
The extensive finite element analyses described here demon-strate a rather strong dependence of PICC load estimates on the adopted technique. For the analyzed materials and crack configura-tions, the 1st-node displacement criterion and, to a lesser degree, the crack-tip stress criterion provide consistently the largest estimates of PICC loads for essentially all reported cases. In contrast, the 2nd-node displacement criterion and the specimen compliance criterion produce lower estimates of PICC load; however, these two criteria
result in mixed trends as their relative differences is rather sensitive to material condition (base plate vs. overmatch weld) and crack size. Verification analyses to compare the effectiveness of such meth-odologies in predicting fatigue life for structural components uti-lized experimentally measured fatigue crack growth data derived from plane-sidedC(T) specimens made of an ASTM A516 Gr 70 steel with two mechanical and metallurgical conditions: base plate mate-rial and 45% overmatch weld. Generally good agreement is observed between predicted and experimentally measured fatigue life, par-ticularly when a node displacement procedure is employed to esti-mate PICC loads. While rather limited, our exploratory analyses favor an approach based on the 2nd-node displacement criterion as it appears to provide more consistent predictions of fatigue life for the testedC(T) specimens irrespective of material condition. However, we do recognize that there are inherent uncertainties associated with key modeling and analysis issues which complicate fatigue crack growth simulations and PICC load estimates. This fea-ture can adversely affect fatigue life predictions and potentially hin-der the ‘‘correct’’ safety margin in remaining life assessments involving fitness-for-service evaluations of structural components containing crack-like flaws. Such observations may suggest the crack-tip stress criterion as a more appropriate approach to achieve a better balance between reasonable accuracy in PICC load esti-mates and adequate safety margins. Although additional experi-mental and numerical studies appear necessary to establish a more definite methodology for fatigue life predictions including crack closure effects applicable to structural components with vary-ing geometry and material properties (includvary-ing overmatch welds), the results presented here provide additional support for estimation procedures of plasticity-induced crack closure loads in fatigue anal-yses of structural steels and their weldments.
Acknowledgement
This investigation is supported by Fundação de Amparo á Pesquisa do Estado de São Paulo (FAPESP) through a graduate scholarship (2008/54130–4) provided to the first author (DFBS).
Table 3
CoefficientsCandmdefining the bilinear fitting on the log–log plot corresponding to the Paris law describing the corrected data in substages IIAand IIBregion.
Data set Closure criterion Bilinear fitting
Stage IIA Stage IIB
m C(MPa, m) m C(MPa, m)
Base plate 1st-Node displ. 16.64 8.321020 1.37 6.81106
2nd-Node displ. 9.25 1.051014 1.62 2.36106
Crack-tip stress 12.21 8.401017 1.58 3.99106
Compliance 3.71 3.17109 3.71 3.17 109
Overmatch weld 1st-Node displ. 7.90 4.981013 0.95 1.63105
2nd-Node displ. 10.98 4.661017 1.38 5.16106
Crack-tip stress 12.28 2.931017 1.22 1.11105
Compliance 3.06 1.27108 3.06 1.27 108
Table 4
Comparisons of crack closure effects on predicted fatigue life for testedC(T) specimens with homogeneous material and overmatch weld.
Data set Closure criterion Nf-pred Nf-pred/Nf-exp
Base plate (Nfexp= 690,045) No closure 555,046 0.804
1st-Node displ. 694,924 1.007 2nd-Node displ. 659,876 0.956 Crack-tip stress 648,066 0.939
Compliance 606,104 0.878
Overmatch weld (Nf-exp= 615,171) No closure 508,222 0.826
1st-Node displ. 601,653 0.978 2nd-Node displ. 593,090 0.964 Crack-tip stress 551,323 0.896
The work of CR is supported by the Brazilian Council for Scientific and Technological Development (CNPq) through Grants 304132/ 2009–8 and 476581/2009–5. The authors acknowledge the useful discussions and the experimental support for the fatigue testing and residual stress measurements provided by Gustavo H.B. Dona-to (FEI University).
References
[1] Kerr WH. A review of factors affecting toughness in welded steels. Int J Pres Ves Pip 1976;4:119–41.
[2] American Welding Society, Welding handbook: welding technology, 8th ed., vol. 1. Miami: American Welding Society; 1987.
[3] Jutla T. Fatigue and fracture control of weldments. In: Metals handbook. Fatigue and fracture, Vol. 19. American Society for Metals; 1996. p. 434–49. [4] Dowling NE. Mechanical behavior of materials: engineering methods for
deformation, fracture and fatigue. 2nd ed. New Jersey: Prentice Hall; 1999. [5] Gurney TR. Fatigue of welded structures. 2nd ed. Cambridge University Press;
1979.
[6] Mayer H, Stark HL, Ambrose S. Review of fatigue design procedures for pressure vessels. Int J Pres Ves Pip 2000;77:775–81.
[7] Gurney TR, Maddox SJ. A re-analysis of fatigue data for welded joints in steel. Weld Res Int 1973;3:1–54.
[8] American Welding Society, Structural welding code – steel, AWS D1.1/ D1.1M:2004; 2004.
[9] British Institution, Fatigue design of offshore steel structures, BS 7608; 1993. [10] Det Norske Veritas, Fatigue design of offshore steel structures, Recommended,
Practice RP-C203; 2005.
[11] Maddox SJ. Fatigue strength of welded structures. 3rd ed. Boca Raton, FL: CRC Press; 2007.
[12] Lassen T, Récho N. Fatigue life analyses of welded structures. London: ISTE Ltd; 2006.
[13] Benoit D, Lieurade H-P, Truchon M. A study of the propagation of fatigue cracks in the heat-affected zones of welded joints in E-36 steel. In: European Offshore Steels Research Seminar, Cambridge, United Kingdom; 1978.
[14] Link LR. Fatigue crack growth of weldments. In: McHenry HI, Potter JM, editors. Fatigue and fracture testing of weldments. ASTM STP, 1058. Philadelphia: American Society for Testing and Materials; 1990. p. 16–33. [15] Shankar K, Wu W. Effect of welding and weld repair on crack propagation
behavior in aluminum alloy 5083 plates. Mater Des 2002;23:201–8. [16] Elber W. Fatigue crack closure under cyclic tension. Eng Fract Mech
1970;5:37–45.
[17] Anderson TL. Fracture Mechanics: Fundaments and Applications. 3rd ed. Boca Raton, FL: CRC Press; 2005.
[18] Suresh S. Fatigue of Materials. 2nd ed. Cambridge: Cambridge University Press; 1998.
[19] Stephens RI, Fatemi A, Stephens RR, Fuchs HO. Metal fatigue in engineering. New York: John Wiley & Sons; 2001.
[20] Solanki K, Daniewicz SR, Newman JC. Finite element analysis of plasticity-induced fatigue crack closure: An overview. Eng Fract Mech 2004;71: 149–71.
[21] Schijve J. Four lectures on fatigue crack growth, Tech. Rep. LR-254, Delft University of Technology, Delft, The Netherlands; 1977.
[22] American Society for Testing and Materials. Standard test method for measurement of fatigue crack growth rates, ASTM E647–08; 2008.
[23] Schijve J. Regression analysis to find the transition from linear to non-linear function, Doc. B2–91-06 (Applications to Results of Crack Growth Measurements), Faculty of Aerospace Engineering, Delft University of Technology, The Netherlands; 1991.
[24] Carman C, Turner C, Hillberry B. A method for determining crack opening load from load-displacement data. In: Newman JC, Elber W, editors. Mechanics of fatigue crack growth. ASTM STP, vol. 982. Philadelphia: American Society for Testing and Materials; 1988. p. 214–21.
[25] Stoychev S, Kujawsky D. Method for crack opening load and crack tip shielding determination: a review. Fatigue Fract Eng Mater Struct 2003;26:1053–67. [26] Xu Y, Gregson PJ, Sinclair I. Systematic assessment and validation of
compliance-based crack closure measurements in fatigue. Mater Sci Eng A 2000;284:114–25.
[27] Newman JC. A finite element analysis of crack closure. In: Rice JR, Paris PC, editors. Mechanics of Fatigue Crack Closure. ASTM STP, vol. 590. Philadelphia: American Society for Testing and Materials; 1976. p. 281–301. [28] McClung R, Sehitoglu H. On the finite element analysis of fatigue crack closure
– I: Basic modeling issues. Eng Fract Mech 1989;33:237–52.
[29] Sehitoglu H, Sun W. Modelling of plane strain fatigue crack closure. ASME J Eng Mater Technol 1991;113:131–41.
[30] Wu J, Ellyin F. A study of fatigue crack closure by elastic-plastic finite element analysis for constant-amplitude loading. Int J Fract 1996;82:43–65. [31] Roychowdhury S, Dodds RH. A numerical investigation of 3-D small-scale
yielding fatigue crack growth. Eng Fract Mech 2003;70:2363–83.
[32] Simandjuntak S, Alizadeh H, Smith DJ, Pavier MJ. Fatigue crack closure of a corner crack: a comparison of experimental results with finite element predictions. Int J Fatigue 2005;27:914–9.
[33] McClung R, Davidson D. High resolution numerical and experimental studies of fatigue cracks. Eng Fract Mech 1991;39:113–30.
[34] Matos P, Nowell D. Experimental and numerical investigation of thickness effects in plasticity-induced fatigue crack closure. Int J Fatigue 2009;31:1795–804.
[35] Daniewicz S, Ismonov S. Simulation and comparison of several crack closure assessment methodologies. Int J Fatigue 2010;32:428–33.
[36] Lugo M, Daniewicz S, Newman JC. A mechanics based study of crack closure measurements techniques under constant amplitude loading. Int J Fatigue 2011;33:186–93.
[37] Sarzosa DFB, Ruggieri C, Godefroid LB, Donato GHB. Fatigue life estimation of welded joints including the effects of crack closure phenomena. In: 30th International Conference on Ocean, Offshore and Arctic Engineering (OMAE). Rotterdan The Netherlands; 2011.
[38] Wei L-W, James MN. A study of fatigue crack closure in polycarbonate ct specimens. Eng Fract Mech 2000;66:223–42.
[39] Kim J-S, Kang JY, Song J-H. Elucidation of fatigue crack closure behavior in surface crack by 3-d finite element analysis. Int J Fatigue 2007;29:168–80. [40] Gullerud A, Koppenhoefer K, Roy A, RoyChowdhury S, Walters M, Bichon B,
et al. WARP3D: Dynamic nonlinear fracture analysis of solids using a parallel computers and workstations. Structural Research Series (SRS 607) UILU-ENG-95-2012, University of Illinois at Urbana-Champaign; 2004.
[41] Anderoglu O. Residual stress measurements using x-ray diffraction, M.Sc. Thesis, Texas A&M University; 2004.
[42] Sarzosa DFB. Fatigue life evaluation of homogeneous materials and welded joints including crack closure effects, Ph.D Thesis, University of Sao Paulo, (in Portughese); 2012.
[43] British Institution, Guide to methods for assessing the acceptability of flaws in metallic structures, BS 7910; 2005.