ISSN 0975-928X
Research Article
Genetic analysis for water use efficiency traits, yield and yield attributes in
groundnut (
Arachis hypogaea
L.)
K.John, P.Raghava Reddy1, P.Hariprasad Reddy, P.Sudhakar and N.P.Eswar Reddy
Regional Agricultural Research Station, Tirupati-517502 1
Former Vice- Chancellor, N>G.Ranga Agricultural University, Andhra Pradesh Email: [email protected]
(Received:15 Mar 2011; Accepted: 01 Jun 2011)
Abstract:
JL-220 recorded the highest per se performance for number of well-filled and mature pods per plant, 100-kernel weight, harvest index and protein per cent. ICGV-99029 recorded the maximum per se performance for number of secondary branches per plant, stomatal conductance, kernel yield per plant and pod yield per plant Number of secondary branches per plant had high heritability coupled with high genetic advance as per cent of mean is controlled by additive gene effects and is least influenced by environment and therefore selection would be very effective. Moderate heritability and high genetic advance as per cent of mean were observed for specific leaf weight, number of well-filled and mature pods per plant and dry haulms yield per plant indicating importance of both additive and non-additive gene action in the inheritance of these traits.
Key words: Groundnut, Water use efficiency, Heritability, Genetic advance.
Introduction:
Groundnut is an important oilseed crop grown in India and is largely cultivated in dry lands. Drought is the most important factor limiting the yield potential of the rain-fed crop. Although high yield potential is the target of most crop breeding programs, it might not be compatible with superior drought resistance. On the other hand, high yield potential can contribute to yield in moderate stress environments. Recent research breakthroughs have revived interest in targeted drought resistance breeding and use of new genomic tools to enhance crop water use efficieny. However, with the fast progress in genomics, a better understanding of the gene functions and physiological mechanism for drought tolerance will be essential for the progress of genetic enhancement of crop for water use efficieny. Crop physiologists have identified a number of traits that would help the breeder in development and identification of moisture stress tolerant genotypes with high yield potential (Basu
et al.,2004) The present study is aimed at evaluating the genetic parameters for water use efficiency traits, yield and yield attributes for efficient selection in segregating generations.
Material and methods
The material for the present study considered of parents and F1 crosses involving eight parents viz., Tirupati-4, TIR-25, ICGV-91114, TCGS-584, JL-220, ICGV-99029, K-1375 and TCGS-647. Eight parents were crossed in a half-diallel manner to generate 28 crosses during rabi 2008. Twenty
ISSN 0975-928X
visual maturity symptoms of leaves and pods on plot basis was recorded. . The data were analyzed statistically and genetic parameters viz., Phenotypic and Genotypic coefficients of variation (PCV and GCV) were computed according to Burton (1952). Heritability in broad sense was estimated using the formula of Allard (1960). Genetic advance (GA) was calculated as per the formula suggested by Johnson et al. (1955).
Results and discussion
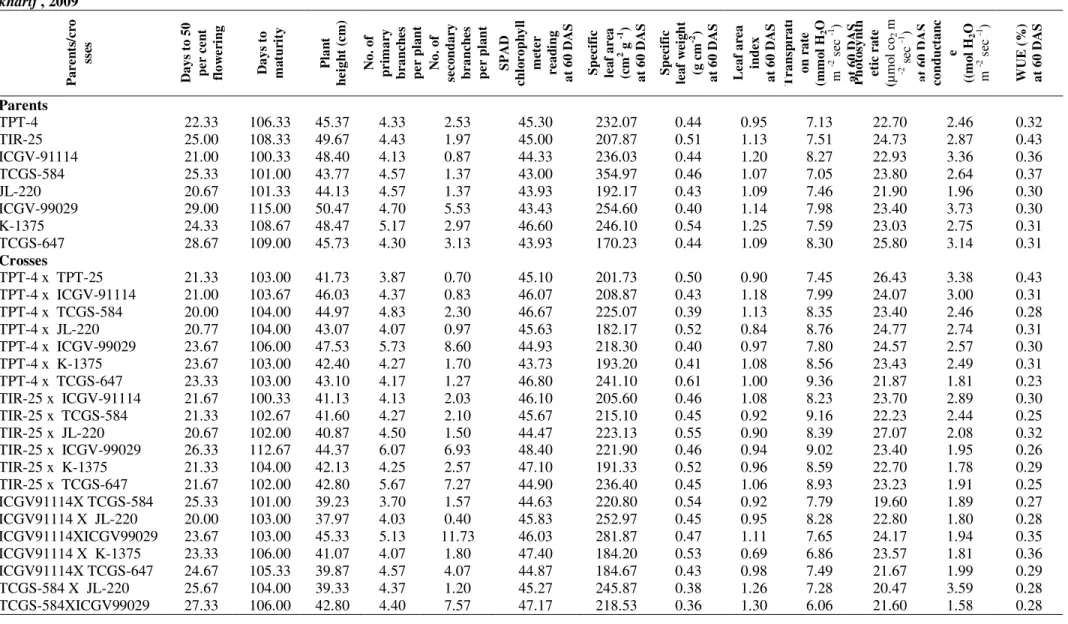
The analysis of variance revealed significant differences for all the traits studied. The results are presented in the Tables 1, 2 and 3. Out of the eight parents used in the study, TCGS-584 and JL-220 showed the lowest per se performance for 50% flowering and days to maturity. These two genotypes came to maturity early. JL-220 recorded the highest per se performance for number of well-filled and mature pods per plant, 100-kernel weight, harvest index and protein per cent. TPT-4 showed the highest per se performance for shelling per cent (Table 1). The parental genotype, K-1375 exhibited the highest per se
performance for number of primary branches per plant, SCMR (SPAD chlorophyll meter reading), specific leaf weight, leaf area index, sound mature kernel per cent and oil per cent. The other parent
viz., ICGV-99029 recorded the maximum per se
performance for number of secondary branches per plant, stomatal conductance, pod and kernel yield per plant. The highest per se performance for water use efficiency and dry haulms yield per plant were registered by TIR-25 while TCGS-647 exhibited the lowest per se performance for specific leaf area and highest per se performance for transpiration rate and photosynthetic rate.
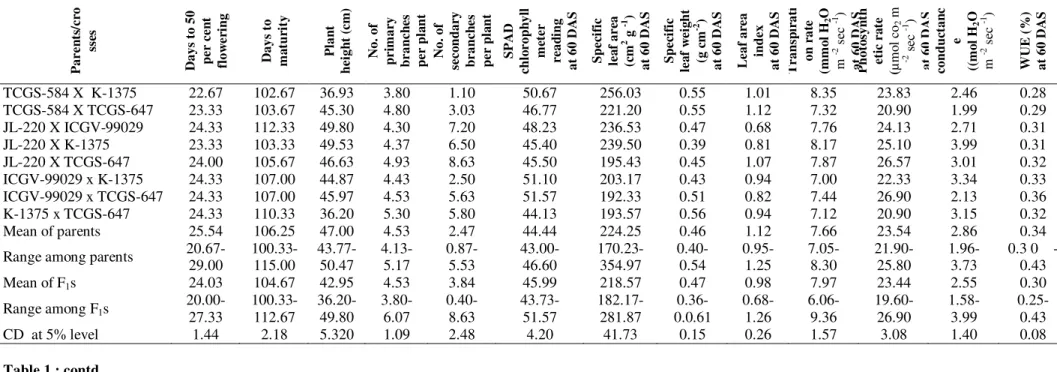
F1s from TPT-4 x ICGV-99029 was distinct for its highest mean value for number of primary branches per plant, number of mature pods per plant, shelling per cent, dry haulms yield per plant, pod and kernel yield per plant during kharif. (Table 1). Other F1s, involving TPT-4 as one of parents showing lowest per se performance is TPT-4 x TCGS-58TPT-4 for days to 50 per cent flowering and highest per se performance was recorded by the F1s, TPT-4 x TCGS-647 for both specific leaf weight and transpiration rate, TPT-4 x TIR-25 for water use efficiency, TPT-4 x JL-220 for SMK per cent and low per se performance for specific leaf area. The F1 s involving ICGV-99029 as one of the parents viz., ICGV-91114 x ICGV-99029 for number of secondary branches per plant, ICGV-99029 x TCGS-647 for both SCMR and photosynthetic rate, TCGS-584 x ICGV-99029 for both leaf area index and protein per cent showed the highest per se performance. The F1 crosses, TIR-25 x ICGV-91114 recorded the lowest per se
performance for days to 50 per cent flowering and
K-1375 x TCGS-647 for plant height. The other F1s, viz., Jl-220 x TCGS-647 for 100-kernel weight, TIR-25 x JL-220 for harvest index and ICGV-91114 x K-1375 for oil per cent showed the highest per se performance. These results were confirmed with the findings of Nath and Alam, 2002.
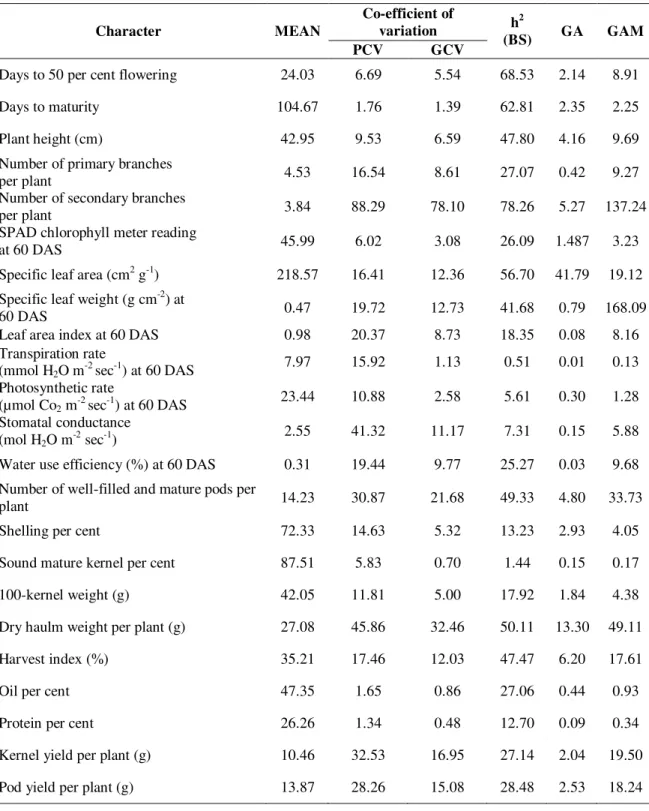
Higher PCV was recorded for number of primary branches per plant and stomatal conductance and moderate values for leaf area index, number of mature pods per plant, dry haulms yield per plant, kernel yield per plant and pod yield per plant and rest of the characters showed lower PCV values.
GCV values revealed that all the characters except number of secondary branches per plant, number of well-filled and mature pods per plant and dry haulms yield per plant had narrow genetic variability and thereby offering a limited opportunity to improve further these characters (Table 2). Similar results were obtained by Quadri and Khunti (1982), Mishra and Yadava (1992), Nisar Ahmed (1995), Naik et al. (2000), Parameshwarappa et al. (2004) and Korat et al.
(2009).
Heritability estimates indicate the heritable portion of the variation and the estimation of genetic advance would show the extent of genetic gain that could be expected through selection in the character to be improved upon (Burton, 1952 and Johnson et al., 1955). Heritability in broad sense includes additive and epistatic gene effects, and therefore it will be reliable only if accompanied by
high genetic advance Ramanujam and
Thirumalachari (1967).
ISSN 0975-928X
The genetic gain that can be expected by selection for a character is given by the estimates of genetic advance. Among the characters studied, number of secondary branches per plant, specific leaf weight, number of well-filled and mature pods per plant and dry haulms yield per plant showed high genetic advance as per cent of mean (GAM). Reddy and Gupta (1992) reported similar results. Moderate GAM recorded for specific leaf area, harvest index, kernel yield per plant and pod yield per plant. However days to 50 per cent flowering, days to maturity, plant height, number of primary branches per plant, SPAD chlorophyll meter reading, leaf area index, transpiration rate, photosynthetic rate, stomatal conductance, water use efficiency, shelling per cent, sound mature kernel per cent, 100-kernel weight, oil per cent and protein per cent exhibited low genetic advance as per cent of mean. Nagabhushanam et al. (1982), Vasanthi and Raja Reddy (2002) and Seethala Devi (2004) reported low genetic advance as per cent of mean for pod yield per plant.
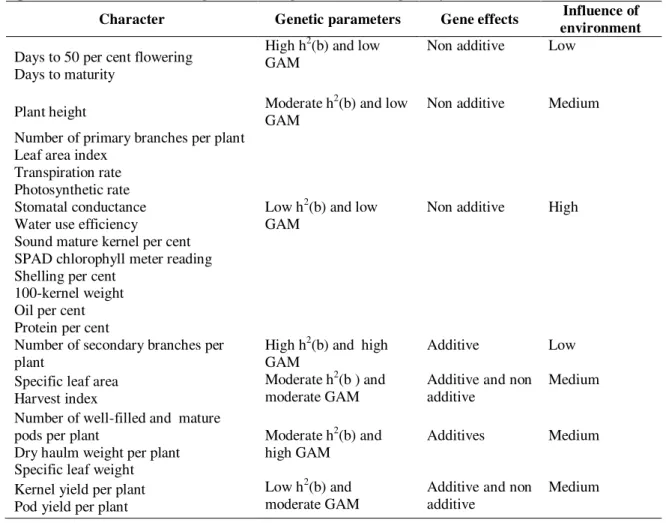
Moderate heritability and moderate GAM recorded for specific leaf area and harvest index showed additive gene effects. High heritability and low GAM was observed for days to 50 per cent flowering and days to maturity which indicated the importance of non-additive gene action. Low heritability and moderate GAM was noticed for pod and kernel yield per plant indicating the importance of additive gene effects and selection for such characters may be rewarding.
Moderate heritability and low GAM was observed for plant height, whereas low heritability and low gain was observed for number of primary branches per plant, SPAD chlorophyll meter reading values, leaf area index, transpiration rate, photosynthetic rate, stomatal conductance, shelling per cent, sound mature kernel per cent, 100-kernel weight, oil per cent and protein per cent indicating the preponderance of non-additive gene action in inheritance of these characters. Hence, selection for these characters is not effective in early segregating generations and has to be carried in later generations.
It is evident that number of secondary branches per plant had high heritability coupled with high GAM which indicated this trait is controlled by additive gene effects and is least influenced by environment (Table 3), facilitating very effective selection. Moderate heritability and high GAM was observed for specific leaf weight, number of well-filled and mature pods per plant and dry haulms yield per plant indicating importance of both additive and non-additive gene action in the inheritance of these traits.
References
Allard, R .W., 1960, Principles of Plant Breeding John Wiley and Sons, Inc., USA Wiley International Edition pp.85.
Basu, M.S., Chunilal and Prakash C. Nautiyal (2004) Breeding strategies to increase water use efficiency of groundnut. Groundnut Research in India, Edited by M.S.Basu and N.B.Singh. pp. 38-47.
Burton, G. W., 1952, Quantitative inheritance in grass. Proceed. of sixth international grassland congress, 1: 227-283.
Johnson, H, W., Robinson, H. F., and Comstock, R. E., 1955, Estimates of genetic and environmental variability in soybean. Agron. J.47: 413-418. Korat, V .P., Pithia, M. S., Savaliya, J. J., Pansuriya,
G., and Sodavadiya, P. R., 2009, Studies on genetic variability in different genotypes of groundnut (Arachis hypogaea L.). Legume Res.,32 (3):224-226.
Mishra, L. K., and Yadava, R. K., 1992, Genetic variability and correlation studies in summer groundnut. Advances in summer groundnut. Advanced Plant Sci.,5: 106-110.
Nagabhushanam, G. V. S., Subramanyam, D., and Sree Rama Rreddy, N., 1982, Studies on variability, heritability and genetic advance in groundnut (Arachis hypogaea L.). The Andhra Agri. J.,
29: 264-267.
Naik, K. S. S., Reddy, P. N., and Reddy, C. D. R., 2000, Variability studies in F2 populations of some sub-specific crosses in groundnut. National Seminar on Oilseeds and Oil Research and Development needs in the Millennium 2-4. Nath, U.K and Alam, M.S., 2002, Genetic variability,
heritability and genetic advance of yield and related traits of groundnut (Arachis hypogaea L.). OnLine J. Biological Sci. 2 (11): 762-764. Nisar Ahmed., 1995, Heterosis, combining ability and
inter relationships among yield and yield attributes in groundnut (Arachis hypogaea L.) M.Sc. (Ag.) Thesis, Andhra Pradesh Agricultural University, Hyderabad, India. Parameshwarappa, K. G., Kenchanagoud, A. R., Bentur,
M. G., and Patil, R. K., 2004.,Genetic variability in the adapted genotypes of Spanish bunch groundnut pp. 74-75. Short Papers
Presented at the National Symposium On “
Enhancing Productivity of Groundnut for
Sustaining Food and Nutritional Security” 11 -13 October-2004 at NRCG, Junagadh.
Parmar, D. L., Kumar, A. L. R., and Bharodia, P. S., 2000, Genetic analysis of pod and seed characters in crosses of large seeded Virginia genotypes of groundnut. Internat. Arachis Newsl., No. 20, 10-11.
Quadri, M. J., and Khunti, U. P., 1982, Genetic variability in bunch groundnut. Crop Improv.,
9: 98-100.
Ramanujam, S., and Thirumalachari, D. K., 1967, Genetic variability of certain characters in red pepper. Mysore J. Agri. Sci.,1: 30-36. Reddy, K. R., and Gupta, R. V. S., 1992, Variability and
ISSN 0975-928X
Seethala Devi, G., 2004, Genetic studies on certain morphological and physiological attributes in 10 F2 populations of groundnut (Arachis hypogaea L.) M.Sc. (Ag.) Thesis, Acharya N.G. Ranga Agricultural University, Hyderabad.
Vasanthi, R. P., and Raja Reddy, C., 2002, Variability in F2 generation of five groundnut crosses involving foliar disease resistant genotypes. J. Res. Acharya N.G.Ranga Agrl. Univ., 30(2):
137-142.
ISSN 0975-928X
Table 1 : Performance of F1s and parents for different water use efficiency traits, yield and yield attributes in groundnut during
kharif , 2009
P ar e n ts /c ro ss es D ays t o 50 p e r c e n t fl ow e ri n g D ays t o m a tu ri ty P lan t h e igh t (c m ) N o. of p r im ar y b r an c h e s p e r p la n t N o. of se c o n d ar y b r an c h e s p e r p la n t S P A D c h lo r op h yl l m et e r r e ad in g at 60 D A S S p e ci fi c le a f ar ea (c m
2 g -1 ) at 60 D A S Sp e ci fi c le a f w e ig h t (g cm -2 ) at 60 D A S L e af ar e a in d e x at 60 D A S T r an sp ir at i on r at e (m m o l H2 O m
-2 s
ec -1 ) at 60 D A S P h ot o syn th e ti c r a te ( µ m o l co 2 m
-2 s
ec -1 ) at 60 D A S S to m at al c on d u ct an c e (( m o l H2 O m
-2 s
ec -1 ) at 60 D A S WU E ( % ) at 60 D A S Parents
TPT-4 22.33 106.33 45.37 4.33 2.53 45.30 232.07 0.44 0.95 7.13 22.70 2.46 0.32
TIR-25 25.00 108.33 49.67 4.43 1.97 45.00 207.87 0.51 1.13 7.51 24.73 2.87 0.43
ICGV-91114 21.00 100.33 48.40 4.13 0.87 44.33 236.03 0.44 1.20 8.27 22.93 3.36 0.36
TCGS-584 25.33 101.00 43.77 4.57 1.37 43.00 354.97 0.46 1.07 7.05 23.80 2.64 0.37
JL-220 20.67 101.33 44.13 4.57 1.37 43.93 192.17 0.43 1.09 7.46 21.90 1.96 0.30
ICGV-99029 29.00 115.00 50.47 4.70 5.53 43.43 254.60 0.40 1.14 7.98 23.40 3.73 0.30
K-1375 24.33 108.67 48.47 5.17 2.97 46.60 246.10 0.54 1.25 7.59 23.03 2.75 0.31
TCGS-647 28.67 109.00 45.73 4.30 3.13 43.93 170.23 0.44 1.09 8.30 25.80 3.14 0.31
Crosses
TPT-4 x TPT-25 21.33 103.00 41.73 3.87 0.70 45.10 201.73 0.50 0.90 7.45 26.43 3.38 0.43
TPT-4 x ICGV-91114 21.00 103.67 46.03 4.37 0.83 46.07 208.87 0.43 1.18 7.99 24.07 3.00 0.31
TPT-4 x TCGS-584 20.00 104.00 44.97 4.83 2.30 46.67 225.07 0.39 1.13 8.35 23.40 2.46 0.28
TPT-4 x JL-220 20.77 104.00 43.07 4.07 0.97 45.63 182.17 0.52 0.84 8.76 24.77 2.74 0.31
TPT-4 x ICGV-99029 23.67 106.00 47.53 5.73 8.60 44.93 218.30 0.40 0.97 7.80 24.57 2.57 0.30
TPT-4 x K-1375 23.67 103.00 42.40 4.27 1.70 43.73 193.20 0.41 1.08 8.56 23.43 2.49 0.31
TPT-4 x TCGS-647 23.33 103.00 43.10 4.17 1.27 46.80 241.10 0.61 1.00 9.36 21.87 1.81 0.23
TIR-25 x ICGV-91114 21.67 100.33 41.13 4.13 2.03 46.10 205.60 0.46 1.08 8.23 23.70 2.89 0.30
TIR-25 x TCGS-584 21.33 102.67 41.60 4.27 2.10 45.67 215.10 0.45 0.92 9.16 22.23 2.44 0.25
TIR-25 x JL-220 20.67 102.00 40.87 4.50 1.50 44.47 223.13 0.55 0.90 8.39 27.07 2.08 0.32
TIR-25 x ICGV-99029 26.33 112.67 44.37 6.07 6.93 48.40 221.90 0.46 0.94 9.02 23.40 1.95 0.26
TIR-25 x K-1375 21.33 104.00 42.13 4.25 2.57 47.10 191.33 0.52 0.96 8.59 22.70 1.78 0.29
TIR-25 x TCGS-647 21.67 102.00 42.80 5.67 7.27 44.90 236.40 0.45 1.06 8.93 23.23 1.91 0.25
ICGV91114X TCGS-584 25.33 101.00 39.23 3.70 1.57 44.63 220.80 0.54 0.92 7.79 19.60 1.89 0.27
ICGV91114 X JL-220 20.00 103.00 37.97 4.03 0.40 45.83 252.97 0.45 0.95 8.28 22.80 1.80 0.28
ICGV91114XICGV99029 23.67 103.00 45.33 5.13 11.73 46.03 281.87 0.47 1.11 7.65 24.17 1.94 0.35
ICGV91114 X K-1375 23.33 106.00 41.07 4.07 1.80 47.40 184.20 0.53 0.69 6.86 23.57 1.81 0.36
ICGV91114X TCGS-647 24.67 105.33 39.87 4.57 4.07 44.87 184.67 0.43 0.98 7.49 21.67 1.99 0.29
TCGS-584 X JL-220 25.67 104.00 39.33 4.37 1.20 45.27 245.87 0.38 1.26 7.28 20.47 3.59 0.28
ISSN 0975-928X
Table 1 : contd.
P ar e n ts /c ro ss es D ays t o 50 p e r c e n t fl ow e ri n g D ays t o m a tu ri ty P lan t h e igh t (c m ) N o. of p r im ar y b r an c h e s p e r p la n t N o. of se c o n d ar y b r an c h e s p e r p la n t S P A D c h lo r op h yl l m et e r r e ad in g at 60 D A S S p e ci fi c le a f ar ea (c m
2 g -1 ) at 60 D A S S p e ci fi c le a f w e ig h t (g cm -2 ) at 60 D A S L e af ar e a in d e x at 60 D A S T r an sp ir at i on r at e (m m o l H2 O m
-2 s
ec -1 ) at 60 D A S P h ot o syn th e ti c r a te ( µ m o l co 2 m
-2 s
ec -1 ) at 60 D A S S to m at al c on d u ct an c e (( m o l H2 O m
-2 s
ec -1 ) at 60 D A S WU E ( % ) at 60 D A S
TCGS-584 X K-1375 22.67 102.67 36.93 3.80 1.10 50.67 256.03 0.55 1.01 8.35 23.83 2.46 0.28
TCGS-584 X TCGS-647 23.33 103.67 45.30 4.80 3.03 46.77 221.20 0.55 1.12 7.32 20.90 1.99 0.29
JL-220 X ICGV-99029 24.33 112.33 49.80 4.30 7.20 48.23 236.53 0.47 0.68 7.76 24.13 2.71 0.31
JL-220 X K-1375 23.33 103.33 49.53 4.37 6.50 45.40 239.50 0.39 0.81 8.17 25.10 3.99 0.31
JL-220 X TCGS-647 24.00 105.67 46.63 4.93 8.63 45.50 195.43 0.45 1.07 7.87 26.57 3.01 0.32
ICGV-99029 x K-1375 24.33 107.00 44.87 4.43 2.50 51.10 203.17 0.43 0.94 7.00 22.33 3.34 0.33
ICGV-99029 x TCGS-647 24.33 107.00 45.97 4.53 5.63 51.57 192.33 0.51 0.82 7.44 26.90 2.13 0.36
K-1375 x TCGS-647 24.33 110.33 36.20 5.30 5.80 44.13 193.57 0.56 0.94 7.12 20.90 3.15 0.32
Mean of parents 25.54 106.25 47.00 4.53 2.47 44.44 224.25 0.46 1.12 7.66 23.54 2.86 0.34
Range among parents
20.67-29.00 100.33-115.00 43.77-50.47 4.13-5.17 0.87-5.53 43.00-46.60 170.23-354.97 0.40-0.54 0.95-1.25 7.05-8.30 21.90-25.80 1.96-3.73
0.3 0 -0.43
Mean of F1s 24.03 104.67 42.95 4.53 3.84 45.99 218.57 0.47 0.98 7.97 23.44 2.55 0.30
Range among F1s
20.00-27.33 100.33-112.67 36.20-49.80 3.80-6.07 0.40-8.63 43.73-51.57 182.17-281.87 0.36-0.0.61 0.68-1.26 6.06-9.36 19.60-26.90 1.58-3.99 0.25-0.43
CD at 5% level 1.44 2.18 5.320 1.09 2.48 4.20 41.73 0.15 0.26 1.57 3.08 1.40 0.08
Table 1 : contd.
Parents/crosses
No. of well-filled and mature pods per plant Shelling per cent Sound mature kernel per cent
(%) 100- kernel weight (g) Dry haulm weight per plant (g) Harvest index (%) Oil per cent Protein per cent Kernel yield per plant (g)
Pod yield per plant (g)
Parents
TPT-4 12.47 81.83 87.93 39.77 23.23 38.35 47.63 26.20 14.07 17.30
TIR-25 16.10 73.42 83.83 35.63 27.83 36.27 47.67 26.30 11.51 15.70
ICGV-91114 17.63 79.48 93.50 43.14 16.93 38.29 47.63 26.40 11.51 14.53
TCGS-584 19.07 70.01 90.17 40.71 25.70 40.57 47.73 26.23 10.27 14.67
JL-220 20.90 73.87 90.67 45.28 23.77 41.08 47.80 26.27 12.24 16.57
ICGV-99029 12.33 74.63 89.17 43.03 27.47 32.94 47.60 26.03 14.37 18.53
K-1375 14.97 80.18 92.40 40.98 26.50 38.87 47.93 26.03 13.55 16.90
ISSN 0975-928X
Table 1 : contd.
Parents/crosses
No. of well-filled and mature pods
per plant
Shelling per cent
Sound mature
kernel per cent
(%)
100- kernel weight (g)
Dry haulm weight per
plant (g)
Harvest index
(%)
Oil per cent
Protein per cent
Kernel yield per plant (g)
Pod yield per plant
(g)
Crosses
TPT-4 x TPT-25 14.97 72.74 82.17 35.76 22.33 36.39 47.57 25.63 9.04 12.33
TPT-4 x ICGV-91114 11.67 71.06 89.47 43.25 23.13 35.63 47.93 26.27 9.20 12.80
TPT-4 x TCGS-584 19.80 74.34 91.47 40.80 22.90 41.59 47.37 25.93 11.29 15.30
TPT-4 x JL-220 14.07 79.71 92.83 41.99 22.03 39.70 47.97 25.77 11.46 14.57
TPT-4 x ICGV-99029 23.53 84.48 86.77 42.01 64.43 25.84 47.77 26.47 18.51 21.97
TPT-4 x K-1375 14.67 63.57 90.90 42.43 37.80 33.02 47.73 26.47 11.81 18.43
TPT-4 x TCGS-647 14.10 75.39 90.63 41.71 19.90 40.74 47.80 26.20 10.11 13.53
TIR-25 x ICGV-91114 11.00 82.68 90.47 38.75 18.60 32.81 47.73 26.00 7.67 9.17
TIR-25 x TCGS-584 16.20 82.12 92.67 42.43 15.13 41.80 47.53 26.33 9.22 11.13
TIR-25 x JL-220 19.00 61.64 86.30 40.38 25.47 44.56 47.93 26.13 9.61 15.53
TIR-25 x ICGV-99029 14.73 71.83 87.20 42.57 45.73 29.73 46.87 26.37 11.18 15.63
TIR-25 x K-1375 14.73 75.28 88.83 39.51 25.23 41.73 47.67 26.33 14.00 18.50
TIR-25 x TCGS-647 15.53 77.14 85.70 42.49 34.90 34.21 47.43 26.37 13.58 17.67
ICGV-91114 X TCGS-584 10.00 74.19 89.50 30.29 17.07 35.29 47.50 26.10 6.87 9.27
ICGV-91114 X JL-220 7.80 80.35 88.73 38.86 12.00 40.91 47.20 26.63 6.78 8.47
ICGV-91114 X ICGV-99029 18.63 62.38 82.90 37.50 34.30 27.23 47.67 26.27 11.47 18.00
ICGV-91114 X K-1375 11.33 63.10 85.57 36.82 21.87 35.87 48.07 26.23 7.54 11.90
ICGV-91114 X TCGS-647 12.80 71.23 83.60 34.73 25.53 32.22 47.00 26.43 8.78 12.17
TCGS-584 X JL-220 11.77 71.20 79.60 37.91 17.23 37.16 47.90 26.40 7.34 10.23
TCGS-584 X ICGV-99029 20.60 69.91 86.30 48.64 42.80 32.40 47.53 26.70 13.62 20.20
TCGS-584 X K-1375 9.40 74.11 84.90 45.74 13.87 42.30 47.63 26.73 7.57 10.13
TCGS-584 X TCGS-647 12.00 66.72 85.43 45.33 26.10 33.36 47.20 26.60 8.57 12.80
JL-220 X ICGV-99029 11.40 69.24 87.57 39.75 30.17 27.59 46.83 26.40 7.78 11.20
JL-220 X K-1375 11.47 68.66 89.93 47.95 33.53 27.27 47.10 26.23 8.16 11.90
JL-220 X TCGS-647 14.07 63.16 87.43 49.33 34.23 32.73 45.37 26.33 10.33 16.57
ICGV-99029 x K-1375 15.73 75.31 87.70 36.76 21.63 38.41 46.73 25.80 10.27 13.53
ICGV-99029 x TCGS-647 20.33 73.13 91.30 40.91 28.53 37.93 46.33 25.93 12.42 17.13
ISSN 0975-928X
Table 1 : contd.
Parents/crosses
No. of well-filled and mature pods
per plant
Shelling per cent
Sound mature
kernel per cent
(%)
100- kernel weight (g)
Dry haulm weight per
plant (g)
Harvest index
(%)
Oil per cent
Protein per cent
Kernel yield per plant (g)
Pod yield per plant
(g)
Mean of parents 15.46 74.83 89.03 41.49 24.52 38.18 47.70 26.22 11.81 15.60
Range among parents 10.23-20.90
65.72-81.33
83.83-93.50
35.63-45.28
16.93-27.83
32.94-41.08
47.57-47.93
26.03 - 26.40
6.92-14.37
10.53-18.53
Mean of F1s 14.23 72.33 87.51 42.05 27.08 35.21 47.35 26.26 10.46 13.87
Range among F1s 7.03-23.53
61.64- 84.48
79.60-92.83
30.29-49.33
12.00-64.43
27.27-44.56
45.37-48.07
25.63-26.73
5.85-18.51
8.37-21.97
ISSN 0975-928X
Table 2. Estimates of co-efficient of variation, heritability and genetic advance for water use efficiency traits, yield and yield attributes among 28 F1s and parents in groundnut during kharif, 2009
Character MEAN
Co-efficient of
variation h
2
(BS) GA GAM
PCV GCV
Days to 50 per cent flowering 24.03 6.69 5.54 68.53 2.14 8.91
Days to maturity 104.67 1.76 1.39 62.81 2.35 2.25
Plant height (cm) 42.95 9.53 6.59 47.80 4.16 9.69
Number of primary branches
per plant 4.53 16.54 8.61 27.07 0.42 9.27
Number of secondary branches
per plant 3.84 88.29 78.10 78.26 5.27 137.24
SPAD chlorophyll meter reading
at 60 DAS 45.99 6.02 3.08 26.09 1.487 3.23
Specific leaf area (cm2 g-1) 218.57 16.41 12.36 56.70 41.79 19.12
Specific leaf weight (g cm-2) at
60 DAS 0.47 19.72 12.73 41.68 0.79 168.09
Leaf area index at 60 DAS 0.98 20.37 8.73 18.35 0.08 8.16
Transpiration rate
(mmol H2O m-2 sec-1) at 60 DAS
7.97 15.92 1.13 0.51 0.01 0.13
Photosynthetic rate
(µmol Co2 m-2 sec-1) at 60 DAS 23.44 10.88 2.58 5.61 0.30 1.28
Stomatal conductance (mol H2O m-2 sec-1)
2.55 41.32 11.17 7.31 0.15 5.88
Water use efficiency (%) at 60 DAS 0.31 19.44 9.77 25.27 0.03 9.68
Number of well-filled and mature pods per
plant 14.23 30.87 21.68 49.33 4.80 33.73
Shelling per cent 72.33 14.63 5.32 13.23 2.93 4.05
Sound mature kernel per cent 87.51 5.83 0.70 1.44 0.15 0.17
100-kernel weight (g) 42.05 11.81 5.00 17.92 1.84 4.38
Dry haulm weight per plant (g) 27.08 45.86 32.46 50.11 13.30 49.11
Harvest index (%) 35.21 17.46 12.03 47.47 6.20 17.61
Oil per cent 47.35 1.65 0.86 27.06 0.44 0.93
Protein per cent 26.26 1.34 0.48 12.70 0.09 0.34
Kernel yield per plant (g) 10.46 32.53 16.95 27.14 2.04 19.50
ISSN 0975-928X
Table 3:Comparative statement based on estimates of different genetic parameters for 23 quantitative characters in F1 generation of groundnut during kharif, 2009
Character Genetic parameters Gene effects Influence of
environment
Days to 50 per cent flowering Days to maturity
High h2(b) and low GAM
Non additive Low
Plant height Moderate h
2
(b) and low GAM
Non additive Medium
Number of primary branches per plant Leaf area index
Transpiration rate Photosynthetic rate Stomatal conductance Water use efficiency
Sound mature kernel per cent SPAD chlorophyll meter reading Shelling per cent
100-kernel weight Oil per cent Protein per cent
Low h2(b) and low GAM
Non additive High
Number of secondary branches per plant
High h2(b) and high GAM
Additive Low
Specific leaf area Harvest index
Moderate h2(b ) and moderate GAM
Additive and non additive
Medium
Number of well-filled and mature pods per plant
Dry haulm weight per plant Specific leaf weight
Moderate h2(b) and high GAM
Additives Medium
Kernel yield per plant Pod yield per plant
Low h2(b) and moderate GAM
Additive and non additive