INTRODUCTION
The rubber tree [Hevea brasiliensis (Willd. ex Adr. de Juss.) Muell-Arg] is a tree crop with a long generative and testing cycle. Usually one generative cycle takes four to five years (excluding seven to 10 years of evaluation for parental performance) and about 20 to 30 years for one testing cycle from the time of cross pollination. Thus, one of the most desirable innovations in tree breeding is a tech-nique for predicting the breeding value of material at the juvenile stage (Varghese, 1992).
The rubber tree breeding program of the Instituto Agronômico (IAC) started as early as 1965, but attention to the genetics of this crop only began in the late 1980s when the breeders encountered difficulties in yield im-provement. Attempts have been made with varying degrees of success to predict major economic characters such as yield and vigor of the crop (Moreti et al., 1994; Boock et al., 1995; Gonçalves et al., 1996). No emphasis, however, was given to the genetic aspects of panel disease resis-tance at that time. Only recently, when anthracnose panel canker disease, caused by Colletotrichum gloeosporioides
(Penz.) Sacc., was detected in tapping panels of clone RRIM 600 by Silveira et al. (1992), were genetic studies initiated. This disease has since assumed epidemic pro-portions in many rubber plantations in São Paulo State (Brazil) (Trindade and Furtado, 1997).
The present study was done to analyze the nature of variation of anthracnose panel canker resistance, growth and yield characters and to estimate heritability genetic gains. Attempts have also been made to determine the re-lationship of anthracnose panel canker resistance to other quantitative characters.
MATERIAL AND METHODS
The material for this experiment consisted of seeds from 18 half-sib progenies randomly selected from a popu-lation base from 100 Asiatic clones. They were sown in autumn of 1991 in individual polyethylene bags (12 cm x 18 cm x 18 cm) filled with a mixture of 70% humus and 30% sand. The seedlings remained in these pots during the first six months of the growing season. They were planted out at the Pindorama Experimental Station (21º13’S, 48º56’W) in a randomized complete block de-sign with five replications and 10 seedlings per plot. Space between rows and between trees within rows was 1.5 m. This region has a humid tropical climate with a mean yearly temperature of 21ºC and a red yellow podzolic type soil (Lepsch and Valadares, 1976).
Inoculation
Five sources of Colletotrichum gloesporioides in-oculum from different origins in São Paulo State rubber
GENETICS OF ANTHRACNOSE PANEL CANKER DISEASE RESISTANCE AND ITS
RELATIONSHIP WITH YIELD AND GROWTH CHARACTERS IN HALF-SIB
PROGENIES OF RUBBER TREE (Hevea brasiliensis)
Paulo de Souza Gonçalves1, Edson Luiz Furtado2, Ondino Cleante Bataglia3, Altino Aldo Ortolani4,
André May5 and Giselle Olmos Belletti5
A
BSTRACTRubber tree [Hevea brasiliensis (Willd. ex Adr. de Juss.) Muell-Arg] anthracnose panel canker disease resistance, caused by
Colletotrichum gloeosporioides (Penz.) Sacc., and growth and yield characters were assessed at three years old in the nursery,
in 18 half-sib progenies. There were highly significant (P < 0.01) genetic differences among progenies for most characters. The genetic component of variance accounted for 3.37, 6.07, 12.74, 12.13, 19.82 and 3.58% of the phenotypic variance for anthra-cnose-infected area, anthracnose lesion stripe length, yield, girth, virgin bark thickness and total number of latex vessel rings, respectively. Narrow-sense heritability estimates for the above characters were 13.45, 24.30, 50.97, 48.52, 79.30 and 14.30%, respectively. No significant genetic correlations were found among anthracnose panel canker resistance, yield and growth char-acters. The frequency distribution of anthracnose-infected area and anthracnose lesion stripe length suggests polygenic control. Selecting the best three progenies out of 18 progenies would result in a genetic gain of 12.87 and 24.24% for infected area and lesion stripe length, respectively. The best five selected individuals out of 50 individuals within each progeny would result in a genetic gain of 9.47 and 24.62%, with a total gain of 22.34 and 48.87% for these two characters, respectively.
1Programa Seringueira, Centro de Café e Plantas Tropicais (CCPT), Instituto Agronômico (IAC), Caixa Postal 28, 13001-970 Campinas, SP, Brasil. Send correspondence to P.S.G. Fax: +55-19-241-5188, Ramal 321. E-mail: [email protected]
2Departamento de Defesa Fitossanitária, Faculdade de Ciências Agronô-micas da Universidade Estadual Paulista, Botucatu, SP, Brasil.
tree plantations were mixed and cultured in potato-dex-trose agar (PDA).
The three-yeold rubber tree seedlings were ar-tificially inoculated with the mixed fungus inoculum af-ter seven-day culture during the period from March 20 to 30, 1994. The method of assessing progeny susceptibil-ity to anthracnose panel canker has recently been devel-oped by Silveira et al. (1992). This method involves re-moval of a bark disc (5 mm in diameter) at a height of 1 m from the ground and replacing it with an agar disc of the same size containing mycelia and conidia of the mixed fungus cultured on PDA, and then covered with a poly-ethylene strip.
Measurements
The size of the lesion was determined five weeks after inoculation by paring away the bark. The length and breadth of the lesion were measured.
Yield determination was made using the principle of the Hamker-Morris-Mann test (HMM) (Tan and Subramaniam, 1976), as follows: 30 tappings were made with a half-spiral, alternate daily (1/2S d/3) tapping sys-tem at a height of 20 cm from the ground. Yield recording was done by cup coagulation. The “coagula” were air-dried for a two-month period, until they gave a constant weight. The results of each tree performance were expressed in grams per tapping.
Virgin bark samples were removed from the trunk as plugs at 20 cm height on the opposite side of the tap-ping panel. Bark thickness was measured for each prog-eny.
The total number of latex vessel rings in longitu-dinal and transversal sections of the bark sample was termined. Complete details of the procedure were de-scribed by Gonçalves et al. (1995). Girth was measured with a steel measuring tape at 0.50 m height from the ground.
Biostatistical analysis
Analyses were performed using version 1.0 of the computer program SELEGEN (Resende and Oliveira, 1997). Least square solutions, including expected mean squares and expected mean covariance products, were obtained (Table I). The linear model for the analysis was:
Yijk = µ + pi + bj + eij + dijk
where Yijk = observed value of the kth ortet of the ith
repeti-tion; µ = overall mean; pi = effect of the ith progeny (i = 1,
2 ...p, p = 18); bj = effect of the jth repetition (j = 1, 2...b, b
= 5); eij= interaction between ith progeny and jth repetition;
dijk= effect among plants within the plots due to the tk
indi-vidual of the ithprogeny in the jthrepetition.
Variance and covariance components were calcu-lated through “Expected Mean Square” components given on the right side of the ANOVA table. Duncan’s test was applied to determine which entries were different from each other.
Heritability and gain estimates
Heritabilities on an individual basis (h2), within plot
(h2 ), and among progeny means (h2 ) were worked out for
all the characters using the formula suggested by Vencovsky and Barriga (1992), as follows:
h2 = 4σ2/(σ2 +σ2 + σ2)
h2 = 3σ2 /σ2, and
h2 = σ2/(σ2/nr) + (σ2/r) + σ2
where σ2 = phenotypic variance; σ2 = variance due to
in-teraction of progenies and replication; σ2 = variance due
to differences among progenies; h2 = variance due to
dif-p e
g w
i
w x
p
p
g
i w e
w w
x p w e g
Table I - Degrees of freedom (d.f.), expected mean square (EMS) and expected mean covariance product (EMCP) for estimating components of variance, covariance and heritabilities in an open-pollinated progeny test
of rubber tree (Hevea brasiliensis).
Source of variation d.f. EMS1 EMCP2
Replications r - 1 -
-Progenies g - 1 (1/k) σ2+ σ2 + rσ2 (1/k) Cov
w(xy) + Covrg(xy) + rCovg(xy) Progenies x replications (r - 1) (g - 1) (1/k) σ2 + σ2 (1/k) Cov
w(xy) + Covrg(xy)
Within plot N - rg σ2 Cov
w(xy)
1σ2 = Variance due to differences among plants within plots. σ2= Variance due to interaction of progenies and replications. σ2 = Variance due to differences among progenies σ2 (σ2 = aditive genetic variance). r = Number of replications. k = Harmonic mean of plants per plot. N = Total number of individuals in the trial. g = Number of progenies. 2Cov
w(xy) = covariance among trees within plots of x and y characters. Covrg(xy) = covariance due to interaction of progenies and replications of x and y characters. Covg(xy) = covariance due to progenies for characters x and y.
g rg w w rg w
w rg
ferences among plants within plots; n and r = number of progenies and number of replication.
Genetic gain from selection among progeny (Gg)
and within progeny (Gw) levels was also computed using
Vencovsky and Barriga’s (1992) formula:
Gg = ki (1/4) σ2 / σ2 + (σ2 /r) + (σ2 /rn)
Gw = k2 (3/4) σ2/ σ2
where k1and k2 are the intensity of selection. There was a
selection intensityof 17 and 20% among and within prog-enies, respectively.
The genetic gains expressed as a percent of the mean obtained from among and within half-sib progenies (Gg%) were estimated using the formula:
Gg% = Gg . 100 or Gw% = Gw. 100
where x is the general mean.
Genetic coefficients of variation were estimated by the formula suggested by Vencovsky (1987) by dividing the square root of genotypic variance by the population mean and multiplying by 100.
Correlation coefficients
To determine the degree of association between the anthracnose panel canker disease resistance, genotypic (rg(xy)) and phenotypic (rF(xy)) correlations were worked out
according to Kempthorne (1966) as follows:
rg(xy) = Covg(xy) / σ2 . σ2
rp(xy) = Covp(xy) / σ2 . σ2
where Covg(xy) and Covp(xy) = the genotypic and phenotypic
covariances for traits x and y, respectively; σ2 and σ
2 =
genotypic and phenotypic variances for trait x; σ2 and σ
2 =
genotypic and phenotypic variances for trait y.
The significance of these correlations was tested using the table in Fisher (1941), for simple correlations for 5 and 1% probability. The genotypic and phenotypic correlations were tested with the degrees of freedom of the error.
RESULTS AND DISCUSSION
Genetic variation
Highly significant differences (P < 0.01) were ob-served among open-pollinated progenies for all characters (Table II). This suggests that differences were attributable to genetic causes and that selection within the rubber tree population included in this test is possible.
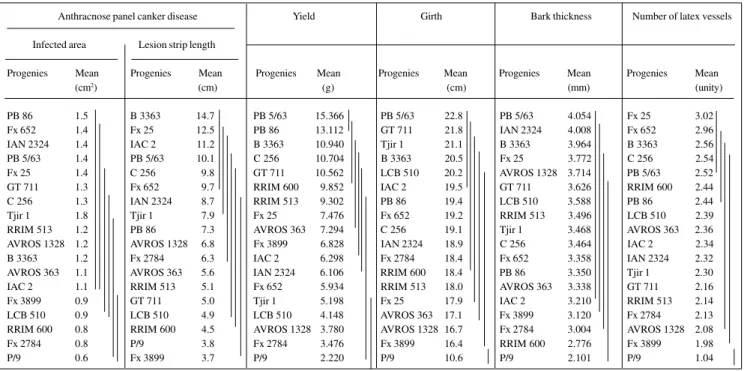
The progenies were ranked and distributed into homogeneous groups using Duncan’s test (Table III). The most infected progeny was PB 86, while the most resis-tant progeny was P/9. Considering lesion strip length, prog-eny B 3363 was the most susceptible and Fx 3899 was the most resistant. There was an increase in resistance of 260 and 380% depending on the type of evaluation. Anthra-cnose-infected area and lesion strip length were distrib-uted into six different groups. The last group encompassed the five most resistant progenies (Table III).
Yield averaged 10.03 g/tapping/plant. The lowest yielding progeny was P/9, while the highest yielding eny was PB 5/63, i.e., 692% more productive. The prog-enies were distributed into eight groups (Table III).
Girth taken at 50 cm from the ground averaged 24.87 cm. The slowest growing progeny P/9 averaged 10.56 cm, and the fastest growing progeny PB 5/63 aver-aged 22.78 cm, a 216% difference. Girth was distributed into five homogeneous groups (Table III). The first group contained the six best progenies.
Bark thickness averaged 3.655 mm. The progeny with the thickest bark was PB 5/63, with 4.054 mm, while
A w
A g e w
x x
Table II -Results of ANOVA (mean squares) for anthracnose panel canker disease resistance, yield, girth, bark thickness and number of latex vessel rings for open pollinated progenies of rubber tree (Hevea brasiliensis).
Source of Degrees of Anthracnose panel disease resistance Yield Girth Virgin bark Number of latex
variation freedom (g/plant/tapping) (cm) thickness (mm) vessel rings
Infected area Lesion strip length
(cm2) (cm)
Replications 4 0.2612 7.7959 140.5543 10.5581 0.1381 0.2889
Progenies 17 0.2812* 38.2147* 117.4913** 12.1492** 1.8841** 0.3495*
Progenies x
replications 68 0.1414 17.6057 19.2339 3.0816 0.2125 0.1816
Within plot 610 0.7598 54.1013 125.9011 11.1760 1.3259 0.8322
General mean 1.2920 8.6711 10.0266 24.8740 3.6547 2.5601
Coef. of variation % 29.11 48.39 43.74 7.06 12.6120 16.6475
* = P < 0.05; **P < 0.01.
gx
gy py
px gx gy
the thinnest bark was found in P/9, with 2.101 mm, i.e., 192% variation in bark thickness.
The progeny distribution among many homoge-neous groups suggests a polygenic mode of inheritance for all the characters. The results demonstrate that consid-erable genetic variation exists at the progeny level for the most economically important characters. This high genetic diversity could be used in an operational program or as the base for future breeding activities.
Variance components
Genetic component estimates of variance accounted for 3.37, 6.07, 12.74, 12.13, 19.82 and 3.58% of the phe-notypic variance for anthracnose-infected area, anthracnose
lesion strip length, yield, girth, virgin bark thickness and number of latex vessel rings, respectively (Table IV). It is evident that the estimates of progeny genetic variance for anthracnose-infected area were substantially smaller than those for anthracnose lesion strip length. In addition, the estimates of progeny genetic variance for the two anthra-cnose characters were substantially smaller than those for yield and growth characters with the exception of number of latex vessels.
Heritabilities
Heritability among progeny means (h2) for
anthra-cnose-infected area and anthracnose lesion stripe length was around 50% (Table V). These data agree with Tan Table III - Distribution of rubber tree (Hevea brasiliensis)progenies into homogeneous groups for several characters
according to Duncan’s test (P < 0.05).
Anthracnose panel canker disease Yield Girth Bark thickness Number of latex vessels
Infected area Lesion strip length
Progenies Mean Progenies Mean Progenies Mean Progenies Mean Progenies Mean Progenies Mean
(cm2) (cm) (g) (cm) (mm) (unity)
PB 86 1.5 B 3363 14.7 PB 5/63 15.366 PB 5/63 22.8 PB 5/63 4.054 Fx 25 3.02
Fx 652 1.4 Fx 25 12.5 PB 86 13.112 GT 711 21.8 IAN 2324 4.008 Fx 652 2.96
IAN 2324 1.4 IAC 2 11.2 B 3363 10.940 Tjir 1 21.1 B 3363 3.964 B 3363 2.56
PB 5/63 1.4 PB 5/63 10.1 C 256 10.704 B 3363 20.5 Fx 25 3.772 C 256 2.54
Fx 25 1.4 C 256 9.8 GT 711 10.562 LCB 510 20.2 AVROS 1328 3.714 PB 5/63 2.52 GT 711 1.3 Fx 652 9.7 RRIM 600 9.852 IAC 2 19.5 GT 711 3.626 RRIM 600 2.44
C 256 1.3 IAN 2324 8.7 RRIM 513 9.302 PB 86 19.4 LCB 510 3.588 PB 86 2.44
Tjir 1 1.8 Tjir 1 7.9 Fx 25 7.476 Fx 652 19.2 RRIM 513 3.496 LCB 510 2.39
RRIM 513 1.2 PB 86 7.3 AVROS 363 7.294 C 256 19.1 Tjir 1 3.468 AVROS 363 2.36 AVROS 1328 1.2 AVROS 1328 6.8 Fx 3899 6.828 IAN 2324 18.9 C 256 3.464 IAC 2 2.34 B 3363 1.2 Fx 2784 6.3 IAC 2 6.298 Fx 2784 18.4 Fx 652 3.358 IAN 2324 2.32 AVROS 363 1.1 AVROS 363 5.6 IAN 2324 6.106 RRIM 600 18.4 PB 86 3.350 Tjir 1 2.30 IAC 2 1.1 RRIM 513 5.1 Fx 652 5.934 RRIM 513 18.0 AVROS 363 3.338 GT 711 2.16
Fx 3899 0.9 GT 711 5.0 Tjir 1 5.198 Fx 25 17.9 IAC 2 3.210 RRIM 513 2.14
LCB 510 0.9 LCB 510 4.9 LCB 510 4.148 AVROS 363 17.1 Fx 3899 3.120 Fx 2784 2.13 RRIM 600 0.8 RRIM 600 4.5 AVROS 1328 3.780 AVROS 1328 16.7 Fx 2784 3.004 AVROS 1328 2.08 Fx 2784 0.8 P/9 3.8 Fx 2784 3.476 Fx 3899 16.4 RRIM 600 2.776 Fx 3899 1.98
P/9 0.6 Fx 3899 3.7 P/9 2.220 P/9 10.6 P/9 2.101 P/9 1.04
Table IV - Components of variance (σ2) for six characters of 18 open-pollinated progenies of rubber tree (Hevea brasiliensis).
Characters σ2 σ2 σ2 σ2 σ2
Anthracnose panel canker 0.7598 0.0370 0.0280 0.8315 0.1120 (infected area)
Anthracnose panel canker 54.1013 10.1730 4.1218 67.8511 16.4872 (lesion strip length)
Yield 125.9011 1.9369 19.615 154.2295 78.4600
Girth 11.1760 1.5461 1.8135 14.9510 7.2541
Virgin bark thickness 1.3259 0.0303 0.3343 1.6864 1.3373 Number of latex vessel rings 0.8322 0.0673 0.0336 0.9390 0.1344
σ2 = Variance due to differences among plants within plots. σ2 = Variance due to interaction of progenies and replications. σ2 = Variance due to differences among progenies σ2 (σ2 = additive genetic variance). σ2 = Phenotypic variance.
w e g p A
w e
g p
A A 1/4
and Tan’s (1996) results. They reported broad sense heri-tabilities of 28.9% up to 57.7% for anthracnose leaf ease, indicating that both panel and leaf anthracnose dis-ease had moderately high heritability estimates (Table V). It implies that there is a large genetic variability for an-thracnose resistance character in the population studied.
Heritabilities for other characters such as yield and virgin bark thickness were relatively high, i.e., 50.97 and 79.30% on an individual basis, 46.83 and 75.65% within progeny and 90.52 and 96.04% among progeny, respec-tively. These highly significant heritability estimates coupled with the large amount of variation observed within the rubber tree population suggest that an effort to increase both yield and girth growth through progeny selection would be rewarding.
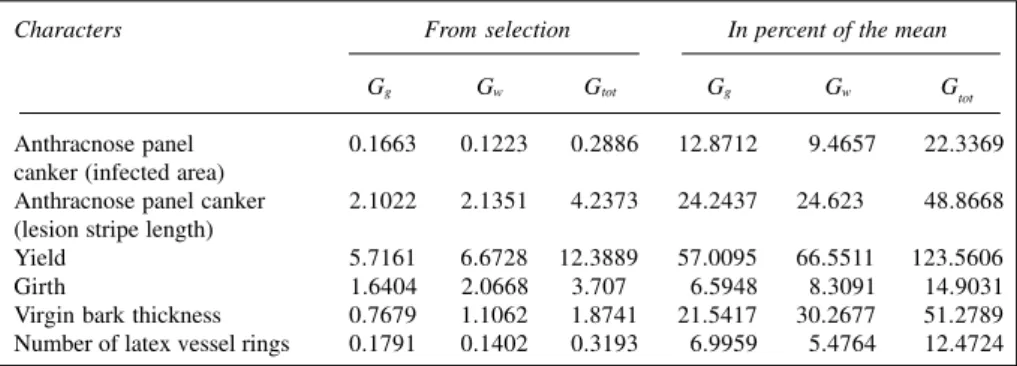
Expected genetic gains
Expected genetic gains are shown in Table VI. If the best five progenies were selected and planted on sites similar to that used in the experiment trial, a genetic gain among progenies in anthracnose-infected area and lesion strip length rate of about 12.87 and 24.24%, respectively,
could be achieved. When only the five best progenies (i.e., five progenies out of 18 progenies) were selected, for yield with a selection intensity of 0.17 the gain in yield at age three was 12.39 g, which is 57.35% greater than the over-all progeny means. Even smover-aller increases than these would result in appreciable improvement if the planting is large enough.
On the other hand, if the best two individuals were selected within progenies, asexually multiplied and planted at the same site, the genetic gains for anthracnose-infected area and lesion stripe length would be about 9.46 and 24.62%, respectively. For yield, girth and virgin bark thick-ness the gains would be 66.55, 8.31 and 30.27%, respec-tively. Considering combined selection among and within progenies the total genetic gains would be 22.34 and 48.87% for anthracnose-infected area and lesion stripe length, and 123.56% for yielding, respectively.
Gains in anthracnose panel canker disease appear to be possible in the rubber tree. Improvement, however, requires either that selection be done in a plantation which has been heavily exposed to the fungus or that progeny tests of selected trees be conducted in areas where the fun-gus is prevalent. The association of the two types of selec-tion would probably contribute to greater gains.
Correlations
Phenotypic correlations between anthracnose-in-fected area and other characters like yield and girth were generally significant (Table VII). Progenies with high yield and vigor often exhibited a high anthracnose sus-ceptibility.
The influence of anthracnose panel canker disease resistance on latex yield and vigor is not evident in the field. Data from observations that selected high yielding and/or vigorous genotypes have varying degrees of dis-ease resistance. An inverse genetic association between disease resistance and the important economic characters is not evident.
Table VI - Expected gains from selection and percentage of the mean among (Gg) and within (Gw) progenies selection and total (Gtot) for six different characters in 18 open-pollinated progenies of rubber
tree (Hevea brasiliensis).
Characters From selection In percent of the mean
Gg Gw Gtot Gg Gw Gtot
Anthracnose panel 0.1663 0.1223 0.2886 12.8712 9.4657 22.3369 canker (infected area)
Anthracnose panel canker 2.1022 2.1351 4.2373 24.2437 24.623 48.8668 (lesion stripe length)
Yield 5.7161 6.6728 12.3889 57.0095 66.5511 123.5606
Girth 1.6404 2.0668 3.707 6.5948 8.3091 14.9031
Virgin bark thickness 0.7679 1.1062 1.8741 21.5417 30.2677 51.2789 Number of latex vessel rings 0.1791 0.1402 0.3193 6.9959 5.4764 12.4724 Gtot=Total genetic gain (Gg + Gw).
Table V - Genotypic coefficient of variation (CV) and heritabilities on an individual basis (h2), within progeny plot (h2) and among progeny means (h2) for six different characters in 18 open-pollinated progenies of rubber
tree (Heveabrasiliensis).
Characters CV % Heritabilities
h2 h2 h2
Anthracnose panel canker 12.95 0.1345 0.1104 0.5382 (infected area)
Anthracnose panel canker 23.41 0.2430 0.2286 0.5838 (lesion strip length)
Yield 44.21 0.5097 0.4683 0.9052
Girth 5.41 0.4852 0.4868 0.8079
Virgin bark thickness 15.82 0.7930 0.7565 0.9604 Number of latex vessel rings 7.16 0.1430 0.1210 0.5198
g
i w
x
i w x
0 5 10 15 20 25 30 35 40
0.90 3.90 6.90 9.90 12.90 15.90 18.9 21.9
Anthracnose lesion strip length (cm)
Frequency (%)
0 5 10 15 20 25 30
0.18 0.48 0.78 1.08 1.38 1.68 1.98 2.28
Anthracnose infected area (cm2)
Frequency (%)
A
B
Figure 1 - Frequency distribution in the tested rubber tree population evalu-ated for anthracnose panel canker disease resistance for infected area and lesion strip length.
Table VII - Estimates of genotypic (rg) and phenotypic (rp) correlation coefficients, based on individual trees among anthracnose panel canker disease yield and growth characters of 18 open-pollinated progenies of rubber
tree (Heveabrasiliensis).
Characters Lesion stripe Yield Girth Virgin bark Total number of latex
length thickness vessel rings
Anthracnose panel canker rg 0.3233 0.2932 0.4218 0.4674* 0.2932 (infected area) rp 0.6028** 0.6546** 0.7603** 0.5521* 0.6667** Anthracnose panel canker rg - 0.1606 0.1552 0.3417 0.5916** (lesion stripe length) rp - 0.2306 0.3120 0.5467* 1.1582
Yield rg - 0.6661** 0.5286* 0.3697
rp - 0.7603** 0.5521* 0.5324*
Girth rg - 0.6397** 0.3680
rp - 0.7416** 0.7498**
Virgin bark rg - 0.4026
thickness rp - 0.6156**
* = P < 0.05; ** = P < 0.01.
There were fairly large phenotypic and genetic cor-relations among yield, total number of latex vessel rings, girth, and virgin bark thickness. Significant positive cor-relations among these characters imply genetic gain in all of these characters even if selection is undertaken on only one character.
Type of distribution
The frequency histograms for anthracnose-infected area (Figure 1A) and anthracnose lesion strip length (Fig-ure 1B) have a fairly normal distribution. These variation patterns indicate quantitative characters that are poly-genically controlled.
Basically, two broad categories of genetic varia-tions can be recognized, namely major gene and polygenic inheritance. While there are several ways to differentiate various forms of genetic mechanisms (Simmonds, 1982), one of the criteria is to monitor the distribution or varia-tion pattern of a specific character in a given populavaria-tion. A character which shows continuous variation is often re-ferred to as a likely candidate for polygenic inheritance. Similar observations concerned the degree of resistance to anthracnose leaf disease in the field, nursery or labora-tory. Wastie (1973) demonstrated a continuous form of variation, implying polygenic inheritance.
Breeding strategy
progenies along with the best individuals within those prog-enies. Consequently, this method will be adopted for im-proving anthracnose panel canker disease resistance, yield and girth. Since there is no significant genetic correlation among the three characters, indirect selection is not appli-cable in this instance. For this purpose “tandem selection” will be employed, e.g., the anthracnose panel canker dis-ease resistance will be improved first. When a desired re-sistance level has been obtained, breeding efforts will be concentrated on yield and growth characters. However, if the intention is to improve anthracnose panel canker dis-ease resistance and yield simultaneously, then an “inde-pendent culling” method would be recommended.
ACKNOWLEDGMENTS
We thank FAPESP for the financial support, and express our gratitude to Mrs. Lígia Regina Lima Gouvêa, from the Hevea
breeding program of the Instituto Agronômico (IAC), Mr. Arlindo Pinheiro da Silveira and Mrs. Adriana Novais Martins from the Instituto Biológico and Regina Gonçalves Ungaro for reading the manuscript. P.S.G., O.C.B. and A.A.O. are recipients of CNPq fellowships. A.M. and G.O.B. are recipients of FAPESP fellow-ships. Publication supported by FAPESP.
RESUMO
Estudos genéticos da relação da resistência da antracnose do painel, caracteres da produção e vigor da seringueira [Hevea brasiliensis (Willd. ex. Adr. de Juss.) Muell-Arg] foram condu-zidos em 18 progenies de meios-irmãos na Estação Experimental de Pindorama, Estado de São Paulo. Os resultados obtidos mos-traram diferenças genéticas significativas entre progenies para a maioria dos caracteres estudados. Os componentes genéticos da variância contribuíram com 3,37% da variância fenotípica para área infectada, 6,07% para comprimento de estrias, ambos causados pela anthracnose, 12,74% para produção, 12,13% para perímetro do caule, 19,82% para espessura de casca virgem e 3,58% para número total de vasos laticíferos. As herdabilidades no sentido restrito para os caracteres acima foram: 13,45%, 24,30%, 50,97%, 48,52%, 79,30% e 14,30%, respectivamente. Correlações signi-ficativas não foram encontradas entre antracnose do painel e caracteres da produção e perímetro do caule. A distribuição de freqüência de antracnose sugere que o caráter é poligênico. A seleção das três melhores progênies resultaria em um ganho genético para antracnose de 12,87% e 24,24% para área infectada e comprimento das estrias, respectivamente. A seleção dos cinco melhores indivíduos dentre os 50 indivíduos de cada progênie, para ambos os caracteres, resultaria em ganho genético de 9,47% e 24,62% com ganho total de 22,34% e 48,87%, respectivamente.
REFERENCES
Boock, M.V., Gonçalves, P. de S., Bortoletto, N. and Martins, A.L.M. (1995). Estimativas de parâmetrosgenéticos e ganhos esperados com a seleção de caracteres juvenis em progênies de seringueira. Pesqui. Agropecu. Bras. 25: 135-156.
Fisher, R.A. (1941).Statistical Methods for Research Workers. Oliver and Boyd, Edinburgh.
Gonçalves, P.de S., Martins, A.L.M., Bortoletto, N. and Carvalho, A.Z. (1995). Broad sense heritability values and possible genetic gains in clonal selections of Hevea. Rev. Bras. Genet. 18: 605-606. Gonçalves, P. de S., Martins, A.L.M., Bortoletto, N. and Tanzini, M.R.
(1996).Estimates of genetic parameters and correlation of juvenile characters based on open pollinated progenies of Hevea. Braz. J. Genet. 19: 105-111.
Kempthorne, O. (1966). An Introduction to Genetic Statistics. John Wiley & Sons, New York.
Lepsch, I.F. and Valadares, J.M.S. (1976). Levantamento pedológico detalhado da Estação Experimental de Pindorama, SP. Bragantia. 35: 13-40.
Moreti, D., Gonçalves, P. de S., Gorgulho, E.P., Martins, A.L.M. and Bortoletto, N. (1994). Estimativas de parâmetros genéticos e ganhos esperados com a seleção de caracteres juvenis em progênies de seringueira. Pesqui.Agropecu. Bras. 29: 1099-1109.
Resende, M.D.V. de and Oliveira, E.B. de (1997).Sistema “Selegen” – Seleção genética computadorizada para o melhoramento de espécies perenes. Pesqui. Agropecu. Bras. 32: 931-939.
Silveira, A.P. da, Furtado, E.L. and Lopes, M.E.B.M. (1992). Antracnose: nova doença do painel de sangria da seringueira. Summa Phytopathol. 18: 195-200.
Simmonds, N.W. (1982). Some ideas on botanical research on rubber. Trop. Agric. 59: 2-8.
Tan, H. and Subramaniam, S. (1976). A five diallel cross analysis for cer-tain characters of young Hevea seedlings. In: Proceeding of the In-ternational Rubber Conference 1975 (Rubber Research Institute of Malaysia, ed.). Vol. 2. RRIM, Kuala Lumpur, pp. 13-16.
Tan, H. and Tan, A.M. (1996). Genetic sudies of leaf disease resistance in
Hevea. J. Nat. Rubb. Res. 11: 108-114.
Trindade, D.R. and Furtado, E.L. (1997). Doenças da seringueira [Hevea brasilensis (Willd. ex Adr. de Juss.) Müell. Arg.]. In: Manual de Fitopatologia (Kimati, H., Amorin, L., Bergamin Filho, A., Camargo, L.E.A. and Rezende, J.A.M., eds.). 2nd Vol. Agronômica Ceres Ltda., São Paulo, 628-641.
Varghese, Y.A. (1992). Germoplasm resources and genetic improvement. In: Natural Rubber: Biology, Cultivation and Technology (Sethuraj, M.R. and Mathew, N.M., eds.). Elsevier Science Publishers, Amsterdam, pp. 88-115.
Vencovsky, R. (1987). Herança quantitativa. In: Melhoramento e Produção do Milho (Paterniani, E.C. and Viegas, G.P., eds). Fundação Cargill, Campinas, pp. 137-214.
Vencovsky, R. and Barriga, P. (1992). Genética Biométrica no Fitomelhoramento. Sociedade Brasileira de Genética, Ribeirão Preto, SP.
Wastie, R.L. (1973). Nursery screening of Hevea for resistance of
Gloeosporium leaf disease. J. Rubb. Res. Inst. Malaya, 23: 339-346.
Zobel, B. and Talbert, J. (1984). Applied Forest Tree Improvement. John Wiley & Sons, New York.