www.atmos-chem-phys.net/15/1725/2015/ doi:10.5194/acp-15-1725-2015
© Author(s) 2015. CC Attribution 3.0 License.
The role of aerosol in altering North Atlantic atmospheric
circulation in winter and its impact on air quality
F. S. R. Pausata1,2,*, M. Gaetani1,**, G. Messori2, S. Kloster3, and F. J. Dentener1
1European Commission, Joint Research Centre, Institute for Environment and Sustainability, Ispra (VA), Italy 2Department of Meteorology, Stockholm University and Bolin Centre for Climate Research, Stockholm, Sweden 3Land in the Earth System, Max Planck Institute for Meteorology, Hamburg, Germany
*now at: Department of Meteorology, Stockholm University and Bolin Centre for Climate Research, Stockholm, Sweden **now at: LATMOS-IPSL, Université Pierre et Marie Curie, Paris, France
Correspondence to:F. S. R. Pausata (francesco.pausata@misu.su.se)
Received: 1 July 2014 – Published in Atmos. Chem. Phys. Discuss.: 2 September 2014 Revised: 31 December 2014 – Accepted: 18 January 2015 – Published: 19 February 2015
Abstract. Numerical model scenarios of future climate de-pict a global increase in temperatures and changing precip-itation patterns, primarily driven by increasing greenhouse gas (GHG) concentrations. Aerosol particles also play an im-portant role by altering the Earth’s radiation budget and con-sequently surface temperature. Here, we use the general cir-culation aerosol model ECHAM5-HAM, coupled to a mixed layer ocean model, to investigate the impacts of future air pollution mitigation strategies in Europe on winter atmo-spheric circulation over the North Atlantic. We analyse the extreme case of a maximum feasible end-of-pipe reduction of aerosols in the near future (2030), in combination with in-creasing GHG concentrations. Our results show a more pos-itive North Atlantic Oscillation (NAO) mean state by 2030, together with a significant eastward shift of the southern cen-tre of action of sea-level pressure (SLP). Moreover, we show a significantly increased blocking frequency over the western Mediterranean.
By separating the impacts of aerosols and GHGs, our study suggests that future aerosol abatement may be the primary driver of both the eastward shift in the southern SLP centre of action and the increased blocking frequency over the west-ern Mediterranean. These concomitant modifications of the atmospheric circulation over the Euro-Atlantic sector lead to more stagnant weather conditions that favour air pollu-tant accumulation, especially in the western Mediterranean sector. Changes in atmospheric circulation should therefore be included in future air pollution mitigation assessments. The indicator-based evaluation of atmospheric circulation
changes presented in this work will allow an objective first-order assessment of the role of changes in wintertime circula-tion on future air quality in other climate model simulacircula-tions.
1 Introduction
variations. High aerosol concentrations can also have severe impacts on human health (Lim et al., 2012; WHO, 2013). Consequently, air-quality standards have been introduced in many polluted regions to regulate harmful aerosol concen-trations, and the upward trends in aerosol emissions in the most polluted regions are expected to stabilize or reverse. Hence, a realistic assessment of on-going and future climate change relies on our ability to predict trends in both GHG and aerosol emissions, the resulting concentrations and their combined effect on climate.
Most of the GHGs are long-lived and have a geograph-ically homogeneous climate forcing. On the other hand, aerosol concentrations are highly inhomogeneous, since they are locally controlled by a combination of primary or precur-sor emissions, chemical reactions as well as large-scale at-mospheric circulation, and their impacts can have short-term repercussions on climate (Shindell et al., 2012). Furthermore, atmospheric circulation changes themselves can feedback on air quality. Modelling and observational analyses suggest that a warming climate degrades air quality, with increasing surface O3and particulate matter abundance in many
popu-lated regions (Fiore et al., 2012). Kloster et al. (2009), for ex-ample, used a coupled chemistry–atmosphere general circu-lation model to show that climate change alone would worsen the air pollution by aerosols in many world regions.
Several other studies have demonstrated that local-to-regional scale pollutant concentrations can be influenced by large-scale atmospheric circulation patterns (Eckhardt et al., 2003; Christoudias et al., 2012; Barnes and Fiore, 2013; Pausata et al., 2012, 2013), such as the North Atlantic Oscil-lation (NAO). Pausata et al. (2013) have shown how positive shifts in the NAO in winter over the North Atlantic penalize cities lying in the Mediterranean area, making it necessary for these countries to enforce more stringent emission reduc-tion measures. This is of particular importance in view of a potential shift towards positive NAO regimes under future climate conditions.
The NAO commonly refers to swings in the atmospheric pressure difference between the subpolar and subtropical North Atlantic, and is the leading mode of winter atmo-spheric variability in the North Atlantic. The standard NAO index (NAOI) is defined as the difference in normalized mean sea-level pressure (SLP) between the Azores (or Portugal) and Iceland (Walker and Bliss, 1932), and determines cli-mate variability from the eastern seaboard of North America to Siberia and from the Arctic to the subtropical Atlantic. The NAO featured an upward trend of over 1 standard de-viation in the 1980s and 1990s compared to the 1951–1970 winter mean (data available in http://www.cgd.ucar.edu/staff/ jhurrell/naointro.html). Recent multi-model predictions con-firm previous findings reported in AR4 (e.g. Kuzmina, 2005; Stephenson et al., 2006), of a positive trend in future winter NAO (Gillett and Fyfe, 2013; Karpechko, 2010). However, there are substantial variations between NAO projections from different climate models. For example, Fischer-Bruns
et al. (2008) have employed an atmosphere–ocean coupled model (ECHAM4-OPYC3) and used the empirical orthog-onal function (EOF) analysis to investigate future trends in the NAO. The study found no detectable shift in the leading mode of atmospheric variability under global warming sce-narios. On the other hand, Müller and Roeckner (2008) found a strong positive trend in the NAO in the ECHAM5/MPI-OM simulations. As a consequence of such uncertainties, the IPCC AR5 has expressed only medium confidence in near-term projections of NAO changes (IPCC, 2013).
Recently, atmospheric variability in the North Atlantic and the NAO pattern have also been linked to Rossby wave-breaking in the upper troposphere and to atmospheric block-ing (e.g. Croci-Maspoli et al., 2007; Woollblock-ings et al., 2008). The termatmospheric blockingis broadly used to describe situations in which the prevailing westerly flow is blocked, or distorted by a persistent, quasi-stationary anticyclone (e.g. Rex, 1950; Berrisford et al., 2007). However, the ex-act definition varies among studies. For example, Pelly and Hoskins (2003) pioneered the use of potential vorticity (PV) as an indicator for blocking, linking blocking occurrences to the meridional potential temperature gradient on a con-stant PV surface. In this framework, atmospheric blocking is therefore associated with Rossby wave breaking. It has been shown that different blocking patterns correspond to signifi-cantly different large-scale atmospheric circulations over the North Atlantic Basin (Rex, 1950). Blocking situations are of-ten responsible for stagnant atmospheric conditions that lead to the accumulation of pollutants at ground levels. This in-creases the likelihood of exceeding particulate matter (PM) annual and daily limit concentrations, such as those imposed by European regulations (Directive 2008/50/EC).
the North Atlantic. Finally, we also examine (iv) how future changes in atmospheric circulation could impact air quality over Europe.
This work is structured as follows: Sect. 2 describes the model used, the simulation set-up and the statistical tools adopted; Sect. 3 presents the GHG and aerosol-induced changes in the magnitude and spatial pattern of the merid-ional SLP dipole in the North Atlantic. We also discuss the related changes in the NAO and atmospheric blocking over the Atlantic, and the effects of such changes on PM variabil-ity. Discussions and conclusions are presented in Sect. 4.
2 Methods 2.1 Climate model
We have analysed the climate simulations performed by Kloster et al. (2008, 2009) using the ECHAM5-HAM aerosol–climate model. We focus on the analysis of hith-erto unexplored aspects of atmospheric circulation changes over the North Atlantic. These simulations were also used by Sillmann et al. (2013) to analyse how future changes on aerosol concentrations impact on precipitation; however, they focused on annual means and did not consider to what extent these changes were reflected by large-scale circulation changes that were driving the more localized precipitation re-sponses.
The ECHAM5-HAM modelling system includes the at-mospheric general circulation model ECHAM5 (Roeckner et al., 2003) coupled to a mixed layer ocean (Roeckner et al., 1995), and the microphysical aerosol model HAM (Stier et al., 2005). The ECHAM5-HAM simulations analysed in this study (Kloster et al., 2008, 2009) account for both the direct and indirect (cloud lifetime and cloud albedo effect) aerosol effects. ECHAM5 was run on a T63 horizontal grid (about 1.8◦on a Gaussian grid), and on 31 vertical levels from the surface up to 10 hPa. A cloud scheme with a prognostic treat-ment of cloud droplet and ice crystal number concentration (Lohmann et al., 2007) provided fractional cloud cover pre-diction from relative humidity (Sundquist et al., 1989). The shortwave radiation scheme included six bands in the visible and ultraviolet spectra (Cagnazzo et al., 2007).
The microphysical aerosol module HAM treats the aerosol size distribution, mixing state and composition as prognostic variables. It predicts the evolution of an ensemble of interact-ing aerosol modes and is composed of the microphysical core M7 (Vignati et al., 2004); an emission module for SO2, black
and organic carbon, and mineral dust particles; a sulphur oxi-dation chemistry scheme using prescribed oxidant concentra-tions for OH, NO2, O3and H2O2(Feichter et al., 1996); a
de-position module; and a module defining the aerosol radiative properties. Prescribing oxidant concentrations, most impor-tantly H2O2, may have led to an underestimate in the
result-ing sulfate burden, since the use of off-line H2O2 may not
accurately account for depletion by aqueous reactions with SO2and recovery in cloud-free conditions. This will increase
the gas-phase production of SO4which is less susceptible to
scavenging, and increase the SO4burden (Barth et al., 2000;
Roelofs et al., 1998). Another model evaluation of the ef-fect of including explicit oxidation (Pham, 2005) suggested an overall decline of SO4burden (< 1 %), but an increase of
SO4 surface concentrations (ca. 5 % in many regions), due
to a combination of increased near-surface oxidation and re-moval processes. This is a relatively minor error compared to other uncertainties (Textor et al., 2007). The aerosol opti-cal properties were explicitly simulated using Mie theory and provided as input for the radiation scheme in ECHAM5 fol-lowing Toon and Ackerman (1981). Climate-sensitive natural emissions (dimethyl sulphide, sea salt and dust) were simu-lated interactively.
2.2 Simulation set-up
The GHG concentrations used in the simulations were de-rived from the IMAGE 2.2 implementation of the SRES B2 scenario (IMAGE-team, 2001). The SRES B2 storyline de-scribes a world with intermediate population and economic growth, in which the emphasis is on local solutions to eco-nomic, social and environmental sustainability.
The anthropogenic emissions of carbonaceous aerosols, namely black carbon (BC) and organic carbon (OC), as well as sulphur dioxide (SO2), the main precursor of sulphate
– 2000 experiment: year 2000 GHG concentrations and aerosol emissions;
– 2030 experiment: year 2030 GHG concentrations and MFR aerosol emission scenario;
– 2030GHG experiment: year 2030 GHG concentrations, and 2000 aerosol emissions;
– 2030AER experiment: year 2000 GHG concentrations, and 2030 MFR aerosol emission scenario.
All simulations used a spin-up of 30 years, not included in the analysis.
The 2030GHG and 2030AER experiments in which, spectively, aerosol emissions and GHG concentrations re-mained at the 2000 level, were performed to separate the effects of GHG concentrations and aerosols emissions. The experimental setups are summarized in Table 1.
2.3 Statistical analysis methods
We evaluate three aspects of the large-scale circulation: (1) the SLP spatial structure (shift of centres of action); (2) the leading mode of atmospheric variability (NAO); and (3) the blocking frequency. Finally, we investigate how the atmo-spheric circulation changes affect PM distributions.
To investigate the impact of aerosol and GHG concentra-tion changes on SLP spatial structure, we define the SLP cen-tres of action for the winter season (December, January and February, DJF) by creating SLP coherence maps (Pausata et al. 2009). The coherence index value (0≤CI≤1) at each grid-point is the absolute value of the area-averaged corre-lation between the monthly SLP time series at that point and over the rest of the North Atlantic Basin (20–85◦N; 90◦W–40◦E). Higher values indicate that the SLP variabil-ity at that location is morecoherentwith variability through-out the North Atlantic, either in-phase or anti-phase. The Northern and Southern SLP Centres Of Action (NCOA and SCOA) are identified as CI maxima over the North (north of 55◦N) and subtropical Atlantic (south of 55◦N), respec-tively. This method allows determining the spatial distribu-tion and shifts of the COAs due to aerosol and GHG con-centration changes, both in combination and separately (for details see Appendix A). In order to verify that the computed geographical shifts in the centres of action are outside the normal range of inter-annual variability, we use a statisti-cal bootstrap approach to produce a set of 100 CI maps for the 2000 experiment. We randomly select subsamples of 20 years for the 30-year-long simulations and subsamples of 40 years for the 2000 (60-year-long) simulation, and perform the CI analysis for each subsample. Subsequently, we apply the Student’st test to determine whether the CI pattern and the shift in the centres of action between the 2000 control simulation and the sensitivity studies are significant at 95 % confidence level.
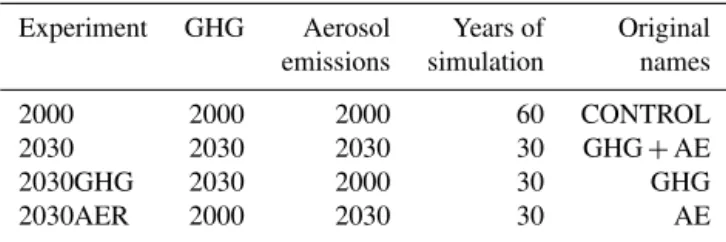
Table 1.ECHAM5-HAM experiment design and number of years simulated for each experiment. The original denomination used by Kloster et al. (2009) is shown in the last column.
Experiment GHG Aerosol Years of Original emissions simulation names
2000 2000 2000 60 CONTROL
2030 2030 2030 30 GHG+AE
2030GHG 2030 2000 30 GHG
2030AER 2000 2030 30 AE
Furthermore, in order to assess the variability of the SCOA and evaluate its relation to blocking frequency and precipita-tion in the 2000 simulaprecipita-tions, we construct an index of the SCOA (SCOAI). We first generate 10 000 random subsam-ples of 15 years from the 60-year pool of the 2000 simulation. In this case we have reduced the subsample size from 40 to 15 years in order to increase the variability of the SCOA and hence, better understand its influence on blocking frequency and precipitation. We then calculate the CI values and deter-mine the position of the SCOA (maximum in the CI south of 55◦N) for each subsample. Hence, we construct the SCOAI where the value of 0 is defined as the 50th percentile of the SCOA position within the 10 000 subsamples. Eastward po-sitions (relative to the 50th percentile) of the SCOA are de-fined as positive values of the SCOAI and westward position as negative ones. The SCAOI is then normalized by the stan-dard deviations of the eastward and westward SCOA posi-tions.
Winter changes in the leading mode of atmospheric vari-ability are investigated by using the monthly NAO Index (NAOI), defined as the difference in the normalized SLP anomalies between Ponta Delgada, Azores, and Stykkishól-mur/Reykjavik, Iceland. The NAOI allows one to look for shifts in the North Atlantic atmospheric circulation associ-ated with future climate change (Hurrell, 1995).
The analysis of blocking frequency over the North Atlantic Basin is performed as follows. In order to define atmospheric blocking, the present paper utilizes a bi-dimensional index that identifies reversals in the meridional gradient of 500 hPa geopotential height (Davini and Cagnazzo, 2013; Davini et al., 2012; Tibaldi and Molteni, 1990). For every model grid-box with coordinates (latitude = ϕ, longitude = λ), the fol-lowing two quantities are defined:
1N(ϕλ)=
Z500(ϕ, λ)−Z500(ϕ−15◦, λ)
15◦ , (1)
1S(ϕλ)=
Z500(ϕ+15◦, λ)−Z500(ϕ, λ)
15◦ , (2)
over the domain where:
30◦N< ϕ <72.5◦N,180◦W< λ
In order for a gridbox to be flagged as “blocked”, the fol-lowing must hold:
1N>0;1S<−10 m/(◦latitude).
In order to define a blocking event, a number of additional constraints are also enforced. Firstly, a cluster of adjacent blocked gridboxes spanning at least 15◦ longitude must be identified at a given time step. Therefore, if a gridbox is blocked in isolation, it is not considered to be part of a block-ing event. A persistence criterion is also applied: a blockblock-ing event requires that at least one other blocked gridbox is de-tected for 5 consecutive days within an area of 5◦latitude by 10◦longitude, centred on the original blocked gridbox.
The impacts of changes in atmospheric circulation on air pollution are investigated by analysing changes in PM monthly anomaly distributions. We focus on changes in the skewness of distributions for the winter season. The skew-ness is the distribution’s third standardized moment, and is a measure of the asymmetry of the distribution. Positive skew-ness values typically indicate that the right side tail of the dis-tribution becomes longer than the left side, and vice versa for negative values. Significance in the skewness differences is assessed by using a Kolmogorov–Smirnov test at 95 % con-fidence level. This test is a non-parametric tool, meaning that it makes no assumptions on the shape of the data distribu-tion. An “artificial” variability is introduced in the skewness values in each simulation through a bootstrap technique. For each experiment, we calculate the skewness values of 100 random distributions, generated from the original pool of 30 or 60 years using the same bootstrap technique described for the CI. The significance level is then identified based on this sample.
3 Results
The results presented here describe the effects of GHG and aerosol concentrations on the mean state and variability of the North Atlantic atmospheric circulation. The results are presented in three sections. In the first section, changes in the spatial structure of the SLP and its variability are in-vestigated. In the second section, we extend the analysis to changes in the blocking frequency. Finally, in the third sec-tion, we quantify the impacts of such changes on precipita-tion regime and PM variability.
3.1 Changes in SLP centres of action and their variability
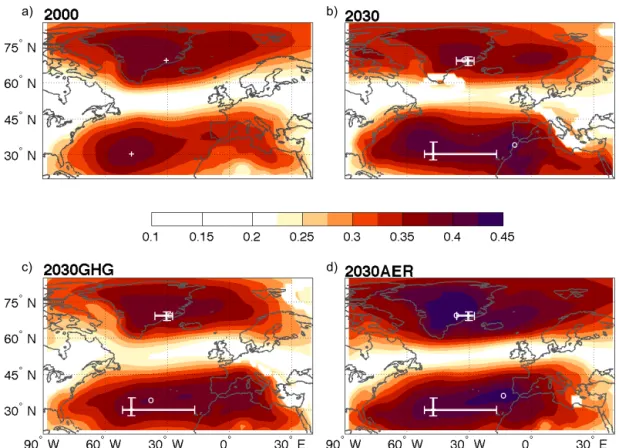
The 2030 and 2030AER simulations show a north-eastward shift of the SCOA compared to the 2000 control simulation (Fig. 1). The area of highest SLP coherence in the 2000 simu-lation is located in the central-western part of the sub-tropical North Atlantic, whereas in the 2030 simulation it is shifted off the coast of northern Morocco. The NCOA, instead,
re-mains located in central-western Greenland for all scenar-ios. However, in the 2030 and 2030AER simulations, a sec-ondary CI maximum develops in the Norwegian Sea, and the areas with the CI maxima are broader. Secondary CI maxima also develop at low latitudes compared to the 2000 simula-tion (Fig. 1).
Both sensitivity simulations (2030GHG and 2030AER) show a significant north-eastward shift (see Sect. 2.3) of the SCOA as well as broader areas of CI maxima compared to the 2000 simulation. Both these features are more pro-nounced in the 2030AER than in the 2030GHG simulation, in particular the displacement towards the Mediterranean Sea of the SCOA.
With regard to the SLP variability, the 2030 simulation shows a significant positive shift of the NAO mean state by 0.46 compared to the 2000 control period (Fig. 2). The prob-ability of having an NAOI greater than+1 increases from 30 to 40 % (Fig. 2). Neither the GHG increase (2030GHG) nor the aerosol reduction (2030AER) have any statistically significant role in changing the NAO mean state and the frequency distribution of strongly positive/negative NAO phases relative to the control simulation. Nevertheless, the GHG increase is more likely to contribute to the NAO shift compared to aerosol alone: in the 2030AER simulation the null hypothesis that aerosols do not affect the NAO can be excluded with a likelihood of 65 %, while in the 2030GHG simulation the same likelihood is 85 % (using at test). Only the combination of both 2030 GHGs and aerosol emissions leads to a statistically significant change in the NAO mean state at 95 % confidence level.
Hence, whereas the NAO shift is related to both aerosol and GHG changes (with likely stronger impacts from the GHGs), the aerosol reduction alone plays the largest role in shifting the southern centre of action of SLP towards the Mediterranean.
3.2 Changes in blocking frequency
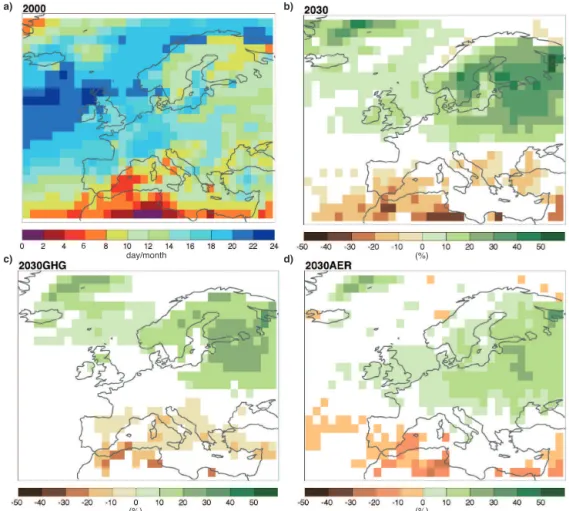
Blocking events can have a large impact on weather patterns and sometimes lead to the occurrence of extreme events (e.g. Yiou and Nogaj, 2004); hence, it is important to quantify the variability and possible changes in the preferred location of blocking occurrences.
resem-blance to the observed climatology (cf. Fig. 3a with Fig. 1 in Davini et al., 2012).
HLBs and LLBs are strongly tied to the phase of the NAO: Woollings et al. (2008) showed that HLB events over Greenland are strongly anti-correlated with the NAOI. Fur-thermore, changes in the HLB position (Wang and Magnus-dottir, 2012) and frequency (Davini et al., 2013) have been shown to influence not only the NAOI, but also its pattern. Yao and Luo (2014) have described the relationship between HLBs and LLBs and the NAO phase in winter during the period 1950–2011. The HLBs are connected not only to the NAO phase but also to the position of the SCOA. By regress-ing the NAOI and the SCOAI time series onto the block-ing frequency field in the 2000 simulation (see details in Appendix B), we analyse how the NAO phase and the po-sition of the SCOA affect the blocking frequency. Positive NAO phases are associated to a northward increase of LLBs (Fig. 4a), whereas eastward positions of the SCOA are con-nected to a north-eastward increase of LLBs (Fig. 4b). The regression analysis also shows a decreased HLB frequency over Greenland during positive NAO phases in agreement with the above-mentioned studies.
The 2030 simulation shows a significant increase (up to 50–70 %) in the number of LLB events over western Europe and the Mediterranean Basin, corresponding to a more in-vasive subtropical anticyclone (high-pressure system) over southern and central Europe in winter. The increased LLB frequency in the 2030 simulation is consistent with both a positive NAO shift (Fig. 4a) and an eastward shift of the SCOA (Fig. 4b). On the other hand, HLBs decrease (Fig. 3b) is in agreement with the reduction in negative NAO phases discussed in Sect. 3.1 and the NAOI-blocking frequency re-lationship highlighted in Fig. 4a.
The 2030GHG and 2030AER simulations also show sig-nificant increases in the LLB frequency over the mid-latitude North Atlantic and decreases in the HLB frequency (Fig. 3c, d). However, the patterns are different from one another: the high-latitude change in both 2030GHG and 2030 closely ap-proximates the blocking frequency difference between the positive and negative phases of the NAO, shown in Fig. 4a (cf. with Fig. 3b, c). On the other hand, the HLB frequency change in the 2030AER experiment seems to be related to a shift in the SCOA (cf. Figs. 3d and 4b). This is consistent with the large (small) eastward displacement of the SCOA in the 2030AER (2030GHG) simulation and the smaller (larger) shift in the NAO mean state.
The 2030AER simulation also shows a significant increase in LLB frequency over the Mediterranean, not seen in the 2030GHG experiment. Hence, the aerosol concentration re-duction seems to be the main driver of the increase in LLB events over the Mediterranean seen in the 2030 simulation (Fig. 3 cf. panels b and d). These results strengthen the role of aerosols in affecting atmospheric dynamics in the North Atlantic, suggesting that they drive both (a) an eastward shift of the southern centre of action of SLP and (b) an increased
tendency of the sub-tropical anticyclone to expand towards the Mediterranean Sea.
3.3 Impacts on air quality
Large-scale changes in atmospheric circulation can affect PM variability over Europe by altering the precipitation regime. The latter is one of the main mechanisms for PM removal, and affects PM concentrations at the surface (e.g. Horton et al., 2014; Jacob and Winner, 2009; Pausata et al., 2013). For example, an eastward shift of the SCOA and/or a shift towards positive NAOI, together with an increased fre-quency of blocking events in the Mediterranean, may lead to a higher frequency of dry, stagnant weather conditions in south-western Europe, thus worsening air quality (see Ap-pendix C for a discussion on the relationship between circu-lation changes and precipitation). Hence, even though there will be an overall improvement in air-quality conditions as-sociated with an abatement of PM emissions, additional PM emission reduction measures may be necessary for those countries and cities lying in the Mediterranean area, to coun-terbalance the effects of the atmospheric circulation changes. This hypothesis has already been suggested by Pausata et al. (2013) on the basis of an NAO-PM analysis using the same model driven by ERA-40 re-analysis data. In this work, we test it further by analysing climate sensitivity experiments under different aerosol emission scenarios for the near fu-ture. We aim to provide a general coherent overview of the impacts of large-scale circulation changes on air quality. We focus on monthly PM data, similar to the monthly SLP field used for the NAOI and CI analyses. We do not discuss the daily exceedances of EU thresholds, since this would be be-yond the scope of the present study, and the coarse resolution global model has limited skills for simulating them (Pausata et al., 2013).
To quantify how the changes in atmospheric circulation affect air quality, we calculate the relative anomaly distribu-tions of PM concentradistribu-tions for four regions (see also Fig. 3a), to encompass the different areas of influence of the NAO over Europe:
– Western Mediterranean (WM): 34–43◦N/0–10◦W; – Eastern Mediterranean (EM): 34–43◦N/10–40◦E; – Central Europe (CE): 44–53◦N/0–15◦E;
– Eastern Europe (EE): 46–60◦N/20–40◦E.
In the PM we have considered only the aerosol components included in ECHAM5-HAM that have a predominantly an-thropogenic signature – namely black and organic carbon, and sulphates – disregarding aerosols of natural origin (e.g. sea-salt, mineral dust). Thus, the PM in this paper represents mostly PM2.5, and is likely a lower bound on the “real” PM
a)
d) c)
b)
Figure 1.Sea-level pressure coherence index maps of the North Atlantic sector for the 2000(a)and 2030(b)simulations and the two sensitivity studies (c,d) in winter (DJF). The SLP centres of action (COAs) for the control run and for the 2030 simulations are shown by white crosses and white circles, respectively. The bars delimit the range between the 10th and 90th percentile of the CI maxima in the 2000 simulations. Only areas in which the difference between the 2000 control pattern and the sensitivity simulation is significant at the 95 % confidence level and CI values are greater than 0.225 are shaded. The choice of shading only CI values greater than 0.225 is arbitrary.
modelled and measured PM2.5/PM10 see the
Supplemen-tary Material in Pausata et al., 2013).
First, we analyse the skewnesses of the monthly PM rela-tive anomaly distributions for the winter season. PM relarela-tive anomaly distributions for all experiments and for all four re-gions show positive skewness values, meaning that positive PM anomalies are becoming more likely than negative ones (Fig. 5 and Table 2). Our results show that, in all three 2030 experiments, the simulated PM distributions change signif-icantly in all regions considered due to the altered atmo-spheric circulation (Fig. 5 and Table 2).
In the Western Mediterranean (WM), the PM relative anomaly skewness increases remarkably from 0.26 in the 2000 case to 1.02 and 1.05 in the 2030 and 2030AER simu-lations, respectively. This change is mainly led by the aerosol reduction, whereas the GHGs only drive a small contribution (Table 2). The large change in skewness in the 2030 simu-lation is accompanied by a corresponding shift in the upper and lower percentiles of the distribution. The 5th and 95th percentiles rise by 8 and 4 % respectively relative to 2000, indicating a transition towards more positive PM anomalies (Table 3). The rise in PM extremes matches the changes in rainy day extreme percentiles (not shown). The 95th and 5th
Table 2.Skewness values for the PM distributions of the four se-lected regions for each experiment. For each region and experi-ment, changes relative to all the other experiments are significant at the 95 % confidence level, except for 2030-2030AER in Western Mediterranean.
Western Eastern Central Eastern Mediterranean Mediterranean Europe Europe
2000 0.26 0.83 1.44 1.70 2030 1.02 0.95 0.66 1.18 2030GHG 0.48 1.26 1.18 1.08 2030AER 1.05 1.17 0.94 1.03
percentiles of the frequency of rainy days decrease by 2 and 17 % respectively. Rainy day frequencies and PM anoma-lies are anti-correlated; therefore, a change in the 95th (5th) percentile in rainy days should be associated with a change of the opposite sign in the 5th (95th) percentile in the PM anomalies.
lo-Figure 2.Frequency distributions of the winter (DJF) NAOI for the 2000 control simulation (blue, all panels), 2030 (red, upper panel), 2030GHG (red, central panel) and 2030AER (red, lower panel). Numbers show the NAOI mean value, the standard deviation (SD) and the probability of having a NAOI greater than+1 (p(NAOI) >+1) or smaller than−1 (p(NAOI) <−1). Values of the simulations having a NAOI mean significantly different from 2000 control mean at 95 % confidence level are shown in bold. The 2000s mean NAO is by definition equal to 0 and the number of occurrences has been normalized to 30 years for a direct comparison with the other simulations.
Table 3.PM relative anomalies (unitless) associated to different percentiles for the WM and CE regions in the 2000 experiment (first and third rows) and their relative changes (in %) for the 2030 simulation compared to 2000 values (second and fourth rows).
Region Experiment Percentile
5th 25th 50th 75th 95th
Western Mediterranean 2000 0.49 0.73 1.01 1.25 1.57
2030 +8 % +1 % −9 % −7 % +4 %
Central Europe 2000 0.65 0.80 0.94 1.13 1.48
2030 −14 % −3 % +2 % +2 % +7 %
cated off the coast of the Iberian Peninsula in the 2030 sim-ulation – and the contrasting effect of the NAO phase inside the domain: as one moves further to the east in the Mediter-ranean Basin, the correlation between NAO and precipitation changes sign (Fig. B1a). The smaller changes in the PM dis-tribution simulated in the EM compared to the WM could therefore be related to a different behaviour in precipitation regime (see Appendix B).
WM CE
EM EE
Figure 3.Blocking frequency (in % of days in which a blocking event occurs at a given gridbox) over the Atlantic sector for the 2000 simulation(a); changes in blocking frequency compared to the 2000 simulation for 2030(b), 2030GHG(c)and 2030AER(d)simulations in winter (DJF). Only areas in which the difference between the 2000 control and the sensitivity simulation is significant at 95 % confidence level are shaded (in white non-significant areas). In panel(a)we have highlighted the regions discussed in Sect. 3.3 and Table 2.
a) b)
Figure 4.Blocking frequency anomalies (in % of days in which a blocking event occurs at a given gridbox) per unit of NAO index (NAOI,
a) and SCOA index (SCOAI,b) standard deviation. The anomalies are calculated using a one-point regression analysis (see Appendix B). Only differences significant at 95 % confidence level are shown (based on the correlation significance between NAOI/SCOAI and blocking frequency). Note that the two panels use different colour scales.
simulation compared to the 2000 experiment (Table 3). The change in the extreme PM percentiles is accompanied by a similar but opposite change in the rainy day percentiles:+3 and−9 % for the 95th and 5th percentiles, respectively. CE is located closer to the transition area of the NAO influence between northern Europe and Mediterranean Basin (see also Fig. B1). Therefore, this area may be exposed to alternation of a more invasive Azores high and rainy Atlantic storms.
Therefore, the regions that will be most affected by fu-ture large-scale circulation changes are the Western
Figure 5.Probability density estimates (PDEs) of PM relative anomalies for each region (Western(a)and Eastern Mediterranean(c), Central
(b)and Eastern Europe(d)) and for each experiment. Relative anomalies are computed as the ratio between winter (DJF) monthly time series and the winter (DJF) climatology of each experiment and region. The probability density estimates are based on a normal kernel function, which provides non-parametric PDEs for random variables (Rosenblatt, 1956). The probability for a given relative anomaly to occur is obtained by integrating the PDE in dx.
4 Discussion and conclusions
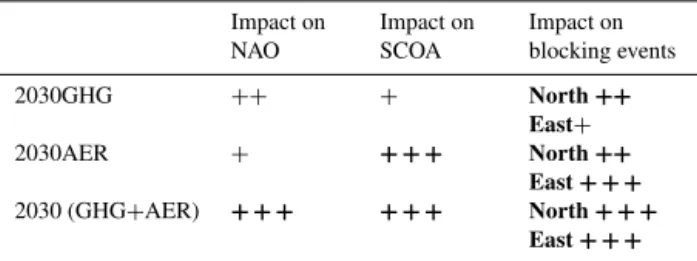
The present study analyses future scenarios of atmospheric circulation over the North Atlantic and possible impacts on air quality over Europe. The chemistry–atmosphere ECHAM5-HAM model, coupled to a mixed layer ocean, shows a change towards more positive NAO phases, together with an eastward shift of the southern SLP centre of action. These shifts are associated with an increased frequency of blocking events over the western Mediterranean. Our results highlight how the decreased aerosol and aerosol precursor emissions, along with GHGs, are responsible for changes in radiative forcing that feedback onto the atmospheric circula-tion and alter the NAO mean state. Table 4 provides a quali-tative summary of the atmospheric changes induced by 2030 GHGs, aerosols and jointly by GHG and aerosol emissions on a variety of circulation indicators. These changes in at-mospheric circulation in turn feedback significantly on air quality, and would lead to an increase in the magnitude of
ex-treme pollution events over the western Mediterranean if no changes in aerosol emissions were observed. In the MFR sce-nario analysed in our study, however, the reduction in aerosol emissions would outstand the increase in PM extreme values leading to an overall improvement of air quality.
Table 4.Qualitative contributions (small (+), medium (++), high (+ + +))of 2030GHG and 2030AER to changes in the NAO phase, SCOA location and blocking event frequency. For the blocking events, the direction of the increased frequency is also shown. The contributions significant at 95 % confidence level are shown in bold.
Impact on NAO Impact on SCOA Impact on blocking events
2030GHG ++ + North++
East+
2030AER + + + + North++
East+ + + 2030 (GHG+AER) + + + + + + North+ + +
East+ + +
The positive NAO shift comes along with a shift of the SLP centres of action. Hilmer and Jung (2000) have found an east-ward shift in the SLP pattern associated with the inter-annual variability of the NAO from 1958–1977 to 1978–1997. Pe-terson et al. (2003) have suggested that this shift is simply a consequence of the trend towards a more positive NAO index in the last two decades of the 20th century. Hu and Wu (2004), using both data and a coupled general circulation model, have also shown that a shift of both SLP centres of action took place in the second half of the last century, which will likely continue in the future. Our study confirms that this shift also occurs under a global warming scenario. How-ever, while in our simulations the southern centre undergoes a remarkable eastward shift, the northern one is fairly stable around southern Greenland – as demonstrated using the co-herence index approach (Fig. 1). Nevertheless, the CI maps do show that in the 2030 simulations a secondary northern maximum – not present in the 2000 experiment – appears in the Norwegian Sea (Fig. 1). Furthermore, our simulations highlight how the future abatement of the aerosol load may play an important role in the eastward shift of the SLP cen-tres of action.
The present study also finds an increased blocking fre-quency over the western Mediterranean. Such an increase, together with an eastward displacement of the southern SLP centre of action and a positive shift of the NAO mean state, leads to more frequent stagnant weather conditions that favour pollutant accumulation in the Mediterranean. This change in frequency of pollution events has also been de-scribed by Kloster et al. (2009), who showed that aerosol abundance is dependent on the climate state, as also high-lighted in a number of other modelling studies (e.g. Fe-ichter et al., 2004; and overview in IPCC, 2013). Kloster et al. (2009) further found that aerosol burdens increase in the area due to less precipitation and reduced wet deposition. Hence, they suggest that climate change alone would worsen air pollution by aerosols. Here we show that in Europe these findings are consistent with a straightforward NAO-behaviour analysis. A positive shift in future NAO would indeed lead to more intense extreme pollution events over
specific areas, such as the western Mediterranean countries, assuming constant present-day aerosol emissions. This result also supports the hypothesis of Pausata et al. (2013) that – for aerosol emissions fixed at present day values – climate change would lead to more extreme pollution events over the western Mediterranean, forcing southern European countries to implement more stringent abatement measures to counter-act adverse changes in PM variability. However, our study also highlights that the increase in the number of high PM episodes in the western Mediterranean is partially counter-balanced by a lower median and a narrowing of the PM fre-quency distribution around the median itself (Fig. 5 and Ta-ble 3).
Current European legislation considers PM air-quality thresholds of 25 µg m−3 (annual average) for PM
2.5, and
50 µg m−3 for PM
10 (daily average, not to be exceeded for
more than 35 days per year). European legislation has also set an indicative target value of 20 µg m−3for the PM
2.5
an-nual average. Currently, between 20–31 % and 22–33 % of the urban population in Europe is exposed to PM2.5
lev-els above the 20 µg m−3 threshold (EEA, 2013). However,
more stringent standards are currently in place in the USA (annual PM2.5: 12 µg m−3), and are recommended by the
World Health Organization – WHO (annual PM2.5/PM10:
10/20 µg m−3), and may be adopted in Europe as well at
some point in the future. Considering the more stringent WHO guidelines, currently between 91–96 % (PM2.5) and
85–88 % (PM10)of the urban population is exposed to
val-ues above the thresholds (http://ec.europa.eu/environment/ air/quality/standards.htm). Depending on threshold levels set by future EU air-quality legislation, it is not a priori clear how changes in PM frequency distributions will affect exceedance of these thresholds, and what levels of emission reductions are appropriate to reach these air-quality objectives.
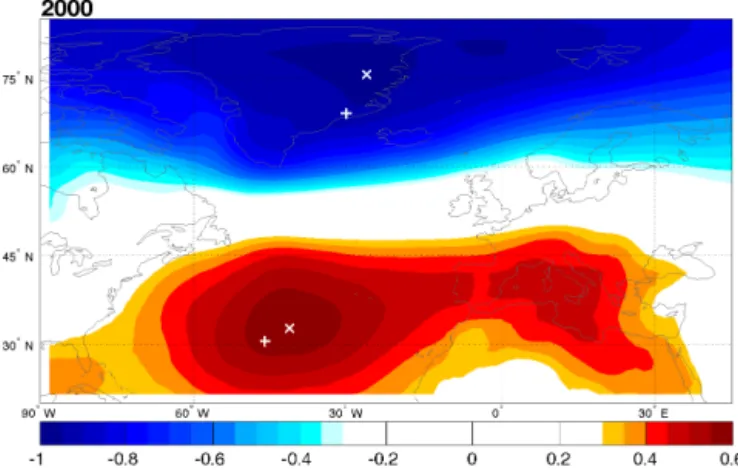
Appendix A
In Appendix A, we explain in detail the relationship between the coherence index (CI) analysis and the NAO. The CI anal-ysis of the SLP field identifies the areas that best correlate with the SLP variability over a given basin. In other words, the maxima in the CI represent the points that best capture SLP variability within a given domain. On the other hand, the NAOI is a measure of the wintertime SLP swings be-tween two specific points in the North Atlantic, located in the “eye” of the two stable pressure areas, the Azores high and Icelandic low. Therefore, these two locations capture a substantial amount of SLP variability in the basin. Pausata et al. (2009) have already shown that the CI and the NAOI are connected to each other in the present climate. The CI pat-terns of surface temperature (precipitation) closely resemble the correlation patterns between surface temperature (precip-itation) and the leading Principal Component (PC1) of the SLP field (which is an alternative definition of the NAOI; see Figs. 7 and 8 in Pausata et al., 2009). To further demonstrate the link between the CI and NAOI, we have calculated the correlation between SLP and the leading PC of the SLP field, following Pausata et al. (2009). For simplicity, in this paper we have used the canonical definition of the NAOI, since the PC1 and NAOI in winter are highly correlated (r> 0.90, see also Hurrell, 1995). Figure A1 shows that the correlation be-tween the PC1 and SLP is very similar to the CI pattern and the correlation maxima of both analyses are quite close to each other (cf. Figs. A1 and 1a). The advantage of the CI analysis compared to the PC/SLP (or temperature or precip-itation) correlation analysis is that the CI analysis does not depend only on the leading mode of variability but directly integrates all other modes that directly affect the fluctuations of the analysed variable.
Pausata et al. (2009) have also shown that, during differ-ent climate states in which the leading mode of SLP variabil-ity (PC1) is less dominant (lower explained variabilvariabil-ity of the EOF1), the CI and the PC correlation patterns can be com-pletely different. Therefore, we have decided to adopt the CI in addition to the canonical NAOI as a further metric to better understand and interpret large-scale circulation changes.
Appendix B
In Appendix B, we examine how the large-scale atmospheric indicators used in this study are related to the number of rainy days in DJF over Europe. PM concentrations at the surface can be affected by different factors such as precipitation or the thermal structure of the boundary layer. However, these factors are implicitly included in the large-scale changes in atmospheric circulation, i.e. the changes in the CI pattern, NAO phase and blocking events.
We focus on the average number of rainy days per month during winter, because the monthly aerosol concentrations
Figure A1. Correlations between North Atlantic winter SLP (December–February) and the PC1 of SLP. The markers indicate the maxima in CI (+ sign) and in the SLP/PC1 (xsign) correla-tions.
are more strongly affected by the number of rainy days (even with small precipitation amounts) rather than by the total intensity of the monthly precipitation (Claassen and Halm, 1995). We define a rainy day as a day with precipi-tation > 1 mm at a given gridbox.
In order to study the degree to which rainy day anoma-lies are associated to the NAO phase and the position of the southern SLP centre of action (SCOA) in the 2000 simula-tion, we use a regression analysis: a regression coefficient b(i, j ) is calculated at each specific latitude(i)and longi-tude(j ) by linearly regressing the input variable of inter-est (e.g. rainy days(t, i, j ), blocking frequency anomalies) against the reference time series (e.g. NAOI(t) or SCOA In-dex – SCOAI(t)).
The corresponding regression map is a composite field consisting of a linear combination of all available data, where each datum (e.g. rainy day/blocking frequency anomaly) is weighted by the concurrent value of the index (e.g. NAOI/SCOAI) time series:
b (i, j )=
1
N
×
N X
t=1
[Rdayanom(t, i, j )×INDEX(t )], (B1)
a) b)
Figure B1. Rainy day anomalies (in %) per unit of NAOI(a)and CI time series(b) standard deviation. The CI time series has been constructed as described in Appendix B. The anomalies are calculated using a one-point regression analysis. Only differences significant at the 95 % confidence level are shown. Note that the two panels use different colour scales.
a) b)
d) c)
Figure B2.The values at each grid point show the composite anomaly in rainy days (in %) in the selected domain – WM(a), CE(b), EM
the central-western Mediterranean and increases over part of central Europe. The opposite influence is found for the east-ern Mediterranean, where a positive NAO phase is associ-ated with an increased number of rainy days, while an east-ward location of the southern SLP maximum is linked to a decreased number of rainy days.
Finally, we relate rainy day anomalies in each of the four selected regions in Europe (WM, EM, CE and EE) to the fre-quency of blocking events in the Atlantic sector (30–72◦N, 80◦W–45◦E). To do so, we construct a composite map for each domain. We take each grid point (Xfd,Yfd)within the
full domain (entire Atlantic sector), and compute the fre-quency of rainy days at each grid point (xrd,yrd)within the
regional domain (WM, EM, CE or EE) while grid point (Xfd, Yfd)is blocked. Such values are assigned to grid point (Xfd, Yfd). This calculation is then repeated for days on which grid point (Xfd,Yfd)is unblocked. An anomaly in frequency of rainy days between the blocked and unblocked cases is then found. This means that, for each grid point (Xfd,Yfd)in the
full domain, we have several percentage anomalies, one for each grid point (xrd,yrd)within the regional domain. To
ob-tain the composite map for each regional domain, we then average these values so that a single percentage value is as-signed to each grid point (Xfd,Yfd). For example, for WM
the positive values over southern Norway indicate that, when there is a blocking event over this area, an increase in rainy days by about 10 % is expected over the WM compared to the case with no blocking over southern Norway. The value of 10 % is an average over the response at each of the grid points (xrd,yrd)within the WM domain. On the other hand,
blocking events to the west of and over the WM lead to a 10–15 % increase in rainy days relative to the case with no blocking events over the same regions (Fig. B2a).
Hence, our analysis shows, as expected, that increased numbers of blocking events over western Europe and the eastern North Atlantic are associated with reduced numbers of rainy days over the Iberian Peninsula, while high-latitude blockings are associated with more precipitation days over the WM (Fig. B2a). For the EM, on the opposite, the block-ing frequency over western Europe and the eastern North At-lantic does not have a remarkable influence (Fig. B2c). This, together with a contrasting influence on this region of the NAO and SCOA shifts (Fig. B1), may be responsible for the sometimes apparently ambiguous change in PM anomalies simulated in the three 2030 experiments.
This analysis shows how rainy days are connected to the large-scale circulation patterns investigated in this study, pro-viding a context for their impact on PM concentrations at the surface.
Appendix C
In Appendix C, we examine how the number of rainy days in DJF changes in the 2030 simulations compared to the 2000 control experiment over Europe. This step will pro-vide a better understanding of how the atmospheric circu-lation changes may impact – through changes in the number of rainy days – PM distributions in the future.
a) b)
c) d)
6
day/month (%)
(%) (%)
Acknowledgements. F. S. R. Pausata and F. J. Dentener were funded by the EU FP7 project PEGASOS. The authors would like to thank P. Davini for discussions and suggestions on the atmospheric blocking analysis, and the two anonymous reviewers.
Edited by: M. Kanakidou
References
Albrecht, B. A.: Aerosols, cloud microphysics, and fractional cloudiness, Science, 245, 1227–30, doi:10.1126/science.245.4923.1227, 1989.
Barnes, E. A. and Fiore, A. M.: Surface ozone variability and the jet position: Implications for projecting future air quality, Geophys. Res. Lett., 40, 2839–2844, doi:10.1002/grl.50411, 2013. Barth, M. C., Rasch, P. J., Kiehl, J. T., Benkovitz, C. M., and
Schwartz, S. E.: Sulfur chemistry in the National Center for At-mospheric Research Community Climate Model: Description, evaluation, features, and sensitivity to aqueous chemistry, J. Geo-phys. Res., 105, 1387, doi:10.1029/1999JD900773, 2000. Berrisford, P., Hoskins, B. J., and Tyrlis, E.: Blocking and
Rossby Wave Breaking on the Dynamical Tropopause in the Southern Hemisphere, J. Atmos. Sci., 64, 2881–2898, doi:10.1175/JAS3984.1, 2007.
Cagnazzo, C., Manzini, E., Giorgetta, M. A., Forster, P. M. De F., and Morcrette, J. J.: Impact of an improved shortwave radia-tion scheme in the MAECHAM5 General Circularadia-tion Model, At-mos. Chem. Phys., 7, 2503–2515, doi:10.5194/acp-7-2503-2007, 2007.
Christoudias, T., Pozzer, A., and Lelieveld, J.: Influence of the North Atlantic Oscillation on air pollution transport, Atmos. Chem. Phys., 12, 869–877, doi:10.5194/acp-12-869-2012, 2012. Claassen, H. C. and Halm, D. R.: A possible deficiency in
estimates of wet deposition obtained from data generated by the NADP/NTN network, Atmos. Environ., 29, 437–448, doi:10.1016/1352-2310(94)00182-K, 1995.
Cofala, J., Amann, M., Klimont, Z., Kupiainen, K., and Höglund-Isaksson, L.: Scenarios of global anthropogenic emissions of air pollutants and methane until 2030, Atmos. Environ., 41, 8486– 8499, doi:10.1016/j.atmosenv.2007.07.010, 2007.
Croci-Maspoli, M., Schwierz, C., and Davies, H. C.: Atmospheric blocking: space-time links to the NAO and PNA, Clim. Dyn., 29, 713–725, doi:10.1007/s00382-007-0259-4, 2007.
Davini, P. and Cagnazzo, C.: On the misinterpretation of the North Atlantic Oscillation in CMIP5 models, Clim. Dyn., 43, 1497– 1511, doi:10.1007/s00382-013-1970-y, 2013.
Davini, P., Cagnazzo, C., Gualdi, S., and Navarra, A.: Bidimen-sional Diagnostics, Variability, and Trends of Northern Hemi-sphere Blocking, J. Clim., 25, 6496–6509, doi:10.1175/JCLI-D-12-00032.1, 2012.
Eckhardt, S., Stohl, A., Beirle, S., Spichtinger, N., James, P., Forster, C., Junker, C., Wagner, T., Platt, U., and Jennings, S. G.: The North Atlantic Oscillation controls air pollution transport to the Arctic, Atmos. Chem. Phys., 3, 1769–1778, doi:10.5194/acp-3-1769-2003, 2003.
EEA: European Environment Agency: Air quality in Europe, Tech. rep., Luxembourg, Publications Office of the European
Union., available at: http://www.eea.europa.eu/publications/ air-quality-in-europe-2013, 2013.
Feichter, J., Kjellström, E., Rodhe, H., Dentener, F., Lelieveldi, J., and Roelofs, G.-J.: Simulation of the tropospheric sulfur cy-cle in a global climate model, Atmos. Environ., 30, 1693–1707, doi:10.1016/1352-2310(95)00394-0, 1996.
Feichter, J., Roeckner, E., Lohmann, U., and Liepert, B.: Nonlin-ear Aspects of the Climate Response to Greenhouse Gas and Aerosol Forcing, J. Clim., 17, 2384–2398, doi:10.1175/1520-0442(2004)017<2384:NAOTCR>2.0.CO;2, 2004.
Fiore, A. M., Naik, V., Spracklen, D. V, Steiner, A., Unger, N., Prather, M., Bergmann, D., Cameron-Smith, P. J., Cionni, I., Collins, W. J., Dalsøren, S., Eyring, V., Folberth, G. A., Ginoux, P., Horowitz, L. W., Josse, B., Lamarque, J.-F., MacKenzie, I. A., Nagashima, T., O’Connor, F. M., Righi, M., Rumbold, S. T., Shindell, D. T., Skeie, R. B., Sudo, K., Szopa, S., Takemura, T., and Zeng, G.: Global air quality and climate., Chem. Soc. Rev., 41, 6663–83, doi:10.1039/c2cs35095e, 2012.
Fischer-Bruns, I., Banse, D. F., and Feichter, J.: Future impact of anthropogenic sulfate aerosol on North Atlantic climate, Clim. Dyn., 32, 511–524, doi:10.1007/s00382-008-0458-7, 2008. Gillett, N. P. and Fyfe, J. C.: Annular mode changes in the
CMIP5 simulations, Geophys. Res. Lett., 40, 1189–1193, doi:10.1002/grl.50249, 2013.
Gleckler, P. J., Taylor, K. E., and Doutriaux, C.: Performance metrics for climate models, J. Geophys. Res., 113, D06104, doi:10.1029/2007JD008972, 2008.
Hilmer, M. and Jung, T.: Evidence for a recent change in the link between the North Atlantic Oscillation and Arctic Sea ice export, Geophys. Res. Lett., 27, 989–992, doi:10.1029/1999GL010944, 2000.
Hoerling, M. P., Hurrell, J. W., and Xu, T.: Tropical origins for recent North Atlantic climate change, Science, 292, 90–92, doi:10.1126/science.1058582, 2001.
Hori, M. E., Nohara, D., and Tanaka, H. L.: Influence of Arctic Os-cillation towards the Northern Hemisphere Surface Temperature Variability under the Global Warming Scenario, J. Meteorol. Soc. Japan, 85, 847–859, doi:10.2151/jmsj.85.847, 2007.
Horton, D. E., Skinner, C. B., Singh, D., and Diffen-baugh, N. S.: Occurrence and persistence of future atmo-spheric stagnation events, Nat. Clim. Chang., 4, 698–703, doi:10.1038/nclimate2272, 2014.
Hu, Z.-Z. and Wu, Z.: The intensification and shift of the an-nual North Atlantic Oscillation in a global warming sce-nario simulation, Tellus A, 56, 112–124, doi:10.1111/j.1600-0870.2004.00050.x, 2004.
Hurrell, J. W.: Decadal trends in the north atlantic oscillation: re-gional temperatures and precipitation, Science, 269, 676–679, doi:10.1126/science.269.5224.676, 1995.
IMAGE-team: The IMAGE 2.2 implementation of the SRES sce-narios. A comprehensive analysis of emissions, climate change and impacts in the 21st century, CD-ROM Publ., Bilthoven, Natl. Inst. Public Heal. Environ., 2001.
Cam-bridge University Press, CamCam-bridge, United Kingdom and New York, NY, USA, 2013.
Jacob, D. J. and Winner, D. A.: Effect of Climate Change on Air Quality, Atmos. Environ., 43, 51–63, available at: http://dash. harvard.edu/handle/1/3553961 (last access: 9 October 2014), 2009.
Karpechko, A. Y.: Uncertainties in future climate attributable to uncertainties in future Northern Annular Mode trend, Geophys. Res. Lett., 37, L20702, doi:10.1029/2010GL044717, 2010. Kloster, S., Dentener, F., Feichter, J., Raes, F., van Aardenne, J.,
Roeckner, E., Lohmann, U., Stier, P., and Swart, R.: Influence of future air pollution mitigation strategies on total aerosol radiative forcing, Atmos. Chem. Phys., 8, 6405–6437, doi:10.5194/acp-8-6405-2008, 2008.
Kloster, S., Dentener, F., Feichter, J., Raes, F., Lohmann, U., Roeck-ner, E., and Fischer-Bruns, I.: A GCM study of future climate response to aerosol pollution reductions, Clim. Dyn., 34, 1177– 1194, doi:10.1007/s00382-009-0573-0, 2009.
Kuzmina, S. I.: The North Atlantic Oscillation and greenhouse-gas forcing, Geophys. Res. Lett., 32, L04703, doi:10.1029/2004GL021064, 2005.
Lim, G. H. and Wallace, J. M.: Structure and Evolution of Baroclinic Waves as Inferred from Regression Anal-ysis, J. Atmos. Sci., 48, 1718–1732, doi:10.1175/1520-0469(1991)048<1718:SAEOBW>2.0.CO;2, 1991.
Lim, S. S., Vos, T., Flaxman, A. D., Danaei, G., Shibuya, K., Adair-Rohani, H., Amann, M., Anderson, H. R., Andrews, K. G., Aryee, M., Atkinson, C., Bacchus, L. J., Bahalim, A. N., Balakrishnan, K., Balmes, J., Barker-Collo, S., Baxter, A., Bell, M. L., Blore, J. D., Blyth, F., Bonner, C., Borges, G., Bourne, R., Boussinesq, M., Brauer, M., Brooks, P., Bruce, N. G., Brunekreef, B., Bryan-Hancock, C., Bucello, C., Buchbinder, R., Bull, F., Burnett, R. T., Byers, T. E., Calabria, B., Carapetis, J., Carnahan, E., Chafe, Z., Charlson, F., Chen, H., Chen, J. S., Cheng, A. T.-A., Child, J. C., Cohen, A., Colson, K. E., Cowie, B. C., Darby, S., Darling, S., Davis, A., Degenhardt, L., Den-tener, F., Des Jarlais, D. C., Devries, K., Dherani, M., Ding, E. L., Dorsey, E. R., Driscoll, T., Edmond, K., Ali, S. E., Engell, R. E., Erwin, P. J., Fahimi, S., Falder, G., Farzadfar, F., Ferrari, A., Finucane, M. M., Flaxman, S., Fowkes, F. G. R., Freedman, G., Freeman, M. K., Gakidou, E., Ghosh, S., Giovannucci, E., Gmel, G., Graham, K., Grainger, R., Grant, B., Gunnell, D., Gutier-rez, H. R., Hall, W., Hoek, H. W., Hogan, A., Hosgood, H. D., Hoy, D., Hu, H., Hubbell, B. J., Hutchings, S. J., Ibeanusi, S. E., Jacklyn, G. L., Jasrasaria, R., Jonas, J. B., Kan, H., Kanis, J. A., Kassebaum, N., Kawakami, N., Khang, Y.-H., Khatibzadeh, S., Khoo, J.-P., Kok, C., et al.: A comparative risk assessment of burden of disease and injury attributable to 67 risk factors and risk factor clusters in 21 regions, 1990–2010: a systematic anal-ysis for the Global Burden of Disease Study 2010, Lancet, 380, 2224–2260, doi:10.1016/S0140-6736(12)61766-8, 2012. Lohmann, U., Stier, P., Hoose, C., Ferrachat, S., Kloster, S.,
Roeck-ner, E., and Zhang, J.: Cloud microphysics and aerosol indi-rect effects in the global climate model ECHAM5-HAM, At-mos. Chem. Phys., 7, 3425–3446, doi:10.5194/acp-7-3425-2007, 2007.
Müller, W. A. and Roeckner, E.: ENSO teleconnections in projec-tions of future climate in ECHAM5/MPI-OM, Clim. Dyn., 31, 533–549, doi:10.1007/s00382-007-0357-3, 2008.
Nakicenovic N. and Swart R.: Special Report on Emissions Scenar-ios: A Special Report of Working Group III of the Intergovern-mental Panel on Climate Change, Cambridge University Press, Cambridge, UK, ISBN:9780521804936, 2000.
Nazarenko, L. and Menon, S.: Varying trends in surface energy fluxes and associated climate between 1960 and 2002 based on transient climate simulations, Geophys. Res. Lett., 32, L22704, doi:10.1029/2005GL024089, 2005.
Omrani, N.-E., Keenlyside, N. S., Bader, J., and Manzini, E.: Stratosphere key for wintertime atmospheric response to warm Atlantic decadal conditions, Clim. Dyn., 42, 649–663, doi:10.1007/s00382-013-1860-3, 2013.
Pausata, F. S. R., Li, C., Wettstein, J. J., Nisancioglu, K. H., and Battisti, D. S.: Changes in atmospheric variability in a glacial climate and the impacts on proxy data: a model intercomparison, Clim. Past, 5, 489–502, doi:10.5194/cp-5-489-2009, 2009. Pausata, F. S. R., Pozzoli, L., Vignati, E., and Dentener, F. J.: North
Atlantic Oscillation and tropospheric ozone variability in Eu-rope: model analysis and measurements intercomparison, At-mos. Chem. Phys., 12, 6357–6376, doi:10.5194/acp-12-6357-2012, 2012.
Pausata, F. S. R., Pozzoli, L., Dingenen, R. Van, Vignati, E., Cavalli, F., and Dentener, F. J.: Impacts of changes in North Atlantic atmospheric circulation on particulate matter and hu-man health in Europe, Geophys. Res. Lett., 40, 4074–4080, doi:10.1002/grl.50720, 2013.
Pelly, J. L. and Hoskins, B. J.: A New Perspective on Blocking, J. Atmos. Sci., 60, 743–755, doi:10.1175/1520-0469(2003)060<0743:ANPOB>2.0.CO;2, 2003.
Peterson, K. A., Lu, J., and Greatbatch, R. J.: Evidence of nonlinear dynamics in the eastward shift of the NAO, Geophys. Res. Lett., 30, 1030, doi:10.1029/2002GL015585, 2003.
Pham, M.: Changes in atmospheric sulfur burdens and concentra-tions and resulting radiative forcings under IPCC SRES emis-sion scenarios for 1990–2100, J. Geophys. Res., 110, D06112, doi:10.1029/2004JD005125, 2005.
Rex, D. F.: Blocking Action in the Middle Troposphere and its Effect upon Regional Climate, Tellus, 2, 196–211, doi:10.1111/j.2153-3490.1950.tb00331.x, 1950.
Riahi, K. and Roehrl, R. A.: Greenhouse Gas Emissions in a Dynamics-as-Usual Scenario of Economic and Energy De-velopment, Technol. Forecast. Soc. Change, 63, 175–205, doi:10.1016/S0040-1625(99)00111-0, 2000.
Roeckner, E., Siebert, T., and Feichter, J.: Climatic response to an-thropogenic sulfate forcing simulated with a general circulation model, in Aerosol Forcing of Climate, edited by R. J. Charlson and J. Heintzenberg, 349–362, John Wiley & Sons Ltd., Chices-ter., 1995.
Roeckner, E., Bengtsson, L., Feichter, J., Lelieveld, J., and Rodhe, H.: Transient Climate Change Simulations with a Coupled Atmosphere–Ocean GCM Including the Tropospheric Sulfur Cycle, J. Clim., 12, 3004–3032, doi:10.1175/1520-0442(1999)012<3004:TCCSWA>2.0.CO;2, 1999.
Roelofs, G.-J., Lelieveld, J., and Ganzeveld, L.: Simulation of global sulfate distribution and the influence on effective cloud drop radii with a coupled photochemistry sulfur cycle model, Tellus B, 50, doi:10.3402/tellusb.v50i3.16098, 1998.
Rosenblatt, M.: Remarks on Some Nonparametric Estimates of a Density Function, Ann. Math. Stat., 27, 832–837, 1956. Scaife, A. A., Knight, J. R., Vallis, G. K., and Folland, C.
K.: A stratospheric influence on the winter NAO and North Atlantic surface climate, Geophys. Res. Lett., 32, L18715, doi:10.1029/2005GL023226, 2005.
Shindell, D., Kuylenstierna, J. C. I., Vignati, E., van Dingenen, R., Amann, M., Klimont, Z., Anenberg, S. C., Muller, N., Janssens-Maenhout, G., Raes, F., Schwartz, J., Faluvegi, G., Pozzoli, L., Kupiainen, K., Höglund-Isaksson, L., Emberson, L., Streets, D., Ramanathan, V., Hicks, K., Oanh, N. T. K., Milly, G., Williams, M., Demkine, V., and Fowler, D.: Simultaneously mitigating near-term climate change and improving human health and food security, Science, 335, 183–189, doi:10.1126/science.1210026, 2012.
Sillmann, J., Pozzoli, L., Vignati, E., Kloster, S. and Feichter, J.: Aerosol effect on climate extremes in Europe under dif-ferent future scenarios, Geophys. Res. Lett., 40, 2290–2295, doi:10.1002/grl.50459, 2013.
Stephenson, D. B., Pavan, V., Collins, M., Junge, M. M., and Quadrelli, R.: North Atlantic Oscillation response to transient greenhouse gas forcing and the impact on European winter cli-mate: a CMIP2 multi-model assessment, Clim. Dyn., 27, 401– 420, doi:10.1007/s00382-006-0140-x, 2006.
Stier, P., Feichter, J., Kinne, S., Kloster, S., Vignati, E., Wilson, J., Ganzeveld, L., Tegen, I., Werner, M., Balkanski, Y., Schulz, M., Boucher, O., Minikin, A., and Petzold, A.: The aerosol–climate model ECHAM5-HAM, Atmos. Chem. Phys., 5, 1125–1156, doi:10.5194/acp-5-1125-2005, 2005.
Sundquist, H., Berge, E.. and Kristjansson, J. E.: Condensation and cloud parameterization studies with a mesoscale numerical pre-diction model, Mon. Weather Rev., 117, 1641–1657, 1989. Textor, C., Schulz, M., Guibert, S., Kinne, S., Balkanski, Y., Bauer,
S., Berntsen, T., Berglen, T., Boucher, O., Chin, M., Dentener, F., Diehl, T., Feichter, J., Fillmore, D., Ginoux, P., Gong, S., Grini, A., Hendricks, J., Horowitz, L., Huang, P., Isaksen, I. S. A., Iversen, T., Kloster, S., Koch, D., Kirkevåg, A., Kristjans-son, J. E., Krol, M., Lauer, A., Lamarque, J. F., Liu, X., Mon-tanaro, V., Myhre, G., Penner, J. E., Pitari, G., Reddy, M. S., Seland, Ø., Stier, P., Takemura, T., and Tie, X.: The effect of harmonized emissions on aerosol properties in global models – an AeroCom experiment, Atmos. Chem. Phys., 7, 4489–4501, doi:10.5194/acp-7-4489-2007, 2007.
Tibaldi, S. and Molteni, F.: On the operational predictabil-ity of blocking, Tellus A, 42, 343–365, doi:10.1034/j.1600-0870.1990.t01-2-00003.x, 1990.
Toon, O. B. and Ackerman, T. P.: Algorithms for the calculation of scattering by stratified spheres., Appl. Opt., 20, 3657–3660, doi:10.1364/AO.20.003657, 1981.
Twomey, S.: The Influence of Pollution on the Shortwave Albedo of Clouds, J. Atmos. Sci., 34, 1149–1152, 1977.
Vignati, E., Wilson, J., and Stier, P.: M7: An efficient size-resolved aerosol microphysics module for large-scale aerosol transport models, J. Geophys. Res., 109, D22202, doi:10.1029/2003JD004485, 2004.
Walker, G. T. and Bliss, E. W.: World weather V, Mem. R. Meteorol. Soc., 4, 53–84, 1932.
Wang, Y.-H. and Magnusdottir, G.: The Shift of the Northern Node of the NAO and Cyclonic Rossby Wave Breaking, J. Clim., 25, 7973–7982, doi:10.1175/JCLI-D-11-00596.1, 2012.
WHO: Review of evidence on health aspects of air pollution – RE-VIHAAP Project. First results., Tech. rep., Copenhagen, World Health Organization, 2013.
Woollings, T., Hoskins, B., Blackburn, M. and Berrisford, P.: A New Rossby Wave – Breaking Interpretation of the North Atlantic Oscillation, J. Atmos. Sci., 65, 609–626, doi:10.1175/2007JAS2347.1, 2008.
Yao, Y. and Luo, D.: Relationship between zonal position of the North Atlantic Oscillation and Euro-Atlantic blocking events and its possible effect on the weather over Europe, Sci. China Earth Sci., doi:10.1007/s11430-014-4949-6, 2014.