ESDD
4, 235–278, 2013Simulating land use effects on ecosystem
services and carbon cycling in Africa
M. Lindeskog et al.
Title Page
Abstract Introduction
Conclusions References
Tables Figures
◭ ◮
◭ ◮
Back Close
Full Screen / Esc
Printer-friendly Version Interactive Discussion
Discussion
P
a
per
|
Dis
cussion
P
a
per
|
Discussion
P
a
per
|
Discussio
n
P
a
per
|
Earth Syst. Dynam. Discuss., 4, 235–278, 2013 www.earth-syst-dynam-discuss.net/4/235/2013/ doi:10.5194/esdd-4-235-2013
© Author(s) 2013. CC Attribution 3.0 License.
Open Access
Earth System Dynamics
Discussions
Geoscientiic Geoscientiic
Geoscientiic Geoscientiic
This discussion paper is/has been under review for the journal Earth System Dynamics (ESD). Please refer to the corresponding final paper in ESD if available.
Implications of accounting for land use in
simulations of ecosystem services and
carbon cycling in Africa
M. Lindeskog1, A. Arneth2, A. Bondeau3,5, K. Waha4, J. Seaquist1, S. Olin1, and B. Smith1
1
Department of Physical Geography and Ecosystem Science, Lund University, S ¨olvegatan 12, 22362 Lund, Sweden
2
Karlsruhe Institute of Technology, Institute of Metereology and Climate Research – Atmospheric Environmental Research (IMK-IFU), Kreuzeckbahnstr. 19, 82467 Garmisch-Partenkirchen, Germany
3
Climate Impacts and Vulnerabilities, Potsdam Institute for Climate Impact Research (PIK), P.O. Box 60 1203, 14412 Potsdam, Germany
4
Earth System Analysis, Potsdam Institute for Climate Impact Research (PIK), P.O. Box 60 1203, 14412 Potsdam, Germany
5
ESDD
4, 235–278, 2013Simulating land use effects on ecosystem
services and carbon cycling in Africa
M. Lindeskog et al.
Title Page
Abstract Introduction
Conclusions References
Tables Figures
◭ ◮
◭ ◮
Back Close
Full Screen / Esc
Printer-friendly Version Interactive Discussion
Discussion
P
a
per
|
Dis
cussion
P
a
per
|
Discussion
P
a
per
|
Discussio
n
P
a
per
|
Received: 5 November 2012 – Accepted: 31 January 2013 – Published: 7 February 2013 Correspondence to: M. Lindeskog ([email protected])
ESDD
4, 235–278, 2013Simulating land use effects on ecosystem
services and carbon cycling in Africa
M. Lindeskog et al.
Title Page
Abstract Introduction
Conclusions References
Tables Figures
◭ ◮
◭ ◮
Back Close
Full Screen / Esc
Printer-friendly Version Interactive Discussion
Discussion
P
a
per
|
Dis
cussion
P
a
per
|
Discussion
P
a
per
|
Discussio
n
P
a
per
|
Abstract
Dynamic global vegetation models (DGVMs) are important tools for modelling impacts of global change on ecosystem services. However, current models often do not take full account of human land management and land use and land cover changes (LULCC). We integrated croplands and their management and natural vegetation recovery and
5
succession following land use abandonment into the LPJ-GUESS DGVM. The revised model was applied to Africa as a case study to investigate the implications of account-ing for land use on agricultural production, net ecosystem carbon balance (NECB) and on the general skill of the model in reproducing trends and patterns in vegetation structure and function. The seasonality of modelled monthly fraction of absorbed
pho-10
tosynthetically active radiation (FPAR) was shown to agree well with satellite-inferred normalised difference vegetation index (NDVI). In regions with a large proportion of cropland, the managed land addition improved the FPAR vs. NDVI fit significantly. Mod-elled 1991–1995 average yields for the seven most important African crops, represent-ing potential optimal yields limited only by climate forcrepresent-ings, were generally higher than
15
reported FAO yields by a factor of 2–6, similar to previous yield gap estimates. Mod-elled inter-annual yield variations during 1971–2005 generally agreed well with FAO statistics, especially in regions with pronounced climate seasonality. Modelled land-atmosphere carbon fluxes for Africa associated with land use change (0.09 PgC yr−1 release to the atmosphere for the 1980s) agreed well with previous estimates.
Crop-20
land management options (residue removal, grass as cover crop) were shown to be of similar importance to the land-atmosphere carbon flux as land use change for the 20th century.
1 Introduction
A large part of the earth’s surface is covered by managed land, e.g. croplands (about
25
ESDD
4, 235–278, 2013Simulating land use effects on ecosystem
services and carbon cycling in Africa
M. Lindeskog et al.
Title Page
Abstract Introduction
Conclusions References
Tables Figures
◭ ◮
◭ ◮
Back Close
Full Screen / Esc
Printer-friendly Version Interactive Discussion
Discussion
P
a
per
|
Dis
cussion
P
a
per
|
Discussion
P
a
per
|
Discussio
n
P
a
per
|
food, fiber and energy production by a growing human population is responsible for an expansion of managed land into intact natural vegetation and more intensive man-agement of existing managed land. This is often in conflict with the goal of preserving global biodiversity (Heywood, 1995). Anthropogenic land use and land cover changes (LULCC) have been important contributors to rising atmospheric CO2 concentrations
5
[hereinafter “CO2”] in the past, accounting for an estimated 156 PgC released for the
period 1850–2000 (Houghton, 2003). Land use, particularly tropical deforestation, con-tinues to contribute significantly to anthropogenic greenhouse gas emissions, releasing an average of around 2 PgC yr−1for the 1980s and 1990s (Houghton, 2003; Le Qu ´er ´e et al., 2009; Zaehle et al., 2011). LULCC may also lead to changes in land surface
10
properties and near-surface energy, water and momentum exchange, contributing to biophysical climate forcing (Pitman et al., 2009; Wramneby et al., 2010; Arora and Montenegro, 2011).
Climate change is predicted to cause adverse effects on terrestrial vegetation in large parts of the world, putting further stress on both biodiversity and managed land
15
productivity (Foley et al., 2005). Combined effects of rising CO2, climate change and
LULCC will act to influence the role of the terrestrial biosphere in the global carbon budget by altering net primary productivity (NPP) and soil carbon turnover, altering the potential of soil and vegetation to store carbon (McGuire et al., 2001).
Agricultural production of food and fodder is one of the key ecosystem services
un-20
derpinning the well-being and development of human society (Millennium Ecosystem Assessment, 2005). Increasing temperatures are projected to have negative conse-quences for crop yields in many regions, especially in the lower latitudes that already experience warm temperatures. Changes in precipitation will be more variable region-ally and might exacerbate or alleviate the negative effects of raised temperatures,
25
ESDD
4, 235–278, 2013Simulating land use effects on ecosystem
services and carbon cycling in Africa
M. Lindeskog et al.
Title Page
Abstract Introduction
Conclusions References
Tables Figures
◭ ◮
◭ ◮
Back Close
Full Screen / Esc
Printer-friendly Version Interactive Discussion
Discussion
P
a
per
|
Dis
cussion
P
a
per
|
Discussion
P
a
per
|
Discussio
n
P
a
per
|
raised temperatures on crop production but the overall magnitude and persistence of such an effect is still debated (Ainsworth and Long 2005; Long et al., 2006; Tubiello et al., 2007; M ¨uller et al., 2009).
Africa has been identified as one of the world’s most vulnerable regions to climate change (M ¨uller et al., 2011). Predicted decreasing crop yields combined with a rapid
5
population increase make food shortage a likely scenario (M ¨uller et al., 2009), but the pattern is regionally complex. A review of both empirical and processed-based crop models on future yields in West Africa shows a high degree of agreement on the negative crop yield prospects (Roudier et al., 2011). In East Africa, precipitation is predicted to increase in the future according to projections from a majority of general
10
circulation models (GCMs). A resulting possible increase in NPP may also lead to increased crop yields (Doherty et al., 2010)
The African continent has been acing as a carbon sink for most of the 20th century, sequestering carbon mainly into forest biomass (Ciais et al., 2009). Intact African trop-ical forests stored 0.34 PgC yr−1during the past 40 yr (Lewis et al., 2009) while in the
15
absence of fire, CO2uptake in African savannahs has been estimated at 1.9 PgC yr− 1
(Bombelli et al., 2009). Savannah fires, either as natural episodic events or resulting from human management, release much of this carbon back to the atmosphere (van der Werf et al., 2008; Lehsten et al., 2009). LULCC, such as the conversion of forest into cropland or pasture, releases large amounts of CO2 and also reduces the carbon
20
sink potential. The present-day African deforestation-related carbon loss has been esti-mated at 0.4 PgC yr−1(Williams et al., 2007), which is relatively modest compared with other tropical regions, mainly because of lower deforestation rates compared to other tropical forest regions. Conversely, abandonment of cropland and the subsequent suc-cession into forest sequesters atmospheric CO2, especially during early successional
25
ESDD
4, 235–278, 2013Simulating land use effects on ecosystem
services and carbon cycling in Africa
M. Lindeskog et al.
Title Page
Abstract Introduction
Conclusions References
Tables Figures
◭ ◮
◭ ◮
Back Close
Full Screen / Esc
Printer-friendly Version Interactive Discussion
Discussion
P
a
per
|
Dis
cussion
P
a
per
|
Discussion
P
a
per
|
Discussio
n
P
a
per
|
Dynamic global vegetation models (DGVMs) have been used for modelling terres-trial vegetation dynamics and ecosystem biogeochemistry under changing climate and CO2, and have been widely used to investigate the potential for terrestrial biota to feed
back to climate change, particularly through carbon cycle changes (McGuire et al., 2001; Friend et al., 2007; Sitch et al., 2008; Arneth et al., 2010a, b). At first DGVMs
5
accounted for LULCC by simulating grassland instead of natural forest or by harvesting a fraction of the natural NPP (McGuire et al., 2001; Brovkin et al., 2004). However, the large variety of crop management practices worldwide made it clear that the im-plementation of specific crop or pasture functions (phenology, carbon allocation and overall productivity) within DGVMs was required. Several DGVMs now have the
capa-10
bilities of accounting for both natural vegetation and agriculture (crops and/or pasture), either at the scale of a large region (Kucharik and Brye, 2003; de Noblet-Ducoudr ´e et al., 2004; Gervois et al., 2004; Kucharik and Twine, 2007; Van den Hoof et al., 2011; Berg et al., 2011; Hidy et al., 2012) or globally (Bondeau et al. 2007, M ¨uller et al., 2007).
15
To evaluate the importance of croplands and pasture for land-atmosphere coupling and the carbon cycle, we integrated managed land and land use change functional-ity into a DGVM optimised for regional applications, further developing an approach adopted from Bondeau et al. (2007). Focusing on Africa as a case study, we simulated crop production, seasonal and interannual variability of vegetation productivity and the
20
continental-scale land-atmosphere carbon fluxes forced by recent historical climate, CO2and observed land use and land cover. We evaluate the skill of the model in
ESDD
4, 235–278, 2013Simulating land use effects on ecosystem
services and carbon cycling in Africa
M. Lindeskog et al.
Title Page
Abstract Introduction
Conclusions References
Tables Figures
◭ ◮
◭ ◮
Back Close
Full Screen / Esc
Printer-friendly Version Interactive Discussion
Discussion
P
a
per
|
Dis
cussion
P
a
per
|
Discussion
P
a
per
|
Discussio
n
P
a
per
|
2 Methods 2.1 DGVM
We employed LPJ-GUESS (Lund-Potsdam-Jena General Ecosystem Simulator, Smith et al., 2001), a DGVM optimised for regional applications, as the modelling platform for our study. LPJ-GUESS combines a detailed, individual- and patch-based
representa-5
tion of vegetation structure, demography and resource competition with physiological and biogeochemical process formulations in common with the more generalised global model LPJ-DGVM as detailed by Sitch et al. (2003) with modifications by Gerten et al. (2004). The model was applied on a 0.5×0.5◦ regular latitude-longitude grid across Africa. The potential natural vegetation in each grid cell was simulated as a dynamic
10
mixture of up to six tree and two grass plant functional types (PFTs), using the PFT set and parameters described in Ahlstr ¨om et al. (2012a). Photosynthesis, respiration, tis-sue turnover and carbon allocation to leaves, fine roots and stems (sapwood) are mod-elled independently for each tree, or generically for C3 and C4 grasses, respectively,
in each of a number (20 in this study) of replicate patches accommodating variation
15
of vegetation dynamics within the potential natural vegetation fraction of each simu-lated grid cell. Height and diameter growth of trees are regusimu-lated by carbon allocation, sapwood-to-heartwood conversion, and a set of prescribed allometric relationships for each PFT. Population dynamics (establishment and mortality) are influenced by current availability and uptake of light and soil water, stand size structure, and the life history
20
characteristics of each PFT (Hickler et al., 2004). Biomass-destroying disturbances are simulated as a stochastic process, here with a generic expectation of 0.01 yr−1. In addition, fires are modelled prognostically based on temperature, current fuel load and moisture (Thonicke et al., 2001). A detailed description of LPJ-GUESS is given by Smith et al. (2001).
25
ESDD
4, 235–278, 2013Simulating land use effects on ecosystem
services and carbon cycling in Africa
M. Lindeskog et al.
Title Page
Abstract Introduction
Conclusions References
Tables Figures
◭ ◮
◭ ◮
Back Close
Full Screen / Esc
Printer-friendly Version Interactive Discussion
Discussion
P
a
per
|
Dis
cussion
P
a
per
|
Discussion
P
a
per
|
Discussio
n
P
a
per
|
exchange (Piao et al., 2013). Results from the model have been compared to ecosys-tem flux measurements, site measurements and satellite-based proxies of NPP, leaf area index (LAI) and biomass, spanning many of the world’s biomes (Morales et al., 2005; Hickler et al., 2005, 2006; H ´ely et al., 2006; Smith et al. 2008; Ahlstr ¨om et al., 2012a).
5
Land use and cropland representations were implemented in LPJ-GUESS based on LPJ-mL (Bondeau et al., 2007), with a number of modifications (see below). Cropland is represented by eleven crop PFTs (Table 1), simulated separately (without inter-PFT competition) and two grass PFTs (C3 and C4 grass) as cover crop between harvest
and sowing. The same grass PFTs are used to represent pastures. Irrigated crops are
10
simulated separately. For wheat, an upper temperature limit of 10◦C for the coldest month for growth is set following Bondeau et al. (2007). The main modifications in the model compared to LPJ-mL as described by Bondeau et al. (2007) are a new phe-nology scheme, coupling LAI and leaf C mass on a daily timestep, a dynamic PHU calculation based on local climate conditions in each grid cell, simulation of
regener-15
ation and recovery of vegetation by creating a new natural vegetation stand following cropland abandonment and a revised calculation of crop sowing dates following Waha et al. (2011).
In LPJ-mL, crop phenology followed the development of the potential LAI, which was coupled to the sum of heat units (degree days above a crop-specific base temperature,
20
Tb) accumulated from the time of sowing, and eventually corrected if a climatic stress reduced the actual available carbon for leaf growth (Bondeau et al., 2007). This could cause significant discrepancies between daily values of heat sum-based LAI and actual available carbon for leaf growth based on the simulated leaf carbon assimilation. This method also requires a fixed maximum LAI value that does not respond to a changing
25
ESDD
4, 235–278, 2013Simulating land use effects on ecosystem
services and carbon cycling in Africa
M. Lindeskog et al.
Title Page
Abstract Introduction
Conclusions References
Tables Figures
◭ ◮
◭ ◮
Back Close
Full Screen / Esc
Printer-friendly Version Interactive Discussion
Discussion
P
a
per
|
Dis
cussion
P
a
per
|
Discussion
P
a
per
|
Discussio
n
P
a
per
|
The development of the harvest index (HI), i.e. the fraction of above-ground carbon present in the harvestable organs, and the onset of senescence and LAI development during senescence is dependent on accumulated heat units and calculated as in Bon-deau et al. (2007). In LPJ-GUESS, the potential heat unit (PHU) sum needed for full development of a crop, determining the time at which the crop is harvested, is
calcu-5
lated dynamically, using a 10-yr running mean of heat unit sums accumulated from the sowing date to the end of a sampling period (ranging from 190 to 245 days) de-rived from default sowing and harvest limit dates as reported by Bondeau et al. (2007). The dynamic PHU calculation can be done either for an initial time period only, to cal-ibrate for the local climate, or also for an extended period, to simulate adapation to a
10
changing climate by selecting suitable crop varieties/genotypes. In the present report, dynamic PHU was used for the whole time period (Table 1). A lower PHU limit of 900 degree days was used. Maintenance respiration of storage organs was set to zero. The modelled crop yield represents potential optimal yield, limited by climate and CO2only. The recent local climate variability (seasonality) determines whether the limiting
fac-15
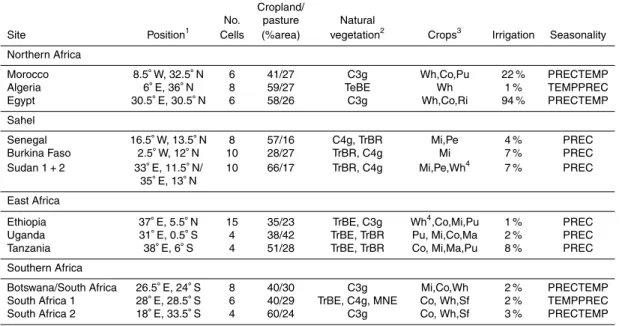
tor for date of sowing is temperature or precipitation, or if there is a lack of climate sea-sonality (Waha et al., 2011) (Fig. 2). Five main seasea-sonality types to determine sowing date were specified as: TEMP (temperature seasonality); PREC (precipitation season-ality); TEMPPREC (both temperature and precipitation seasonality, minimum monthly temperature <10◦C), temperature determines sowing date; PRECTEMP (both
tem-20
perature and precipitation seasonality, minimum monthly temperature>=10◦C), pre-cipitation determines sowing date; NONE (no seasonality), default sowing date used. For irrigated crops at PRECTEMP sites, temperature-dependent sowing was used un-less specifically stated in the text. The temperature limits for temperature-dependent sowing were as in Waha et al. (2011) (Table 1).
25
ESDD
4, 235–278, 2013Simulating land use effects on ecosystem
services and carbon cycling in Africa
M. Lindeskog et al.
Title Page
Abstract Introduction
Conclusions References
Tables Figures
◭ ◮
◭ ◮
Back Close
Full Screen / Esc
Printer-friendly Version Interactive Discussion
Discussion
P
a
per
|
Dis
cussion
P
a
per
|
Discussion
P
a
per
|
Discussio
n
P
a
per
|
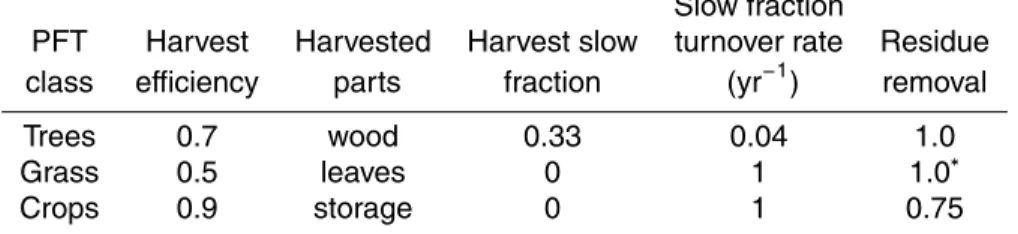
further fraction (the residue removal fraction) is removed (and oxidised within one year). This PFT parameter is set to 0.75 for all crops in this study unless specified otherwise. Grazing of managed grassland is simulated by removing 50 % of the above-ground carbon. This is roughly in agreement with estimates of a 90 % removal in intensively grazed pastures and a 50 % re-entering of this carbon back to the litter pool as manure.
5
At the conversion of forest to cropland, 70 % of tree stems are harvested and the rest is oxidised the same year (burned). Part of the harvested wood (firewood) is oxidised the same year (67 %) and the rest goes to a slow pool, representing paper and timber, with a 25-yr turnover period. This is a simplified version of Houghton’s et al. (1983), where two long-lived pools (10 yr/100 yr turnover times) exist, also used by McGuire
10
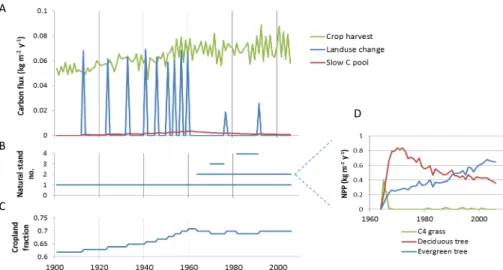
et al. (2001) with LPJ. At cropland abandonment (conversion to natural vegetation), a new stand is created from bare ground, allowing an establishment of natural vegetation with a succession e.g. from grass to decidious trees and finally evergreen trees. An example of modelled carbon fluxes at cropland expansion and abandonment is shown for a moist tropical site in Liberia in Fig. 3.
15
“Land use functionality” in this paper refers to the dynamic representations of dif-ferent landcover types with associated land uses, in this study specifically irrigated or rainfed cropland and pasture. The expected difference in e.g. modelled carbon fluxes in simulations with and without land use functionality would be the differential response by different land covers to changes in climate and CO2as well as the effects of LULCC.
20
2.2 Observational data
Soil texture data were as described by Sitch et al. (2003) and historical yearly global atmospheric CO2concentrations were obtained from the Carbon Cycle Model Linkage
project (McGuire et al., 2001). Monthly values of temperature, precipitation and cloudi-ness were taken from the CRU TS 3.0 data set at 0.5 degree resolution (Mitchell and
25
ESDD
4, 235–278, 2013Simulating land use effects on ecosystem
services and carbon cycling in Africa
M. Lindeskog et al.
Title Page
Abstract Introduction
Conclusions References
Tables Figures
◭ ◮
◭ ◮
Back Close
Full Screen / Esc
Printer-friendly Version Interactive Discussion
Discussion
P
a
per
|
Dis
cussion
P
a
per
|
Discussion
P
a
per
|
Discussio
n
P
a
per
|
We used the bimonthly maximum value composited Normalised Difference Vegeta-tion Index (NDVI) Global Inventory Modeling and Mapping Studies (GIMMS) dataset derived from the National Oceanic and Atmospheric Administration’s (NOAA) series of Advanced Very High Resolution Radiometer (AVHRR) instruments with a spatial reso-lution of 0.07◦(Tucker et al., 2005). The red and near infrared bands of the AVHRR
sen-5
sor are used to compute the NDVI, a metric that is correlated with the photosynthetic activity and LAI of green vegetation (Sellers, 1989). The NDVI also reduces variations not related to vegetation information from the effects of topography, sensor calibration and viewing geometry, while the maximum value compositing procedure minimises the effects of cloud cover and the atmosphere (Holben, 1986). Corrections for sensor
dif-10
ferences, sensor drift and the effects of volcanic eruptions have all been accounted for in the GIMMS data set. We scaled up the NDVI observations to 0.5◦using mean-value aggregation, by including all overlapping cells within the larger 0.5◦area and by ignor-ing all water areas, negative values, and urban land cover (identified usignor-ing the Global Land Cover Facility land cover dataset, e.g. Hansen et al., 2000). We also extracted
15
the maximum NDVI from the two NDVI estimates for each month over the whole time series in order to match the temporal frequency of LPJ-GUESS output. This has the added benefit of further reducing the effects of atmospheric disturbance in the data.
Food and Agriculture Organization of the United Nations (FAO) national crop yield data were obtained from http://faostat.fao.org/site/567/default.aspx{#}ancor(last
ac-20
cess: 1 March 2012).
The historical cropland data set used in this study was an adaptation by Bondeau et al. (2007) of the cropland fraction for the period 1901–1992 (Ramankutty and Foley, 1999), the distribution of crops for 1992 (Leffet al., 2004), the pasture fraction for 1970 (Klein Goldewijk and Batjes, 1997) and the irrigated agricultural fraction for 1995 (D ¨oll
25
ESDD
4, 235–278, 2013Simulating land use effects on ecosystem
services and carbon cycling in Africa
M. Lindeskog et al.
Title Page
Abstract Introduction
Conclusions References
Tables Figures
◭ ◮
◭ ◮
Back Close
Full Screen / Esc
Printer-friendly Version Interactive Discussion
Discussion
P
a
per
|
Dis
cussion
P
a
per
|
Discussion
P
a
per
|
Discussio
n
P
a
per
|
2.3 Model experiments and evaluation
Model spin-up was for 300-yr, applying the year 1901 CO2 value and
temperature-detrended climate data for 1901–1930 in repeated cycles. In the experiments with land use functionality turned on, the 1901 cropland and pasture fractions were used for the spinup period. Cropland and pasture stands contained only one patch since stochastic
5
processes of natural vegetation establishment and mortality, or disturbances by fire or other events, are not needed for managed ecosystems.
To test the accuracy of the model to capture the seasonal vegetation greenness variation of the African continent, with and without land use functionality, modelled monthly mean Fraction of absorbed Photosynthetically Active Radiation (FPAR) was
10
compared with observed monthly maximum NDVI for the period 1982–2006. Although FPAR and NDVI are not comparable in terms of their absolute values, they can both serve as indicators of seasonally varying phenology and leaf growth dynamics. Twelve sites located in the major African crop-intensive regions, representative of the different climate seasonalities, crop types and irrigation intensities, were selected to provide a
15
significant crop-derived component to the total FPAR/NDVI levels (Table 3, Fig. 2). Standardised anomalies (zscores) of FPAR and NDVI were calculated as deviations from the population mean, divided by the standard deviation. The population was all the values of monthly data either for a given site or for the entire African continent, the latter for comparisons of seasonal fluctuation amplitudes. Distances between standardised
20
FPAR and NDVI anomalies were computed by the distance index for a site, where N=number of monthly FPAR/NDVI data pairs and Σ is the sum over all these data pairs (Eq. 1).
di=
s P
(zscore(FPAR)−zscore(NDVI))2
N (1)
A number of experiments were performed over the period 1901–2006 to investigate the
25
ESDD
4, 235–278, 2013Simulating land use effects on ecosystem
services and carbon cycling in Africa
M. Lindeskog et al.
Title Page
Abstract Introduction
Conclusions References
Tables Figures
◭ ◮
◭ ◮
Back Close
Full Screen / Esc
Printer-friendly Version Interactive Discussion
Discussion
P
a
per
|
Dis
cussion
P
a
per
|
Discussion
P
a
per
|
Discussio
n
P
a
per
|
(Table 4). These experiments were designed to investigate separately the relative con-tributions of climate change, changes in CO2 and management practices. Factorial simulations were performed, keeping CO2, land use, net climate or individual climate
drivers (temperature, precipitation, incoming shortwave radiation) at the spinup levels (see above) while varying other drivers, and compared to a simulation with all drivers
5
varying.
3 Results and discussion
3.1 Seasonal variation of vegetation greenness
Averaged over 10–15◦latitude bands covering the African continent, seasonal anoma-lies of modelled FPAR generally matched remotely sensed NDVI well, although
some-10
times preceding the NDVI variation by 1–2 months (Fig. 4). In large parts of Africa, the modelled phenology is governed directly by precipitation (Fig. 2), so the accuracy of the climate data (monthly in the present study) is critical and could be a source of error. In Africa, the density of the climate sampling network is relatively sparse in many places, and this can introduce a bias in gridded climate products, especially in
15
precipitation. A bi-seasonal pattern in NDVI evident around the equator is accurately captured by the model. An exception to the good FPAR vs. NDVI fit is seen in the 15–25◦N latitude band largely characterised by desert with only little vegetation. The data-model mismatch could reflect either NDVI artefacts caused, e.g. by seasonal at-mospheric dust clouds, or poor seasonal accuracy in the climate data for this region.
20
Adding land use functionality to LPJ-GUESS brings rather minor changes to these continental-scale seasonal FPAR patterns, reflecting the relatively small cropland frac-tion of Africa, which when averaged over the latitudinal bands does not exceed 9 % of the area (Ramankutty and Foley, 1999). Moreover, since most crop areas and pas-tures in Africa are not irrigated, the greening of natural vegetation and managed land
ESDD
4, 235–278, 2013Simulating land use effects on ecosystem
services and carbon cycling in Africa
M. Lindeskog et al.
Title Page
Abstract Introduction
Conclusions References
Tables Figures
◭ ◮
◭ ◮
Back Close
Full Screen / Esc
Printer-friendly Version Interactive Discussion
Discussion
P
a
per
|
Dis
cussion
P
a
per
|
Discussion
P
a
per
|
Discussio
n
P
a
per
|
follows rather similar patterns over the year, since in the largest part of the continent precipitation is a major determinant of crop production (Fig. 2).
When focusing on a number of locations in regions with a relatively large fraction of cropland (Table 3, Fig. 2), the difference in leaf area development over the course of a year between managed land and natural vegetation is evident (Fig. 5). The most
5
apparent deviations of LPJ-GUESS potential natural vegetation seasonal FPAR from observed NDVI are in regions where crops have replaced a natural vegetation of ev-ergreen or mixed forest, having little or no seasonal variation. Including land use func-tionality improves the fit in these areas. In our examples, this is the case in temper-ate northern (Algeria) and southern Africa (South Africa 1), subtropical East Africa
10
(Ethiopia) and tropical East Africa (Uganda and Tanzania).
At savannah locations (examples are for Senegal, Sudan and Burkina Faso) the growing season onset simulated as an increase in modelled natural vegetation FPAR is 2–3 months ahead of the increase in NDVI. Accounting for land management in the model partially reduces this difference, since the crop FPAR increase is significantly
15
delayed compared to natural vegetation and, at these locations, quite similar to the NDVI increase. In regions where natural vegetation is dominated by grasslands, in-cluding land use has little influence on the FPAR vs. NDVI fit. This is with the exception for the region in Egypt, where the modelled rainfed natural vegetation FPAR is sparse and deviates highly from the observed NDVI levels and seasonal pattern. Two distinct
20
growing periods are apparent in the NDVI seasonality, reflecting the irrigated double-cropping farming practice in the Nile delta. When including irrigated cropland in the model (Fig. 5), the maximum FPAR is increased to realistic levels but at present, the model can reproduce only a single growing season. Double-cropping capability is a high priority in future versions of the model.
25
ESDD
4, 235–278, 2013Simulating land use effects on ecosystem
services and carbon cycling in Africa
M. Lindeskog et al.
Title Page
Abstract Introduction
Conclusions References
Tables Figures
◭ ◮
◭ ◮
Back Close
Full Screen / Esc
Printer-friendly Version Interactive Discussion
Discussion
P
a
per
|
Dis
cussion
P
a
per
|
Discussion
P
a
per
|
Discussio
n
P
a
per
|
3.2 Inter-annual greeness variability 1982–2006
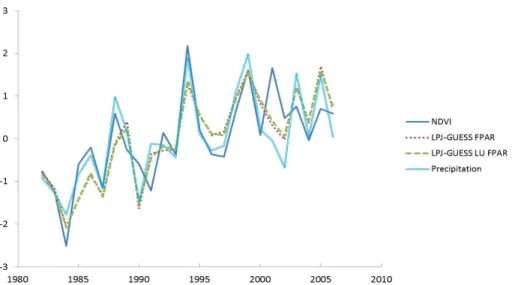
The Sahel region has been well studied with respect to recent climatic and land cover trends. Hickler et al. (2005) showed that a positive trend in satellite-measured NDVI greenness through the 1980’s and 1990’s was best explained by a positive trend in precipitation over this period. Expanding this analysis to 2002 and using a
spatially-5
explicit approach, accounting for additional regional effects of human land use, did not significantly improve agreement between modelled vegetation patterns and satellite observations (Seaquist et al., 2009). Anomalies of NDVI and FPAR simulated by our model, averaged over the Sahel rectangle (12–20◦N, 19◦W–40◦E) for the period 1982– 2006, are shown in Fig. 7. Similarly to the previous studies cited above, an overall
10
positive trend with correlated interannual variation in FPAR and NDVI are apparent and may be explained by variation in rainfall. After the late 1990s, the trend levels off, as observed before (Kaspersen et al., 2011). Inclusion of land use had only a minor effect on simulated FPAR, reflecting the low (ca. 5 %) cropland cover in the region.
3.3 Comparing modelled crop yields with FAO statistics
15
In its present configuration LPJ-GUESS aims to reproduce crop seasonal phenology as well as potential, rather than average observed yield. Modelled crop yield thus rep-resents an upper limit for a particular location given by climate and CO2, not reduced
by such factors as nutrient limitations, crop pathogens, herbivory, weeds or suboptimal farming practices. The difference between potential optimal yield and actual yield,
of-20
ten termed the yield gap, varies between different regions and countries. Large parts of Africa have the largest yield gaps in the world (Lobell et al., 2009; Licker et al., 2010). A comparison of modelled yields for the seven most important crops in Africa (by area), with FAO country-level crop yield statistics for the 1991–1995 period (Fig. 8) gener-ally reflects this with higher modelled than observed yields, but for some crops, this
25
ESDD
4, 235–278, 2013Simulating land use effects on ecosystem
services and carbon cycling in Africa
M. Lindeskog et al.
Title Page
Abstract Introduction
Conclusions References
Tables Figures
◭ ◮
◭ ◮
Back Close
Full Screen / Esc
Printer-friendly Version Interactive Discussion
Discussion
P
a
per
|
Dis
cussion
P
a
per
|
Discussion
P
a
per
|
Discussio
n
P
a
per
|
Modelled yields of the two major African crops, maize and millet, were almost always higher than reported yields, typically by factors ranging from 2-6. In previous yield gap assessments for maize in Africa, this factor ranged from 2 to 8 (Pingali and Pandey, 2001; Lobell et al., 2009). Estimates from western Kenya of potential and actual maize yields were 3.7 and 1.7 ton ha−1, respectively (Tittonell et al., 2008) while our results
5
show modelled vs. reported maize yields for Kenya of 3.4 and 1.8 ton ha−1, respectively. Combining statistical, GIS, socio-economic and methodology of agroecological zones for large regions of the continent, You et al. (2009) have estimated 3.5–5 ton ha−1 as potential yields from rainfed, high-input maize. Modelling potential optimal millet yields in the Sahel region with the ORCHIDEE DGVM, Berg et al. (2011) obtained 2–5 times
10
higher yields than FAO reported yields. For pulses, the relationship between modelled vs. reported yields could be separated into different regions, with one group consisting of Sahel countries with a low modelled yield of up to 1 ton ha−1, a second group con-taining the majority of countries (mostly tropical) with a modelled yield of 2–4 ton ha−1, and a third small group of countries (Morocco, Tunisia, Egypt and Lesotho), with a
15
modelled yield of 7–9 ton ha−1 (Fig. 8). With the exception of Egypt, probably because of irrigation, the reported yield was only up to 1 ton ha−1, resulting in large differences in estimated yield gaps for the three groups.
Reported yields exceeded modelled yields for some crops (e.g. peanut) in a few re-gions, e.g. the Sahel, possibly reflecting poor yield statistics or climate data for that
20
region (see the discussion on FAO statistics in the Sahel in Berg et al. (2011)). Mod-elled low or zero yield for wheat is explained by the set upper temperature limit for wheat cultivation in the model (see Methods). Cassava shows a very poor correlation between modelled and reported yield. Cassava is mainly grown in regions with little climate variability, suggesting that non-climatic factors, not represented by our model,
25
may explain the reported variation in reported yields.
ESDD
4, 235–278, 2013Simulating land use effects on ecosystem
services and carbon cycling in Africa
M. Lindeskog et al.
Title Page
Abstract Introduction
Conclusions References
Tables Figures
◭ ◮
◭ ◮
Back Close
Full Screen / Esc
Printer-friendly Version Interactive Discussion
Discussion
P
a
per
|
Dis
cussion
P
a
per
|
Discussion
P
a
per
|
Discussio
n
P
a
per
|
In addition to the known uncertainties in climate input and reported yield statis-tics (Hall, 1984), irrigation fractions are currently only rough estimates for each crop (cf. Bondeau et al., 2007). Unsurprisingly, irrigation can increase simulated yields sub-stantially, but modelled rainfed crop yields also exceed reported yields in most coun-tries (Fig. 9a). The irrigated area in Africa is well below 5 % of the crop area (You et
5
al., 2009), but whether large scale irrigation will be feasible in African regions as an adaptive measure to mitigate climate change impacts depends on future economic development (Liu et al., 2008; Ziervogel et al., 2008).
3.4 Modelling carbon fluxes of natural vegetation, pasture and croplands
NECB simulated for 1901–2006 with and without representations of cropland, pasture
10
and land use change and under alternative management options – expected to alter the carbon balance – is shown in Fig. 10. Potential natural vegetation was estimated to accrue 29.2 PgC from the atmosphere during this period for Africa as a whole. When land use was accounted for, this sink was reduced to 20.9 PgC. Land use change ac-counted for a 4.4 PgC flux to the atmosphere (Fig. 11a), while the rest of the reduction
15
(3.9 PgC) was due to the differential carbon uptake of the simulated potential natural vegetation and managed land (at the 1901 cover). Alternative cropland management options had a large effect on the carbon balance, as has previously been suggested e.g. by Lal (2002). When 100 % crop residue removal was assumed, the carbon sink was reduced by 1.8 PgC compared to no removal. Grass cover crop growth added 1.6
20
PgC to the sink compared to no cover crop (Fig. 10). In our model, alternative cropping practices thus had the potential to influence the biosphere-atmosphere carbon balance to a comparable degree to land use change, underlining the need for valid characteri-sation of land management practices in models as well as good estimates of land cover change per se.
25
ESDD
4, 235–278, 2013Simulating land use effects on ecosystem
services and carbon cycling in Africa
M. Lindeskog et al.
Title Page
Abstract Introduction
Conclusions References
Tables Figures
◭ ◮
◭ ◮
Back Close
Full Screen / Esc
Printer-friendly Version Interactive Discussion
Discussion
P
a
per
|
Dis
cussion
P
a
per
|
Discussion
P
a
per
|
Discussio
n
P
a
per
|
increased greenhouse gas emissions, raising the production enhancement of vegeta-tion due to atmospheric [CO2] (McGuire et al., 2001; Le Qu ´er ´e et al., 2009; Ahlstr ¨om et al., 2012b). Similar global transient responses were obtained by Bondeau et al. (2007). In our simulation, the African continent turned from being neutral to being a carbon sink already around 1950 (Fig. 10). The earlier transition to carbon uptake for the African
5
continent, compared to global patterns, may be attributed to the continent’s lower de-forestation rates in the 20th century, compared to other regions (e.g. South America) (Ciais et al., 2009). Short episodes of carbon release in the 1940s and 1980s corre-lated with periods of relatively warm and dry climate, conditions under which reduced plant production tends to coincide with increased heterotrophic respiration and wildfire
10
biomass burning in the model (Fig. 11b).
The modelled African continent NECB averages for the periods 1980–1989, 1990– 1999 and 2000–2005 were 0.17,−0.37 and −0.80 PgC yr−1, respectively, when land use was accounted for. The change from a carbon source in the 1980s to a sink in the 1990s for African vegetation was also seen by Ciais et al. (2009), modelling land
15
use change using the vegetation model ORCHIDEE (0.14 and−0.15 PgC yr−1, respec-tively). The land use change component of the NECB for the 1980s was 0.09 PgC yr−1. Previous studies using the same historical cropland fraction data as in this study (Ra-mankutty and Foley, 1999), with two different vegetation/carbon cycle models, pro-duced similar land use change-derived carbon fluxes for the 1980s, 0.08 PgC yr−1
20
for tropical Africa (Jain and Yang, 2005) and 0.08 PgC yr−1 for the continent as a whole (Ciais et al., 2009). A book-keeping model of vegetation-atmosphere carbon fluxes with land use change input based on deforestation rates produced either similar (0.09 PgC yr−1 for 1984–1990, DeFries et al., 2002) or higher (0.3 PgC yr−1 for 1980– 1989, Houghton, 2003) results for tropical Africa, depending on the input data. The
25
ESDD
4, 235–278, 2013Simulating land use effects on ecosystem
services and carbon cycling in Africa
M. Lindeskog et al.
Title Page
Abstract Introduction
Conclusions References
Tables Figures
◭ ◮
◭ ◮
Back Close
Full Screen / Esc
Printer-friendly Version Interactive Discussion
Discussion
P
a
per
|
Dis
cussion
P
a
per
|
Discussion
P
a
per
|
Discussio
n
P
a
per
|
and Foley (1999) land cover data to drive LPJ-mL, resulted in global carbon fluxes much more in agreement with estimates based on book-keeping (Bondeau et al., 2007; Houghton 2003).
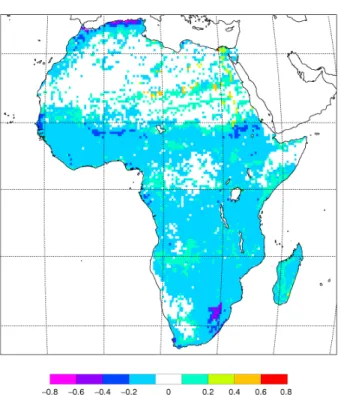
With respect to geographic location, African regions with a large fraction of managed land generally had similar 1961–1990 average annual NECB compared to potential
5
natural vegetation, but some cropland-intensive areas in East Africa had NECB-values up to 0.28 kg C m−2yr−1higher with land use taken into account (Fig. 12a). Part of this is due to a land use change-derived CO2release to the atmosphere (up to 0.22 kg C m−2 yr−1) (Fig. 12b). CO2 capture by abandoned cropland in Africa during this period is
minimal, since this area is very small.
10
The results from factorial driver simulations, shown in Fig. 11, suggest that CO2 fertil-isation had a greater influence on African NECB (−32.5 PgC for the period 1901–2006 than climate change (+8.5 PgC), land use change (+4.4 PgC) or alternative cropland management (up to 2.9 PgC). However, there are many discussions on the CO2 fertili-sation effect (Long et al., 2006; Tubiello et al., 2007), leading to some uncertainties on
15
the capabilities of DGVMs to correctly account for it. For the 1980s, the relationship be-tween CO2and land use change was similar (−0.5 and +0.09 PgC yr−1respectively), but the relative contribution of climate was much higher (+0.6 PgC yr−1). Separating the climate components, temperature and precipitation both contributed to a net flux to the atmosphere when synchronised, as in the warm and dry 1980–1996 period. After 1996,
20
precipitation shows a positive trend, resulting in a net carbon uptake by the vegetation, overriding the negative, evapotranspiration-mediated effect of rising temperatures on ecosystem productivity.
4 Conclusions
We demonstrate the implications of introducing dynamic land management and land
25
ESDD
4, 235–278, 2013Simulating land use effects on ecosystem
services and carbon cycling in Africa
M. Lindeskog et al.
Title Page
Abstract Introduction
Conclusions References
Tables Figures
◭ ◮
◭ ◮
Back Close
Full Screen / Esc
Printer-friendly Version Interactive Discussion
Discussion
P
a
per
|
Dis
cussion
P
a
per
|
Discussion
P
a
per
|
Discussio
n
P
a
per
|
variation of vegetation cover in African regions with a high cropland area fraction was improved by accounting for land use and that the modelled crop yields, representing potential optimal yields, were in most cases in line with reported yields and correspond-ing yield gaps, when these were available. Land-atmosphere carbon balance estimates over Africa were changed significantly by introducing land use to the model, suggesting
5
that the anthropogenic influence on vegetation cover and dynamics is important to con-sider in studies of the regional carbon balance, even in this region where anthropogenic impacts on landscapes are arguably only moderate by world standards.
The results demonstrate the applicability of land use-enabled DGVMs to assessing the individual and combined impacts of climate, management and land use policy on
10
regional carbon balances and ecosystem services such as agricultural production. As a process-based model with a uniquely detailed implementation of vegetation dynamics, LPJ-GUESS should prove useful particularly for applications under scenarios of the future world, in which environmental conditions without modern analogues may break empirical relationships between drivers and outcomes of ecosystem functioning.
15
Improvements to the model currently under development include soil and vegetation nitrogen cycling and N-limits on plant production, which should benefit the modelling of both crop production and vegetation succession of abandoned cropland, especially on tropical soils with low nutrient status. For applications to Africa, refined land cover and climate (especially precipitation) input data may be expected to improve the accuracy
20
and utility of the model.
Acknowledgements. This study was funded by the Foundation for Strategic Environmental
Re-search (Mistra) under the Mistra-SWECIA programme and by the Formas Strong ReRe-search Environment Land Use Today and Tomorrow. The study is a contribution to the European Union Seventh Framework Programme project ClimAfrica (FP7-ENV-2009-1, 244240) and to
25
ESDD
4, 235–278, 2013Simulating land use effects on ecosystem
services and carbon cycling in Africa
M. Lindeskog et al.
Title Page
Abstract Introduction
Conclusions References
Tables Figures
◭ ◮
◭ ◮
Back Close
Full Screen / Esc
Printer-friendly Version Interactive Discussion
Discussion
P
a
per
|
Dis
cussion
P
a
per
|
Discussion
P
a
per
|
Discussio
n
P
a
per
|
References
Ahlstr ¨om, A., Miller, P. A., and Smith, B.: Too early to infer a global NPP decline since 2000, Geophys. Res. Lett., 39, L15403, doi:10.1029/2012GL052336, 2012a.
Ahlstr ¨om, A., Schurgers, G., Arneth, A., and Smith, B.: Robustness and uncertainty in terrestrial ecosystem carbon response to CMIP5 climate change projections, Environ. Res. Lett., 7,
5
0440082012b, doi:10.1088/1748-9326/7/4/044008, 2012b.
Ainsworth, E. A. and Long, S. P.: What have we learned from 15 years of free-air CO2 enrich-ment (FACE)? A meta-analytic review of the responses of photosynthesis, canopy properties and plant production to rising CO2, New Phytol., 165, 351–371, 2005.
Arneth, A., Sitch, S., Bondeau, A., Butterbach-Bahl, K., Foster, P., Gedney, N., de
Noblet-10
Ducoudr ´e, N., Prentice, I. C., Sanderson, M., Thonicke, K., Wania, R., and Zaehle, S.: From biota to chemistry and climate: towards a comprehensive description of trace gas exchange between the biosphere and atmosphere, Biogeosciences, 7, 121–149, doi:10.5194/bgd-6-7717-2009, 2010a.
Arneth, A., Harrison, S. P., Zaehle, S., Tsigaridis, K., Menon, S., Bartlein, P. J., Feichter,
15
J., Korhola, A., Kulmala, M., O’Donnell, D., Schurgers, G., Sorvari, S., and Vesala, T.: Terrestrial biogeochemical feedbacks in the climate system, Nat. Geosci., 3, 525–532, doi:510.1038/ngeo1905, 2010b.
Arora, V. K. and Montenegro, A.: Small temperature benefits provided by realistic afforestation efforts, Nat. Geosci., 4, 514–518, doi:510.1038/ngeo1182, 2011.
20
Berg, A., Sultan, B., and de Noblet-Ducoudr ´e, N.: Including tropical croplands in a terres-trial biosphere model: application to West Africa, Climatic Change, 104, 755–782–782, doi:10.1007/s10584-010-9874-x, 2011.
Bombelli, A., Henry, M., Castaldi, S., Adu-Bredu, S., Arneth, A., de Grandcourt, A., Grieco, E., Kutsch, W. L., Lehsten, V., Rasile, A., Reichstein, M., Tansey, K., Weber, U., and Valentini,
25
R.: An outlook on the Sub-Saharan Africa carbon balance, Biogeosciences, 6, 2193–2205, doi:10.5194/bg-6-2193-2009, 2009.
Bondeau, A., Smith, P. C., Zaehle, S., Schaphoff, S., Lucht, W., Cramer, W., Gerten, D., Lotze-Campen, H., M ¨uller, C., Reichstein, M., and Smith, B.: Modelling the role of agriculture for the 20th century global terrestrial carbon balance, Global Change Biol., 13, 679–706,
30
ESDD
4, 235–278, 2013Simulating land use effects on ecosystem
services and carbon cycling in Africa
M. Lindeskog et al.
Title Page
Abstract Introduction
Conclusions References
Tables Figures
◭ ◮
◭ ◮
Back Close
Full Screen / Esc
Printer-friendly Version Interactive Discussion
Discussion
P
a
per
|
Dis
cussion
P
a
per
|
Discussion
P
a
per
|
Discussio
n
P
a
per
|
Brovkin, V., Sitch, S., von Bloh, W., Claussen, M., Bauer, E., and Cramer, W.: Role of land cover changes for atmospheric CO2increase and climate change during the last 150 years, Global Change Biol. 10, 1253–1266, doi:10.1111/j.1365-2486.2004.00812.x, 2004.
Ciais, P., Piao, S.-L., Cadule, P., Friedlingstein, P., and Ch ´edin, A.: Variability and recent trends in the African terrestrial carbon balance, Biogeosciences, 6, 1935–1948,
doi:10.5194/bg-6-5
1935-2009, 2009.
DeFries, R. S., Houghton, R. A., Hansen, M. C., Field, C. B., Skole, D., and Town-shend, J.: Carbon emissions from tropical deforestation and regrowth based on satel-lite observations for the 1980s and 1990s, Proc. Natl. Acas. Sci., 99, 14256–14261, doi:10.1073/pnas.182560099, 2002.
10
de Noblet-Ducoudr ´e, N., Gervois, S., Ciais, P., Viovy, N., Brisson, N., Seguin, B., and Perrier, A.: Coupling the Soil-Vegetation-Atmosphere-Transfer Scheme ORCHIDEE to the agronomy model STICS to study the influence of croplands on the European carbon and water budgets, Agronomie, 24, 397–407, doi:10.1051/agro:2004038, 2004.
Doherty, R. M., Sitch, S., Smith, B., Lewis, S. L., and Thornton, P. K.: Implications of
fu-15
ture climate and atmospheric CO2 content for regional biogeochemistry, biogeography and ecosystem across East Africa, Global Change Biol., 16, 617–640, doi:10.1111/j.1365-2486.2009.01997.x, 2010.
D ¨oll, P. and Siebert, S.: A digital global map of irrigated areas-documentation, University of Kassel, Kassel, 1999.
20
Foley, J. A., DeFries, R., Asner, G. P., Barford, C., Bonan, G., Carpenter, S. R., Chapin, F. S., Coe, M. T., Daily, G. C., Gibbs, H. K., Helkowski, J. H., Holloway, T., Howard, E. A., Kucharik, C. J., Monfreda, C., Patz, J. A., Prentice, I. C., Ramankutty, N., and Snyder, P. K.: Global consequences of land use, Science, 309, 570–574, doi:10.1126/science.1111772, 2005. Friend, A. D., Arneth, A., Kiang, N.Y., Lomass, M., Og ´ee, J., R ¨odenbeck, C., Running, S.
25
W., Santaren, J.-D., Sitch, S., Viovy, N., Woodward, F. I., and Zaehle, S.: FLUXNET and modelling the global carbon cycle, Global Change Biol., 13, 610–633, doi:10.1111/j.1365-2486.2006.01223.x, 2007.
Gerten, D., Schaphoff, S., Haberlandt, U., Lucht, W., and Sitch, S.: Terrestrial vegetation and water balance-hydrological evaluation of a dynamic global vegetation model, J. Hydrol. 286,
30
249–270, doi:10.1016/j.jhydrol.2003.09.029, 2004.
ESDD
4, 235–278, 2013Simulating land use effects on ecosystem
services and carbon cycling in Africa
M. Lindeskog et al.
Title Page
Abstract Introduction
Conclusions References
Tables Figures
◭ ◮
◭ ◮
Back Close
Full Screen / Esc
Printer-friendly Version Interactive Discussion
Discussion
P
a
per
|
Dis
cussion
P
a
per
|
Discussion
P
a
per
|
Discussio
n
P
a
per
|
Hall, P.: The poor quality of official socio-economic statistics relating to the rural tropical world: with special reference to south India, Mod. Asian Stud., 18, 491–514, 1984.
Hansen, M. C., Defries, R. S., Townshend, J. R. G., and Sohlberg, R.: Global land cover classi-fication at 1 km spatial resolution using a classiclassi-fication tree approach, Int. J. Remote Sens., 21, 1331–1364, 2000.
5
H ´ely, C., Bremond, L., Alleaume, S., Smith, B., Sykes, M. T., and Guiot, J.: Sensitivity of African biomes to changes in the precipitation regime, Global Ecol. Biogeogr., 15, 258–270, doi:10.1111/j.1466-822x.2006.00235.x, 2006.
Heywood, V. H. (Ed.): Global biodiversity assessment, United nations environment programme, Cambridge university press, Cambridge, 1995.
10
Hickler, T., Smith, B., Sykes, M. T., Davis, M. B., Sugita, S., and Walker, K.: Using a generalized vegetation model to simulate vegetation dynamics in the western Great Lakes region, USA, under alternative disturbance regimes, Ecology, 85, 519–530, 2004.
Hickler, T., Eklundh, L., Seaquist, J. W., Smith, B., Ard ¨o, J., Olsson, L., Sykes, M. T., and Sj ¨ostr ¨om, M.: Precipitation controls Sahel greening trend, Geophys. Res. Lett., 32, L21415,
15
doi:10.1029/2005GL024370, 2005.
Hickler, T., Prentice, I. C., Smith, B., Sykes, M. T., and Zaehle, S.: Implementing plant hydraulic architecture within the LPJ Dynamic Global Vegetation Model, Global Ecol. Biogeogr., 15, 567–577, doi:10.1111/j.1466-8238.2006.00254.x, 2006.
Hidy, D., Barcza, Z., Haszpra, L., Churkina, G., Pinter, K., and Nagy, Z.: Development of the
20
Biome-BGC model for simulation of managed herbaceous ecosystems, Ecol. Model., 226, 99–119, doi:10.1016/j.ecolmodel.2011.11.008, 2012.
Holben, B. N.: Characteristics of maximum-value composite images from temporal AVHRR data, Int. J. Remote Sens., 7, 1417–1437, doi:10.1080/01431168608948945, 1986.
Houghton, R. A.: Revised estimates of the annual net flux of carbon to the atmosphere
25
from changes in land use and land management 1850–2000, Tellus, 55B, 378–390, doi:10.1034/j.1600-0889.2003.01450.x, 2003.
Houghton, R. A., Hobbie, J. E., Melillo, J. M., Moore, B., Peterson, B. J., Shaver, G. R., and Woodwell, G. M.: Changes in the carbon content of terrestrial biota and soils between 1860 and 1980: a net release of CO2to the atmosphere, Ecol. Monogr., 53, 235–262, 1983.
30
ESDD
4, 235–278, 2013Simulating land use effects on ecosystem
services and carbon cycling in Africa
M. Lindeskog et al.
Title Page
Abstract Introduction
Conclusions References
Tables Figures
◭ ◮
◭ ◮
Back Close
Full Screen / Esc
Printer-friendly Version Interactive Discussion
Discussion
P
a
per
|
Dis
cussion
P
a
per
|
Discussion
P
a
per
|
Discussio
n
P
a
per
|
Jain, A. K. and Yang, X.: Modeling the effects of two different land cover change data sets on the carbon stocks of plants and soils in concert with CO2 and climate change, Global Biogeochem. Cy., 19, GB2015, doi:10.1029/2004GB002349, 2005.
Kaspersen, P. S., Fensholt, R., and Huber, S.: A spatiotemporal analysis of climatic drivers for observed changes in Sahelian vegetation productivity (1982–2007), Int. J. Geophys., 2011,
5
715321, doi:10.1155/2011/715321, 2011.
Klein Goldewijk, K. and Battjes, J. J.: A hundred year (1890–1990) database for integrated environmental assessments (HYDE, version 1.1), National institute of public health and the environment (RIVM), Bilthoven, The Netherlands, 1997.
Klein Goldewijk, L., Beusen, A., van Drecht, G., and de Vos, M.: The HYDE 3.1 spatially explicit
10
database of human-induced global land.use change over the past 12,000 years, Global Ecol. Biogeogr., 20, 73–86, doi:10.1111/j.1466-8238.2010.00587.x, 2011.
Kucharik, C. J. and Brye, K. R.: Integrated biosphere simulator (IBIS) yield and nitrate loss predictions for Wisconsin maize receiving varied amounts of nitrogen fertilizer, J. Environ. Qual., 32, 247–268, 2003.
15
Kucharik, C. J. and Twine, T. E.: Residue, respiration, and residuals: Evaluation of a dynamic agroecosystem model using eddy flux measurements and biometric data, Agr. Forest Mete-orol., 146, 134–158, doi:10.1016/j.agrformet.2007.05.011, 2007.
Lal, R.: Carbon sequestration in dryland ecosystems of West Asia and North Africa, Land Degrad. Dev., 13, 45–59, doi:10.1002/ldr.477, 2002.
20
Leff, B., Ramankutty, N., and Foley, J. A.: Geographic distribution of major crops across the world, Global Biogeochem. Cy., 18, GB1009, doi:10.1029/2003GB002108, 2004.
Lehsten, V., Tansey, K., Balzter, H., Thonicke, K., Spessa, A., Weber, U., Smith, B., and Ar-neth, A.: Estimating carbon emissions from African wildfires, Biogeosciences, 6, 349–360, doi:10.5194/bg-6-349-2009, 2009.
25
Le Qu ´er ´e, C., Raupach, M. R., Canadell, J.G., Marland, G., Bopp, L., Ciais, P., Conway, T. J., Doney, S. C., Feely, R. A., Foster, P., Friedlingstein, P., Gurney, K., Houghton, R. A., House, J. I., Huntingford, C., Levy, P. E., Lomas, M. R., Majkut, J., Metzl, N., Ometto, J. P., Peters, G. P., Prentice, I. C., Randerson, J. T., Running, S. W., Sarmiento, J. L., Schuster, U., Sitch, S., Takahashi, T., Viovy, N., van der Werf, G. R., and Woodward, F. I.: Trends in the sources and
30
sinks of carbon dioxide, Nat. Geosci., 2, 831–836, doi:10.1038/ngeo689, 2009.
ESDD
4, 235–278, 2013Simulating land use effects on ecosystem
services and carbon cycling in Africa
M. Lindeskog et al.
Title Page
Abstract Introduction
Conclusions References
Tables Figures
◭ ◮
◭ ◮
Back Close
Full Screen / Esc
Printer-friendly Version Interactive Discussion
Discussion
P
a
per
|
Dis
cussion
P
a
per
|
Discussion
P
a
per
|
Discussio
n
P
a
per
|
N., Feldpausch, T. R., Hamilton, A. L., Gloor, M., Hart, T., Hladik, A., Lloyd, J., Lovett, J. C., Makana, J. R., Malhi, Y., Mbago, F. M., Ndangalasi, H. J., Peacock, J., Peh, K. S. H., Sheil, D., Sunderland, T. C. H., Swaine, M. D., Taplin, J., Taylor, D., Thomas, S. C., Votere, R., and Woll, H.: Increasing carbon storage in intact African tropical forests, Nature, 457, 1003–1006, doi:10.1038/nature07771, 2009.
5
Licker, R., Johnston, M., Foley, J. A., Barford, C., Kucharik, C. J., Monfreda, C., and Ramankutty, N.: Mind the gap: how do climate and agricultural management explain the yield gap of croplands around the world?, Global Ecol. Biogeogr., 19, 769–782, doi:10.1111/j.1466-8238.2010.00563.x, 2010.
Liu, J., Fritz, S., van Wesenbeeck, C. F. A., Fuchs, M., You, L., Obersteiner, M., and Yang,
10
H.: A spatially explicit assessment of current and future hotspots of hunger in Sub-Saharan Africa in the context of global change, Global Planet. Change, 64, 222–235, doi:10.1016/j.gloplacha.2008.09.007, 2008.
Lobell, D. B., Cassman, K. G., and Field, C. B.: Crop yield gaps: their im-portance, magnitudes and causes, Annu. Rev. Env. Resour., 34, 179–204,
15
doi:10.1146/annurev.environ.041008.093740, 2009.
Long, S. P., Ainsworth, E. A., Leakey, A. D. B., N ¨osberger, J., and Ort D. R.: Food for thought: lower-than-expected crop yield stimulation with rising CO2 concentrations, Science, 312, 1918–1921, doi:10.1126/science.1114722, 2006.
McGuire, A. D., Sitch, S., Clein, J. S., Dargaville, R., Esser, G., Foley, J., Heimann, M., Joos,
20
F., Kaplan, J., Kicklighter, D. W., Meier, R. A., Melillo, J. M., Moore III, B., Prentice, I. C., Ramankutty, N., Reichenau, T., Schloss, A., Tian, H., Williams, L. J., and Wittenberg, U.: Carbon balance of the terrestrial biosphere in the twentieth century: Analyses of CO2, climate and land use effects with four process-based ecosystem models, Global Biogechem. Cy., 15, 183–206, doi:10.1029/2000GB001298, 2001.
25
Millennium Ecosystem Assessment: Ecosystems and Human Well-being: Synthesis, World Re-sources Institute, 2005.
Mitchell, T. D. and Jones, P. D.: An improved method of constructing a database of monthly climate observations and associated high-resolution grids, Int. J. Climatol., 25, 693–712, doi:10.1002/joc.1181, 2005.
30
ESDD
4, 235–278, 2013Simulating land use effects on ecosystem
services and carbon cycling in Africa
M. Lindeskog et al.
Title Page
Abstract Introduction
Conclusions References
Tables Figures
◭ ◮
◭ ◮
Back Close
Full Screen / Esc
Printer-friendly Version Interactive Discussion
Discussion
P
a
per
|
Dis
cussion
P
a
per
|
Discussion
P
a
per
|
Discussio
n
P
a
per
|
carbon and water fluxes in major European forest biomes, Glob. Change Biol., 11, 2211– 2233, doi:10.1111/j.1365-2486.2005.01036.x, 2005.
M ¨uller, C., Bondeau, A., Popp, A., Waha, K., and Fader, M.: Climate change impacts on agri-cultural yields, Potsdam Institute for Climate Impact Research (PIK). Background note for the World Development Report 2010. Contribution to the World Development Report 2010:
5
Development and Climate Change, The World Bank, Washington, DC, 2009.
M ¨uller, C., Cramer, W., Hare, W. L., and Lotze-Campen, H.: Climate change risks for African agriculture, Proc. Natl. Acad. Sci., 108, 4313–4315, doi:10.1073/pnas.1015078108, 2011. Piao, S., Sitch, S., Ciais, P., Friedlingstein, P., Peylin, P., Wang, X., Ahlstr ¨om, A., Alessandro,
A., Canadell, J. G., Huntingford, C., Jung, M., Levis, S., Levy, P. E., Lomas, M. R., Luo, Y.,
10
Myneni, R. B., Poulter, B., Viovy, N., Zaehle, S., and Zeng, N.: A Evaluation of terrestrial carbon cycle models for their sensitivity to climate changes and rising atmospheric CO2 concentration, Glob. Change Biol., accepted, 2013.
Pingali, P. L. and Pandey, S.: Meeting world maize needs: technological opportunities and pri-orities for the public sector, in: CIMMYT 1999/2000 World maize facts and trends. Meeting
15
world maize needs: technological opportunities and priorities for the public sector, edited by: Pingali, P. L., CIMMYT, Mexico, 1–24, 2001.
Pitman, A. J., de Noblet-Ducoudr ´e, N., Cruz, F. T., Davin, E. L., Bonan, G. B., Brovkin, V., Claussen, M., Delire, C., Ganzeveld, L., Gayler, V., van den Hurk, B. J. J. M., Lawrence, P. J., van der Molen, M. K., M ¨uller, C., Reick, C. H., Seneviratne, S. I., Strengers,
20
B. J., and Voldoire, A.: Uncertainties in climate responses to past land cover change: First results from the LUCID intercomparison study, Geophys. Res. Lett., 36, L14814, doi:10.1029/2009GL039076, 2009.
Ramankutty, N. and Foley, J. A.: Estimating historical changes in global land cover: croplands from 1700 to 1992, Global Biogechem. Cy., 13, 997–1028, doi:10.1029/1999GB900046,
25
1999.
Roudier, P., Sultan, B., Quirion, P., and Berg, A.: The impact of future climate change on West African crop yields: what does the recent literature say?, Global Environ. Change 21, 1073– 1083, doi:10.1016/j.gloenvcha.2011.04.007, 2011.
Rowhani, P., Lobell, D. B., Linderman, M., and Ramankutty, N.: Climate
vari-30