Pre-Processing Effects for Limited CSI Feedback in
Scheduling Algorithms Using Cross-Layer Issues
Cibelly Azevedo de Ara ´ujo
∗, Charles Casimiro Cavalcante and Walter da C. Freitas Jr
Abstract— In this paper we introduce a new Pre-Processing Method (PPM) and we observe its impact in scheduling algorithms. We also suggest a Cumulative Distribution Function (CDF) curve of Signal-to-Noise Ratio (SNR) of the scheduled users. This CDF curve reflects characteristics of application and information about scheduling policies. Based on these curves, thresholds are defined in order to avoid reporting of unnecessary Channel State Information (CSI). This saving of resources is very important when dealing with limited feedback that may limit the system performance/capacity. Simulation results confirm the potential of the proposal.
Keywords— scheduling policies, physical layer, cross-layer, channel state information.
I. INTRODUCTION
The Open Systems Interconnection (OSI) protocol
model is a well-accepted framework for communication
systems which are decomposed into seven protocol
layers
(physical-link-network-transport-session-presentation-application) and each one is responsible for a subset of the system operation functions. Each protocol layer communicates only with the layers directly above or below it. Thus, they are usually evolved independently and considerable research efforts have been done for improving the efficiency of individual protocol layers [1], [2].
Future Fourth Generation (4G) networks must support high data rates applications with heterogeneous and variable Quality of Service (QoS) parameters and demand a high flexibility of involved protocol layers. Cross-layer design [3] refers to protocol design done by actively exploiting the dependence between protocol layers to obtain performance gains. This is unlike with OSI protocol model, where each layer is designed independently from another. Several publications have investigated the benefits in systems with cross-layer policies [1], [2], [8], [9]. A very common problem to be solved, in wireless systems, is predict the radio channel and combat wireless link impairments [6]. Physical layer (PHY) continuously generates detailed information about the current radio channel conditions, that we called it by Channel State Information (CSI). Therefore, CSI can be used to solve this explained problem.
Orthogonal Frequency Division Multiplexing (OFDM) transmission technique has gained a lot of attention in part
* This student is supported by a scholarship granted by FUNCAP. Cibelly Azevedo de Ara´ujo, Charles Casimiro Cavalcante and Walter da C. Freitas Jr are with the Wireless Telecommunication Research Group (GTEL)/Universidade Federal do Cear´a - UFC. Emails:{cibelly, charles, walter}@gtel.ufc.br. This work was supported by a grant from Ericsson of Brazil - Research Branch under ERBB/UFC.19 technical cooperation contract.
due to its facilities to inform the CSI from the mobile station to the base station. OFDM is an evolved form of multicarrier transmission where a single high-speed data stream is transmitted over a number of lower-rate subcarriers [5]. OFDM also has a number of unique features that makes it an attractive choice such as robustness against multipath fading and intersymbol interference.
Besides these OFDM advantages, we can observe a new problem: the greater is the number of subcarriers, the greater is the correspondent feedback required. However, a very common issue in the upcoming wireless systems is the ability of working with a very limited amount of feedback information. This is a very limiting aspect of the system and is a growing research topic nowadays.
Cross-layer optimization can be performed in a number of ways. The choice of the involved layers and the metric are key aspects on such task. In our case, we aim to observe the joint optimization on the PHY and Medium Access Control (MAC) layers. Then, the scheduling problem is a well-adapted scenario for the choice of the most suitable parameters for PHY and MAC jointly. In this paper, we have simulated some system-level interactions to obtain a Cumulative Distribution Function (CDF) curve from Signal-to-Noise Ratio (SNR) values owned by scheduled users. This curve is used as a cross-layer issue in order to avoid the unnecessary feedback. We propose a new Pre-Processing Method (PPM) to help at the selection of SNR to be reported.
The rest of the paper is organized as follows. We use a single-cell system model that will be explained in further details in Section II. Section III is devoted to describe the main characteristics of the used scheduling algorithms. Then, the proposal method will be presented in Section IV. The quantitative results for the applied PPM are presented and compared in Section V. Finally, Section VI summarizes the main obtained goals with some conclusive remarks.
II. SYSTEMARCHITECTURE
We assume a single-cell system where one base station
can transmit to I mobile users. As an Orthogonal Frequency
Multiple Access (OFDMA) system, the cell sprectum W is
splitted into a set ofN subcarriers. The number of subcarriers (N) is chosen sufficiently large to permit that each subcarrier can be seen as an individual flat fading channel. Thus,
subcarriers are modeled as N flat Rayleigh fading channels
with correlation in time and frequency domains.
A number ofLOFDM symbols were simulated. In order to
that each subcarrier would be assigned only to one user. Each user is modeled with full data buffer using Non-Real Time (NRT) services with different data rate requirements. Eachi-th mobile user has knowledge of his own complex channel gain
Hi(n)on then-th subcarrier and can transmit, instantaneously, its CSI to the base station. The SNR per subcarrier ρi(n) is defined as [8]:
ρi(n) =
|Hi(n)|2·p
ηi(n)
, (1)
wherepis the subcarrier transmit power, which is considered
to be equal in all N subcarriers and ηi(n) represents the
Additive White Gaussian Noise (AWGN) power density
function of user i. The SNR ρi(n) is used as a quality
measure and it is reported to the base station to perform the resource allocation algorithms, such as subcarrier allocation and adaptive modulation.
The possible transmit data rate ci(n)of thei-th user at the
n-th subcarrier is given by [9]
ci(n) =w·log2[1 +βρi(n)], (2)
where w is the subcarrier bandwidth and β is the SNR gap
for the system Bit Error Rate (BER) requirements defined as [9]
β=− 1.5
ln(5·BER). (3)
.
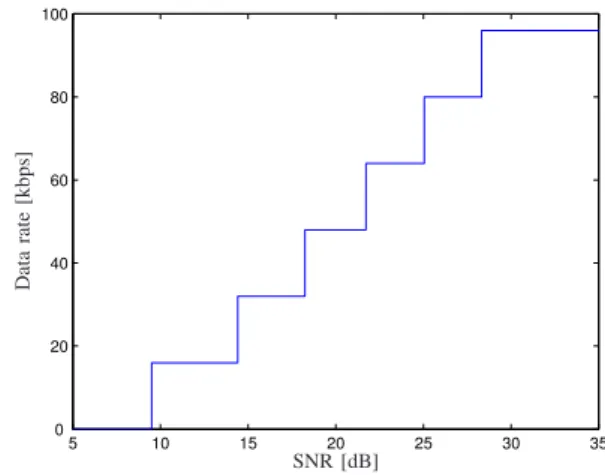
In order to use finite modulation schemes, a variableM-ary Quadrature Amplitude Modulation (QAM) with modulation
levels M = 2m
(m = 1,2,3,4,5and6) is employed. In Figure 1, we can observe that the link adaptation scheme is composed of steps, which represent transitions between data
rates. Each transition SNR value is called M-QAM SNR
threshold, ρM−QAMth, and its correspondent available data rates,cM−QAMth. For matching the possible transmit data rates to the available data rates, it is done a comparison between
the user SNR per subcarrier ρi(n), and the M-QAM SNR
thresholdρM−QAMth, as it showed in the Algorithm 1.
Algorithm 1 Pseudo-Code of the comparison between SNR values
if ρi(n)< ρ2−QAMth then
ci(n) = 0(no transmission)
end if
if ρi(n)> ρ64−QAMth then
ci(n) =c64−QAMth
end if
if ρM−QAMth ≤ρi(n)≤ρ(M+1)−QAMth then
ci(n) =cM−QAMth
end if
Let X indicates the binary assignment matrix which
elements xi(n)are defined as
xi(n) =
1, if subcarrier nis assigned to useri
0, otherwise. (4)
Hence, ri is the data rate of user i, defined as:
ri(X) = N
X
n=1
ci(n)·xi(n). (5)
5 10 15 20 25 30 35
0 20 40 60 80 100
SNR [dB]
D
at
a
ra
te
[k
b
p
s]
Fig. 1. Link adaptation scheme.
.
III. SCHEDULINGALGORITHMS
In this work, we compare the performance of two traditional algorithms, namely the Round Robin (RR) and Rate Adaptive (RA), with and without the influence of the proposed PPM.
Firstly, we present the objectives of each algorithm and, then, we show the proposed method. RR and RA algorithms are not very sensitive to user channel variations and this common characteristic leads to the successful results to be shown in next sections.
A. Round Robin Algorithm
RR algorithm is developed as a cyclic queue of users.
Each i-th user is sequentially and periodically scheduled to
transmit in all subcarriers of one OFDM symbol, ignoring his channel state information. This algorithm is very simple to be implemented, nevertheless, it guarantees a fair resource management among all users. Fairness is his great advantage, but users with different QoS requirements could be place in disadvantage.
B. Rate Adaptive Algorithm
The RA algorithm concept is to maximize the lower bound of all users, i.e., the lowest mobile user data rate is maximized. The problem goal is defined as:
max
X ǫ, subject to ri(X)≥ǫ ∀i. (6)
IV. PROPOSEDMETHOD
We propose a PPM to be executed at the mobile user entity, before it sends his channel state information to the base station. In order to decrease the amount of channel state information reported, the proposed method suggests the user to known the used algorithm characteristics to foresee the possibilities of being scheduled in the next OFDM symbol.
We evaluate the performance of different users with
different rate requirements by means of system-level
simulations. Several channel realizations per user have been carried out and, the moment that each user was scheduled, his SNR was stored. In the next step, the CDF Fρi(sch)(·) of
SNR values from scheduled subcarriers of the i-th user was
calculated by the following:
ρi(sch)−→Fρi(sch)(ρi(sch))
Fρi(sch)(ρi(sch)) =P r(̺≤ρi(sch)), ∀ρi(sch), whereρi(sch)are the SNR values of the scheduled subcarriers of the i-th user and̺is a random variable.
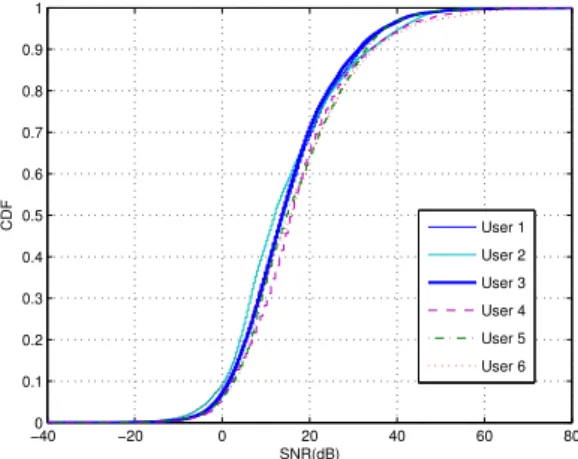
Six users were simulated with RR algorithm, the equivalent CDF curves for this algorithm are shown in Figure 2. In the same way, six users were simulated with RA algorithm and the equivalent CDF curves for this algorithm are shown in Figure 3.
Depending on the used algorithm, the CDF curve inherently reveals the QoS characteristics, which is the case of RA algorithm that takes into account the data rate requirements. Moreover, the CDF curve gives some information about scheduling policies. Physical layer could then use this additional information on making its proper decisions, as a cross-layer approach.
−600 −40 −20 0 20 40 60 80
0.1 0.2 0.3 0.4 0.5 0.6 0.7 0.8 0.9 1
CDF
User 1 User 2 User 3 User 4 User 5 User 6
SNR [dB]
Fig. 2. Typical CDF for Round Robin algorithm with 6 users
Thinking in this way, the main goal of PPM is to identify a threshold,Fi,th, where all SNR cumulative probabilities are greater than it, as depicted below:
ρi(n)−→Fρi(sch)(ρi(n))
Fi,th=Fρi(sch)(ρi,th(n)) =P r(̺≤ρi,th(n))
Fρi(sch)(ρi(n))>Fi,th, ∀ρi(n),
−400 −20 0 20 40 60 80
0.1 0.2 0.3 0.4 0.5 0.6 0.7 0.8 0.9 1
SNR(dB)
CDF User 1
User 2 User 3 User 4 User 5 User 6
Fig. 3. Typical CDF for Rate Adaptive algorithm with 6 users
whereρi,th(n)is the established SNR threshold the i-th user. After this step, mobile users could only have reported subcarrier channel gains whose correspondent SNR values are greater than ρi,th(n). For the non-reported subcarrier channel gains, mobile users turn off the signalling transmission of these subcarriers, but in case of this work, just for implementation’s reasons, pre-stablished dummy bits are transmitted and represented by the element-inf.
At the base station, RA algorithm identifies, firstly, subcarrier channel gains per user equal to dummy bits, then the equivalent subcarriers data rates are signalled equal to 0
(no transmission).
The scheduling process is done with user subcarriers whose
SNR values are greater than ρi,th(n). For instance, only
the users whose SNR values are greater than this threshold
ρi,th(n) for a specific subcarrier n are considered for the allocation of this subcarriern.
In the RR algorithm case, firstly, the user is scheduled, then, user subcarrier channel gains equal to dummy bits are identified, and finally, the equivalent subcarriers are signalled with data rate equal to0(no transmission). It means that user subcarriers, whose SNR values are greater thanρi,th(n), are included in the scheduling process. This fact is due to the RR algorithm concept restriction where all subcarriers must be signalled to the user, independent of his subcarrier channel gains.
We must keep in mind that PPM is a powerful method to avoid reporting unnecessary information, but a highFi,th has different impacts depending on the used scheduling algorithm. We can deduce, from the RA algorithm description in Section
III-B, that as the Fi,th increases, the average system data
rate increases also and the priority of users experiencing bad channel conditions decreases. Thus, the PPM method could bring about system data rates improvements. A similar analysis could be done with the the RR algorithm description in Section III-A, where we can deduce that the system data rate stays the same or gets worse.
Therefore, the Fi,th definition is an important trade-off
Fi,th corresponds to a distinct SNR region for the scheduling algorithms.
V. SIMULATIONSRESULTS ANDDISCUSSIONS
In this section, we describe the simulation scenario to be used for performance evaluation. The basic wireless system simulation parameters are listed in Table I.
TABLE I
BASIC SIMULATION PARAMETERS.
Parameter Value
System frequency 2 GHz Number of subcarriers 150
Subcarrier bandwidth 15 KHz Cell format circular Maximum distance from base station 1 Km Minimum distance from base station 10 m Shadowing standard deviation 8 dB OFDM symbol period 62,5 µs
Total system power 20 W
It was used a MATLAB program developed by Wireless
Telecommunication Research Group, where we assumed a single-cell system model with one base-station and six users with different data rate requirements, as presented in Table II. We have simulated 200 channel realizations in the simulation campaign. Each channel realization has a number of 2400 OFDM symbols. For implementation’s reasons, used algorithms schedule a sub-frame with 8 OFDM symbols, i.e., the transmission has the same scheduling configuration on the whole sub-frame.
TABLE II
DATA RATE PARAMETERS FOR PERFORMANCE EVALUATION:
Parameter Value
User 1 and User 4 - rate requirement 128 Kbps User 2 and User 5 - rate requirement 256 Kbps User 3 and User 6 - rate requirement 512 Kbps
Fi,thfor RA 0.3
Fi,th for RR 0.15
The users are uniformly distributed in the cell area and their position is randomly chosen at the moment the current channel realization starts. Propagation losses, such as path loss (suburban profile) and shadowing are simulated. Fast fading is also simulated as a Rayleigh process.
There are many different choices to assign values to the select SNR cumulative probability thresholds. In this work, we intend to avoid that the user reports subcarrier channel gains that will result in “poor” SNR values. In our case, the term “poor” SNR values means that this SNR could not achieve the minimum SNR required to even transmit in the lower available scheme (2-QAM). Based on Figures 1, 2 and 3, the SNR cumulative probability thresholds were defined as
Fi,th = 0.15andFi,th = 0.3, for the RR and RA algorithm, respectively. This difference is comprehensive and it is due
the distinct algorithm approaches, we can observe that RA algorithm schedules the user with the smallest achieved data rates and those ones could present bad channel conditions.
In Figure 4, we observe the performance of PPM for the RR algorithm. One can note the PPM does not change the performance of the RR algorithm, and both achieved data rates attain the rate requirements for each user. Sometimes, there are short differences between them (-0.42%, 4.11%, 8.83%, -1.70%, -5,21% and 7.23%).
1 2 3 4 5 6
0 5 10 15x 10
5
Achieved average data rate with PPM Achieved average data rate Rate Requirement
Users
R
at
es
[b
p
s]
Fig. 4. Rate requirements and achieved data rates with and without pre-processing method, using RR algorithm withFi,th= 0.15.
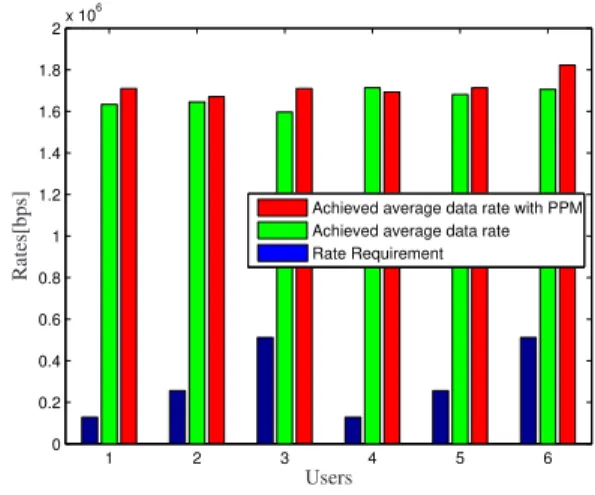
In Figure 5, we see the performance of PPM for the RA algorithm. Similar to RR algorithm case, one can observe that PPM does not change the performance and both achieved data rates (with and without PPM) attain the rate requirements for each user. Short differences observed between them (4.68%, 1.56%, 7.08%, -1.20%, 1.95% and 6.83%).
1 2 3 4 5 6
0 0.2 0.4 0.6 0.8 1 1.2 1.4 1.6 1.8
2x 10
6
Achieved average data rate with PPM Achieved average data rate Rate Requirement
Users
R
at
es
[b
p
s]
Fig. 5. Rate requirements and achieved average data rates with and without pre-processing method, using RA algorithm withFi,th= 0.30.
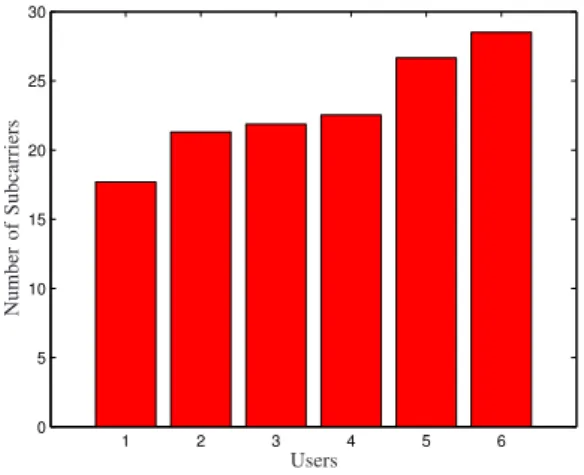
subcarriers. These results may be seen in Figure 6 and 7. This is an important result since we show a waste of resources for reporting CSI. We have then used a limited feedback using the PPM, conserving the achieved average data rate.
1 2 3 4 5 6
0 5 10 15 20 25 30
Users
N
u
m
b
er
o
f
S
u
b
ca
rr
ie
rs
Fig. 6. Number of subcarriers not reported to the base station per user, using RR algorithm with aFi,th= 0.15.
1 2 3 4 5 6
0 5 10 15 20 25 30
Users
N
u
m
b
er
o
f
S
u
b
ca
rr
ie
rs
Fig. 7. Number of subcarriers not reported to the base station per user, using RA algorithm with aFi,th= 0.30.
VI. CONCLUSIONS ANDPERSPECTIVES
We have presented a new pre-processing method called PPM, which allows to decrease the amount of CSI reported from the mobile user to the base station, limiting, without loss, the required feedback from the mobile terminal. This goal is achieved looking at two new curves presented in this paper, each one maps the cumulative distribution function of SNR values from the scheduled users. These curves were obtained to the RR and RA algorithms.
The new technique PPM described enables the mobile user saves about 9,33% a 18,67% of required CSI reported to the base station preserving the characteristics of the original algorithm, i.e., the effects on QoS parameters (represented by average data rate) were imperceptible.
A direct extension to this work is the investigation of the PPM effects using adaptive thresholds and different scheduling algorithms.
REFERENCES
[1] Hermann Rohling and Rainer Gr¨unheid,Cross Layer Considerations for an Adaptive OFDM-Based Wireless Communication System. Wireless Personal Communications, v. 32 , n. 1, January 2005.
[2] Luis Alonso and Ram ´on August´ı, Optimization of wireless communications systems using cross-layer information. Signal Processing, v. 86, n.8, p. 1755-1772, August 2006.
[3] Vineet Srivastava and Mehul Motani, Cross-Layer Design: A Survey and the Road Ahead. IEEE Communications Magazine, p. 112-119, December 2005.
[4] Benno Zerlin, Michel T. Ivrlac, Josef A. Nossek, and A. Klein. On Cross-Layer Assisted Resource Allocation in HSDPA. Proceedings of the 12th International Conference on Telecommunication. IEEE, May 2005. Cape Town, South Africa.
[5] T. S. Rappaport, A. Annamalai, R. M. Buehrer, and W. H. Tranter, Wireless communications: Past events and a future perspective. IEEE Communications Magazine, v. 40, p. 148 a 161, Maio 2002.
[6] Frank H.P. Fitzek, Basak Can, Nguyen Cong Huan, Muhammad Imadur Rahman, Ramjee Prasad and Changhoi Koo,Cross Layer Optimization of OFDM Systems for 4G Wireless Communications. 9th International OFDM Workshop (InOWo 2004), Germany, 2004.
[7] Wonjong Rhee and John M. Cioffi,Increase in Capacity of Multiuser OFDM System Using Dynamic Subchannel Allocation. Vehicular Technology Conference (VTC) Proceedings, pp. 1085-1089, Tokyo, May 2000.
[8] G. Song and Y. Li, Cross-Layer Optimization for OFDM Wireless Networks - Part I: Theoretical Framework. IEEE Transactions on Wireless Communications, v. 4, n. 2, March 2005.