Rev Bras
Cineantropom
Hum
DOI: http://dx.doi.org/10.5007/1980-0037.2017v19n3p316
original article
Change of Pronation Angle of the Subtalar Joint
has Inluence on Plantar Pressure Distribution
Alteração do Ângulo de Pronação da Articulação Subtalar
tem Inluência na Distribuição de Pressão Plantar: Um
Estudo Preliminar
João Otacilio Libardoni dos Santos1
Eliane Fátima Manfio2
Felipe Pivetta Carpes3
Ewertton de Souza Bezerra1
Rudnei Palhano4
Aluisio Otavio Vargas Avila4
Abstract – Several studies have investigated the relationship between heel pronation with plantar pressure during gait. With a degree of variability and inluence of the footwear, usually excessive pronation is associated with higher mechanical loads. However, larger loads are commonly associated with pronation. his study aims to compare the plantar pressure distribution among individuals with diferent pronation angles of the subtalar joint angle during gait with controlled speed. he maximum angle of the subtalar joint was determined by capturing images in the frontal plane and the pressure plant peaks were acquired by EMED pressure platform. he pronated group showed pressure plant peaks signiicantly higher in the lateral heel area (18%; p=0.031), medial heel (17%, p=0.034), lateral midfoot (30%; p=0.032) and medial midfoot (41%; p=0.018) when compared to the control group. Excessive pronation of the subtalar joint caused changes in plantar pressure distribution, and an increase in pressure plant peaks, especially in the heel and midfoot regions. his demonstrates the need for a speciic care of this population, mainly because the increased pressure plant peaks is related to pain in the feet and onset of injuries.
Key words: Foot; Gait; Pressure; Pronation.
Resumo – Diversos estudos investigaram a relação da pronação da articulação subtalar com a pressão plantar na marcha. Com certo grau de variabilidade e inluência do calçado, geralmente uma pronação excessiva está associada a cargas mecânicas mais elevadas. Contudo, popular-mente se associa qualquer índice de pronação com aumento das cargas. Neste estudo buscamos comparar a distribuição de pressão plantar entre indivíduos com diferentes comportamentos do ângulo de pronação da articulação subtalar durante a marcha com velocidade controlada. O ângulo máximo de pronação da articulação subtalar foi determinado por meio da aquisição de imagens no plano frontal e os picos de pressão plantar foram adquiridos através da plataforma de pressão EMED. O grupo pronado apresentou picos de pressão plantar signiicativamente mais elevados na região do calcanhar lateral (18%; p=0,031), do calcanhar medial (17%, p=0,034), do mediopé lateral (30%; p=0,032) e do mediopé medial (41%; p=0,018) quando comparado ao grupo controle. A excessiva pronação da articulação subtalar provocou alterações na distribuição de pressão plantar, com aumento nos picos de pressão plantar, principalmente nas regiões do calcanhar e do mediopé. Isto demonstra a necessidade de um cuidado especiico em relação e este público, principalmente pelo aumento dos picos de pressão plantar estar relacionado com dores
1 Federal University of Amazonas. Laboratory of Human Performance. Manaus, AM. Brazil.
2 Feevale University. Novo Hambur-go, RS. Brazil.
3 Federal University of Pampa. Center for Health Sciences. Applied Neuromechanics Group. Uruguaiana, RS. Brazil.
4 Brazilian Institute of Technology for Leather. Footwear and Artifacts. Biomechanics Laboratory. Novo Hamburgo, RS. Brazil.
Received: 19 September 2016
he pronation movement of the subtalar joint is necessary because it assists in the attenuation of impact forces during the phase of body weight support during gait1, and results from the combination of eversion, dorsilexion and
abduction of the subtalar and mediotarsal joint2. For satisfactory impact
at-tenuation, the pronation movement will have an amplitude of approximately 3º to 8º3,4, whereas amplitudes greater than these characterize excessive
pronation, causing greater load on the joint5,6.
Excessive pronation of the subtalar joint afects the alignment of foot, ankle, leg, pelvis and lumbar region, causing changes in kinetic7
and kinematic8 biomechanical parameters during the gait support phase.
Because it is a movement performed in a closed kinetic chain, it changes joint torques, reduces rigidity and alters stresses imposed on the structures of the lower limbs and lumbar-pelvic complex9.
his atypical pattern of movement of the subtalar joint may also lead to an increase in magnitude, velocity and duration of internal rotation of the lower limbs (knee and / or hip) by means of the mechanical interdepend-ence between rotations of the talus and tibia in the talocrural joint9. his
alteration in alignment exists as a function of a compensatory movement on the triplanar axis of the subtalar joint, which results in a change in the normal alignment in any part of the foot10.
Although subtalar pronation is related as a parameter of structural overload9, it is not the only biomechanical variable afected, since plantar
pressure undergoes direct changes as a consequence of excessive move-ments of this joint11. Plantar pressure measurements are commonly used to
investigate running and gait adaptations, as it is sensitive to neuromuscular and neurological adaptations12. hus, changes in the plantar pressure
dis-tribution may indicate abnormal functioning of the subtalar joint13. Our
hypothesis is that individuals with excessive subtalar pronation (greater than 8º)3,4 will have higher plantar pressure peaks. herefore, the aim of this
study was to compare the plantar pressure distribution among individuals with diferent pronation angle behavior of the subtalar joint during gait.
METHODOLOGICAL PROCEDURES
Twenty-one men (27 ± 8 years, 178 ± 6 cm, 76 ± 10 kg), without neurological and musculoskeletal involvement, participated in the study. Participants were classiied into 2 groups according to the maximum pronation angle of the subtalar joint (PASmax) determined up to 35% in the gait support phase3,4. All participants signed the free and informed consent form
ap-proved by the Ethics Committee of Research on Human Beings of the State University of Santa Catarina (184/06).
dif-Pronation Angle of the Subtalar Joint Libardoni dos Santos et al.
ference between the relative angle between tibiocalcaneal segments at the initial contact and the maximum relative angle between tibiocalcaneal segments that occurs up to 35% of the gait support phase, calculated in relation to the 100% of the contact phase15. he maximum angular value
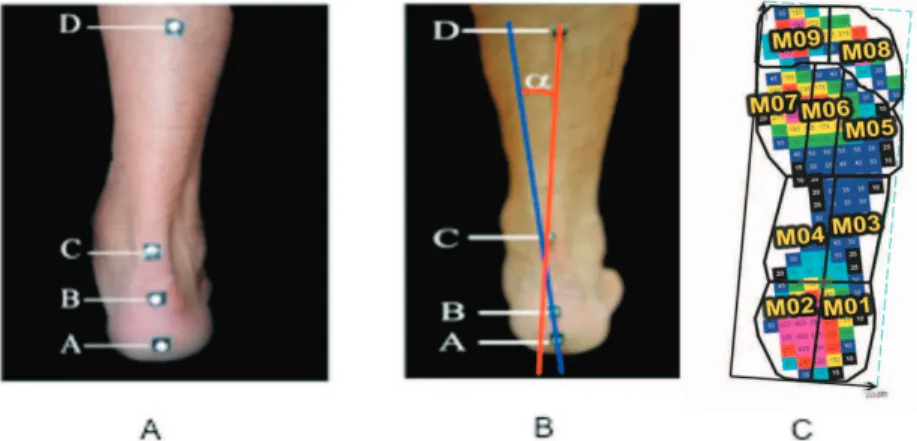
of PAS found during the movement was considered. he anatomical refer-ence points to obtain PAS were arranged as suggested by literature2 and
illustrated in Figure 1a:
• Point A: 20mm from the ground in the central region of the calcaneus; • Point B: 50 mm from the ground in the central region of the calcaneus; • Point C: in the region of the calcaneus tendon, at the height of the
lateral malleolus; and
• Point D: 150mm above Point C, in the center of the leg.
he calcaneus segment was determined by points A and B and the tibia segment by points C and D (Figure 1b).
he acquisition of kinematic data referring to PAS used a cinemetry system (Spica Technology Corporation ™, Spica Technology Corpora-tion ™, Hollis, USA) with a MoCorpora-tionVision DALLSTAR CA-D6 model camera (Spica Technology Corporation ™, Hollis, USA), operating at sampling rate of 955 Hz, and positioned perpendicular to the movement (frontal plane) 30 cm above the ground. Data processing was performed by DMAS6® software (Spica Technology Corporation ™, Hollis, USA).
Figure 1 - Location of reference points (A); Relative angle (α) between tibiocalcaneal segments (B); Plantar pressure distribution plantargram divided into 9 regions of the foot (C01) (M01 - lateral heel region, M02 - medial heel region, M03 - mid lateral foot region, M04 - medial midfoot region; M05 – metatarsus region III-V, M06 - metatarsus region II, M07 - metatarsus region I, M08 finger - region II-V, M09 - finger region I).
was used (Spica Technology Corporation ™).
A pressure platform (Emed-XR, Novel, München, Germany), with sampling rate of 100 Hz was used for the acquisition of kinetic data of plantar pressure distribution (PPP). To control the gait speed (5 km / H ± 5%) during data collection, a set of 4 photocells arranged at a distance of 3m from each other was used, and the pressure platform was positioned in the center of the photocell disposition.
For kinetic data processing (PPP), a mask system was used in the Novel Gmbh® software (Novel, München, Germany). hese masks divided the foot into 9 regions, being: lateral heel region (M01), medial heel region (M02), lateral midfoot region (M03), medial midfoot region (M04), meta-tarsus region III-V (M05), metameta-tarsus region II (M06), metameta-tarsus region I (M07), inger region II-V (M08) and inger region I (M09) (Figure 1c).
On a single day of evaluation, subjects were instructed to walk barefoot at a controlled speed of 5 km / h ± 5%, straight on a walkway (13 m x 1.2 m). After 7 attempts to familiarize with the data collection environment, each subject performed 7 more valid attempts (right foot in contact with the working area of the pressure platform) at controlled speed. To ind out when the heel touched the ground, the Spica Technology Corporation ™ system was aligned with the Novel Emed-XR system. Alignment between acquisition systems was accomplished by LED (signal light) of the Novel Emed-XR system that was activated by the heel touch (initial contact) on the sensed platform. he LED emitted a light signal when the capacitive sensors of the Novel Emed-XR platform are loaded with loads greater than 10 kPa (NOVEL, 2006). From the moment the LED was activated, the beginning of the PASmax data analysis was considered. Data were nor-malized for each participant, considering the irst value of the pronation angle of the subtalar joint (initial contact) being 0 (zero).
To verify the normality of data distribution, the Shapiro-Wilk test (p≤0.05) was used. he Levene test was applied to verify the equality of variance. To evaluate possible diferences between groups, the Student’s t-test was used for independent samples. Signiicance level of <0.05 was ap-plied for all tests. Analyses were performed in the SPSS 21.0 for Windows software (IBM, Armonk, New York, USA). he efect size was calculated by d = M1-M2 / σ, proposed with Cohen16.
RESULTS
Pronation Angle of the Subtalar Joint Libardoni dos Santos et al.
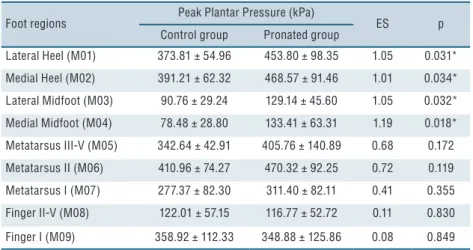
Higher plantar pressure peaks were concentrated in the same areas (metatarsus II, medial heel and lateral heel) in both groups. However, pronated group presented signiicantly higher plantar pressure peaks in the lateral heel region (18%, p = 0.031), medial heel (17%, p = 0.034), lat-eral midfoot (30%, p = 0.032) and medial midfoot (41%; p = 0.018) when compared to the control group (Table 1).
he size efect for variables lateral and medial heel, lateral and medial midfoot showed great efect for the pronated group, evidencing that such condition places this group 30% above the 50th percentile of the control
group. Although variables inger II-V and inger I had small efect, vari-ables metatarsus I, II, III and IV showed average efect, evidencing that the condition with pronation is about 19% above the 50th percentile of the
control group.
Table 1. Values for peak plantar pressure (PPP) for the Control Group and pronated group in the different foot regions (Mean ± standard deviation)
Foot regions Peak Plantar Pressure (kPa) ES p
Control group Pronated group
Lateral Heel (M01) 373.81 ± 54.96 453.80 ± 98.35 1.05 0.031*
Medial Heel (M02) 391.21 ± 62.32 468.57 ± 91.46 1.01 0.034*
Lateral Midfoot (M03) 90.76 ± 29.24 129.14 ± 45.60 1.05 0.032*
Medial Midfoot (M04) 78.48 ± 28.80 133.41 ± 63.31 1.19 0.018*
Metatarsus III-V (M05) 342.64 ± 42.91 405.76 ± 140.89 0.68 0.172
Metatarsus II (M06) 410.96 ± 74.27 470.32 ± 92.25 0.72 0.119
Metatarsus I (M07) 277.37 ± 82.30 311.40 ± 82.11 0.41 0.355
Finger II-V (M08) 122.01 ± 57.15 116.77 ± 52.72 0.11 0.830
Finger I (M09) 358.92 ± 112.33 348.88 ± 125.86 0.08 0.849
* Significant differences between control group and pronated group (p <0.05); ES = effect size
DISCUSSION
he aim of this study was to investigate whether excessive pronation of the subtalar joint may inluence the plantar pressure distribution. Our main hypothesis was that increased pronation of the subtalar joint alters plantar pressure, leading to higher plantar pressure peaks due to excessive pronation, relecting in increased joint overload. Our results conirm the hypothesis, since excessive pronators presented higher plantar pressure peaks in the heel (medial and lateral) and midfoot (medial and lateral).
he increase in plantar pressure peaks in the pronated group may have occurred due to the alteration of joint torques, amplitudes of joint movements, reduction of stifness and length presented by the lower limb, which is characteristic of this pattern of movement 9. As the lower limbs
valgus knee in the support phase17. In addition, increased pronation leads
to increased lexion, adduction and internal rotation of the hip. When this occurs, the pelvis rotates anteriorly and elevates the rotation forward toward pronation3. hus, it is inferred that these kinematic alterations change the
distribution of forces on the ground and consequently modify the plantar pressure distribution.
More speciically, the increase in plantar pressure peaks observed in this study in the pronated group may be associated with an ineicient functioning of the subtalar joint (responsible for the transformation of the tibial rotation into pronation), which is characteristic in individuals who exhibit excessive pronation movement during gait7,18. his ineiciency may
be related to myoligamentar deicits, since the ankle ligaments counting on the help of the tibialis anterior, tibialis posterior, gastrocnemius and soleus muscles, are the main responsible for avoiding excessive pronation17.
Hintermann; Nigg19 argue that changes in pressure distribution may be
associated with pronounced and prolonged excessive movements of heel pronation during gait that cause increased stress in the medial region of the foot, modifying pressures in the lateral and medial heel region.
Also, regarding the inluence of changes in the kinematics patterns of the lower limbs in the kinetic aspects of gait7,11, it was veriied that changes
in the normal biomechanics of the foot / ankle complex signiicantly in-luenced the patterns of plantar pressure distribution. here may also be an association between the kinematics of lower limbs (knee) and alteration in the plantar pressure distribution, increasing the risk of developing pain, discomfort and pathologies, especially in individuals who practice repetitive activities and with greater intensity19.
Another important aspect of this study is that individuals in the control group and in the pronated group had similar patterns of plantar pressure distribution, such as higher plantar pressure peaks in the same areas (Meta-tarsus II, Medial Heel and Lateral Heel) (Table 1), which demonstrates that it is not possible to diferentiate individuals with diferent eversion angles using only the qualitative analysis of a plantar pressure distribution plantigram or equipment that does not allow a precise quantitative evalua-tion of kinetic plantar pressure data. his behavior in the plantar pressure distribution shows that as the foot is a lexible structure, with movements that can occur independently in the hindfoot, midfoot and forefoot regions, these structures adjust according to postural changes and adaptation needs of the locomotor apparatus to demands generated during locomotion.
Pronation Angle of the Subtalar Joint Libardoni dos Santos et al.
322
CORRESPONDING AUTHOR
João Otacilio Libardoni dos Santos Federal University of Amazonas, Human Performance Laboratory, Physical Education and Physiotherapy Faculty Avenue General Rodrigo Octavio Jordão Ramos, nº 3000, Coroado. CEP: 69077-000. Manaus, AM, Brazil.
Email: [email protected]
CONCLUSION
Excessive pronation of the subtalar joint caused changes in the plantar pres-sure distribution during gait, with a signiicant increase in plantar prespres-sure peaks, especially in the heel and midfoot regions. his demonstrates the need for speciic care in relation to this public, mainly because increased plantar pressure peaks is related to foot pain and the onset of injuries.
REFERENCES
1. Perry SD, Lafortune MA. Inluences of inversion/ eversion of the foot upon impact loading during locomotion. Clin Biomech 1995; 10(5):253–7.
2. Cheung RTH, NG GYF. Eicacy of motion control shoes for reducing excessive rearfoot motion in fatigued runners. Phys her Sport 2007; 8(2):75-81.
3. Dicharry J. Kinematics and kinetics of gait: from lab to clinic. Clin Sports Med 2010; 29 (3):347– 64.
4. Morley J, Decker L, Dierks T, et al. Efects of varying amounts of pronation on the medial ground reaction forces during barefoot versus shod running. J Appl Biomech 2010; 26(2):205–14.
5. Ferber R, Hreljac A, Kendall KD. Suspected mechanisms in the cause of overuse running injuries: a clinical review. Sports Health 2009; 1(3):242–46.
6. Ryan M, Grau S, Krauss I, Maiwald C, Taunton J, Horstmann T. Kinematic analysis of runners with achilles mid-portion tendinopathy. Foot Ankle Inter 2009; 30(12):1190-5.
7. Fitzgerald RH, Vedpathak A. Plantar Pressure Distribution in a Hyperpronated Foot before and after Intervention with an Extraosseous Talotarsal Stabilization Device - A Retrospective Study. J Foot Ankle Surg 2013; 52(4):432-43.
8. Zhang X, Paquette MR, Zhang S. A comparison of gait biomechanics of lip-lops, sandals, barefoot and shoes. J Foot Ankle Res 2013; 6(1):45.
9. Souza TR, Pinto RZA, Trede RG, Araújo PA, Fonseca HL, Fonseca ST. Pronação excessiva e varismos de pé e perna: relação com o desenvolvimento de patologias músculo-esqueléticas - revisão de literatura. Fisioter Pesqui 2011; 18(1):92-100.
10. Edington CJ, Frederick EC, Cavanagh PR. Rearfoot motion in distance running. In Cavanagh PR (Ed.). he biomechanics of distance running. Champaign, IL: Human Kinetics; 1990. p. 135- 164.
11. Aguilar MB, Abián-Vicén J, Halstead J, Gijon-Nogueron G. Efectiveness of neuromuscular taping on pronated foot posture and walking plantar pressures in amateur runners. J Sci Med Sport 2016;19(4):348-53.
12. Orlin MN, McPoil TG. Plantar pressure assessment. Phys her 2000; 80(4):399–409.
13. Dinh, TL, Aristidis V. A review of the mechanisms implicated in the pathogenesis of the diabetic foot. Int J Low Extrem Wounds 2005; 4(3):154-9.
14. O’Sullivan K, Kennedy N, O’Neill E, Mhainin UN. he efect of low-dye taping on rearfoot motion and plantar pressure during the stance phase of gait. BMC Musculoskelet Disord 2008; 9 (1):111.
15. Nazario, PF, Santos JOL, Avila AOA. Comparação da distribuição de pressão plantar em sujeitos com pés normais e com pés planos durante a marcha. Rev Bras Cineantropom Desempenho Hum 2010; 12(4): 290-94.
16. Cohen, J. Statistical power analysis for the behavioral sciences (2nd ed.). Hillsdale, NJ: Lawrence Earlbaum Associates; 1988.
17. Nigg BM, Morlock M. he inluence of lateral heel lare of running shoes on pronation and impact forces. Med Sci Sports and Exerc 1987; 19(3): 294–302.
18. Terry L. Nicola, David J. Jewison. he Anatomy and Biomechanics of Running. Clin Sport Med 2012; 3(2): 187-201.