OR
IGI
N
A
L
R
E
S
E
A
R
C
H
Mailing address: Lisiane Piazza – Rua Rio Branco, 1541, Cruzeiro – Passo Fundo (RS), Brasil – CEP: 99070-080 – E-mail: [email protected] – Funding source: Nothing to declare – Conlict of interest: Nothing to declare – Presentation: Dec. 2015 – Accepted for publication: Sept. 2016 – Approved by the Ethics Committee: 33/2010.
Study performed at the Laboratory of Posture and Balance of the Santa Catarina State University (UDESC) – Florianópolis (SC), Brazil, and at the Laboratory of Biomechanics of the University of Passo Fundo (UPF) – Passo Fundo (RS), Brazil.
1
Physical therapist, Doctoral student in Human Movement Sciences at UDESC. Professor in the Department of Physical Therapy of UDESC – Florianópolis (SC), Brazil.
2Physical therapist, PhD in Physical Therapy, professor in the Department of Physical Therapy at UDESC – Florianópolis (SC), Brazil.
ABSTRACT | This study aimed to evaluate baropodometric characteristics during the stage of gait support in stairs and ramps of subjects with and without Patellofemoral Pain Syndrome (PFPS). Fifty-ive female individuals participated: 24 with PFPS (PFPS group – PFPSG) and 31 clinically healthy (clinically healthy group – CHG), matched for age, height, and body mass. Peak pressure, contact area, and contact time were evaluated in six plantar regions (medial forefoot, lateral forefoot, midfoot, medial rearfoot, central rearfoot, and lateral rearfoot) by the Pedar-X system, during four functional activities (climbing up and down stairs and a ramp). The order of performance of evaluations was randomized. The intensity of the pain of the subjects before and after activities was evaluated by Visual Numeric Scale (VNS). Data were analyzed by descriptive and inferential statistics (Independent t-independent, Anova 2x6, and Wilcoxon tests), with a signiicance level of p ≤ 0.05. No diferences were found between groups in the peak pressure, contact area, and contact time on the six plantar regions analyzed during the four functional activities. There was pain exacerbation of the subjects after the four functional activities (p = 0.01). Thus, the results of the present study, considering the experimental conditions used, suggest that there is a pattern of behavior regarding baropodometric variables
284
(peak pressure, contact area, and contact time) that diferentiates subjects with and without PFPS during the activities of climbing up and down stairs and the ramp. Keywords | Patellofemoral Pain Syndrome; Biomechanics; Gait; Knee.
RESUMO | Este estudo teve como objetivo avaliar as características baropodométricas durante a fase de apoio da marcha em escadas e rampa de sujeitos com e sem síndrome da dor patelofemoral (SDPF). Participaram 55 indivíduos do gênero feminino, 24 com SDPF (GSDPF) e 31 clinicamente saudáveis (GC), pareados em idade, estatura e massa corporal. Foram avaliadas as variáveis pico de pressão, área de contato e tempo de contato em seis regiões plantares (antepé medial, antepé lateral, médio pé, retropé medial, retropé central e retropé lateral), por meio do sistema Pedar-X, durante a realização de quatro atividades funcionais (subir e descer escadas e rampa). A ordem de realização das avaliações foi randomizada. A intensidade da dor dos sujeitos antes e após as atividades foi avaliada pela Escala Visual Numérica (EVN). Os dados foram analisados por meio da estatística descritiva e inferencial (Testes T-independente, Wilcoxon e ANOVA 2x6), com nível de signiicância de p ≤ 0,05. Não foram observadas diferenças entre os grupos em relação ao pico
Patellofemoral pain syndrome does not alter
baropodometric characteristics during gait in ramps
and stairs
de pressão, área de contato e tempo de contato nas seis regiões plantares analisadas durante as quatro atividades funcionais. Houve exacerbação da dor dos sujeitos após a realização das quatro atividades funcionais (p = 0,01). Sendo assim, os resultados deste estudo, nas condições experimentais utilizadas, sugerem que não existe um padrão de comportamento em relação às variáveis baropodométricas estudadas que diferencie sujeitos com e sem SDPF durante as atividades de subir e descer escadas e rampa.
Descritores | Síndrome da Dor Patelofemoral; Marcha; Joelho.
RESUMEN | El propósito de este texto es evaluar las variables baropodométricas durante la etapa de apoyo de la marcha en escaleras y rampa de individuos con y sin síndrome de dolor patelofemoral (SDPF). Han participado 55 muyeres, 24 con SDPF (GSDPF) y 31 clínicamente sanas (GC), pareadas en edad, estatura y masa corpórea. Se evaluaron las variables presión máxima, área de contacto y tiempo de contacto en seis regiones plantares (antepié medial, antepié lateral, parte media del pie, retropié
medial, retropié central y retropié lateral), mediante el sistema Pedar-X, durante la realización de cuatro actividades funcionales (subir y bajar escaleras y rampa). Fue aleatorio el orden de realización de las actividades. Se evaluó la intensidad del dolor de los individuos antes y después de las actividades a través de la Escala Visual Numérica (EVN). Se evaluaron los datos a través de estadística descriptiva e inferencial (Pruebas T-independiente, Wilcoxon y ANOVA 2x6), con nivel de signiicación p ≤ 0,05. No se observaron diferencias entre los dos grupos en cuanto a la presión máxima, área de contacto y tiempo de contacto en las seis regiones plantares evaluadas durante las cuatro actividades funcionales. Los individuos tuvieron mucho dolor después de realizar las cuatro actividades funcionales (p = 0,01). Así los resultados indican que en las condiciones investigadas no hay un modelo de comportamiento relativo a las variables baropodométricas examinadas que diferencie a los individuos con y sin SDPF durante las actividades de subir y bajar escaleras y rampa.
Palabras clave | Síndrome de Dolor Patelofemoral; Marcha; Rodilla.
INTRODUCTION
Patellofemoral Pain Syndrome (PFPS) is characterized as a diffuse pain in the anterior
region of the knee1, usually of insidious onset and
slow progression2,3. It is one of the most common
diseases that affect knees4,5, and can lead to
functional disabilities that impair activities of daily
living3.
Its signs and symptoms are exacerbated mainly during the performance functional activities, among which we can highlight movements for climbing up and
down stairs and sloping surfaces6,7. In this sense, some
studies were conducted to investigate biomechanical patterns adopted by subjects with PFPS during the performance of functional activities, noting changes
in the electromyographic activity of vastus8, in ground
reaction forces9, in kinematics7,9-16, and in plantar
pressure distribution17,18,2.
According to hijs et al.2, changes in plantar pressure
distribution can reduce the shock absorption ability of the foot, transferring part of the ground reaction force to more proximal joints, including the knee, resulting in overload of the patellofemoral joint with consequent increase in patellofemoral pain.
Although there are studies on plantar pressure distribution, so far, few have evaluated it in subjects
with PFPS. hijs et al.2,19 evaluated plantar pressure
to determine risk factors for the development of PFPS in militaries and corridors, respectively. On
the other hand, Aliberti et al.17,18 analyzed plantar
pressure distribution in subjects with PFPS during the activity of climbing down stairs and gait, respectively. However, the results found by these authors difer regarding plantar pressure distribution patterns presented by the subjects, which might have occurred because the studies were performed with diferent populations, instruments, and in diferentiated situations. In addition, these studies did not evaluate plantar pressure distribution in tasks such as climbing up stairs, besides going up and down ramps, activities in which subjects also feel pain often. It is believed that subjects with PFPS can change their walking patterns as a strategy for reducing pain during the performance of functional activities, and this could lead to changes in plantar pressure distribution, reducing contact time and peak pressure of the member with pain compared with the control group.
time) during the stage of gait support in stairs and in the ramp of subjects with and without PFPS.
METHODS
Fifty-ive female individuals participated in this study, divided in two groups: 24 with Patellofemoral Pain Syndrome (PFPSG) (22.8±6.1 years, 59.8±8.1kg, 1.65±0,07m) and 31 clinically healthy (CHG) (21.4±3.6 years, 59.1±8.1kg, 1.64±0.05m). he study was approved by the local Research Ethics Committee (protocol no 33/2010) and all subjects signed an informed consent form. Subjects studied were only female due to
biomechanical diferences between genders20 and the
highest incidence of PFPS in women21.
Inclusion criteria for the PFPSG were: anterior or retropatellar pain, exacerbated for at least three of the following situations – climbing up or down stairs, crouching for long periods, kneeling, running, sitting for
long periods, and when practicing sports22,23; insidious
onset of symptoms unrelated to traumatic events24; pain
equal to or greater than 2cm according to the Visual Numeric Scale (VNS – 0-10cm) in patellofemoral joint in the seven days prior the test, during the performance of the aforementioned activities; pain, of any magnitude, in two functional tests lasting 30 seconds each (crouching at 90 degrees and going down
a 25cm tall step)22.
Inclusion criteria for the control group (CHG) were: lack of record of meniscal or ligament injury, trauma,
surgery, or fracture in the lower limb20,23; no record of
pain in the knee joint or in the patellofemoral joint (pain
0 cm according to the Visual Analogue Scale – VAS)20;
lack of any problem in the hip and leg joints, neurological
diseases, or diseases of the musculoskeletal system23;
not having had a physical therapy treatment for lower limb; no pain, of any magnitude, during the functional tests with duration of 30 seconds each (crouching at 90
degrees and going down a 25 cm tall step)22.
Exclusion criteria for both groups were: having
neurological diseases25; record of trauma in lower
limbs, meniscal or ligament knee injury22; recurring
patellar dislocation; record of knee or lower limbs surgery; having systemic diseases that could impair locomotion.
Baropodometric characteristics during the gait in the ramp and in stairs were evaluated through Pedar-X® from Novel (Munich, Germany), with an
acquisition frequency of 100 Hz. Boyd et al.26 assessed
the reliability of Pedar-X® when analyzing a single step and without controling gait speed, in addition to verifying the validity of the vertical force obtained by this system compared with the force platform, inding a good reliability for free gait (ICC from 0.57 to 0.89), in addition to an excellent validity for the measurement of vertical forces between the force platform and the Pedar-X® system (ICC = 0.81 and 0.84).
For evaluation, insoles of the Pedar-X® were placed within the footwear that was used and connected to a conditioner that was placed in a belt attached to the waist of the subjects. his conditioner communicated and transferred data to the computer through Bluetooth communication, thus facilitating the displacement of the subject by the location of the evaluations. All insoles were calibrated prior the study according to manufacturer’s speciications. To control diferences in the type of footwear, all subjects used a standard footwear (Moleca® shoe). Before starting data collection, subjects went through a period of familiarization with the collection environment and equipment.
he order of performance of activities (climbing up and down stairs and the ramp) was randomized through loterry. For evaluation of baropodometric characteristics during the activity of climbing up and down stairs, subjects were instructed to climb up and down a stair of 11 steps (16,5cm height, 271cm wide, and 30,5cm long), without supporting on the stair rail with the speed they usually engage in this activity, starting the task always with the right foot. Similarly, subjects were instructed to climb up and down a ramp (1378cm long x 153cm wide, with an inclination angle of 12°), as they usually engage in this activity, without supporting on the stair rail and always starting with the right foot. Gait speed was monitored, but not controlled. For monitoring, we used a chronometer
(Kenko KK-1046®) and speed was determined by
dividing the distance by the mean time of gait in stairs and in the ramp. he speed employed by subjects with PFPS and by those of the control group in activities did not show statistical diference (climbing up stairs: p=0.6; climbing down stairs: p=0.3; climbing up the ramp: p=0.1; climbing down the ramp: p=0.2).
Pain intensity of the subjects during the activities of climbing up and down stairs and the ramp was evaluated by Visual Numeric Scale (VNS), which presents validity and reliability established for this
Data treatment
For data analysis we discarded the irst and the last step in order to avoid the efect of movement acceleration and deceleration, being analyzed, on average, 10 steps per subject for each functional activity. Plantar surface was divided in medial rearfoot, central rearfoot, and lateral rearfoot; medial
forefoot, lateral forefoot, and midfoot18 (Figure 1).
Figure 1. Foot divided in six regions, according to the mask applied. MF – medial forefoot, LF – lateral forefoot, M – midfoot, MR – medial rearfoot, CR – central rearfoot, LR – lateral rearfoot Source: Novel (2010)
We analyzed the following variables: peak pressure
(KPa), contact area (cm2), and contact time (ms) of the
six plantar regions that, via software, were proportionally adjusted to width and length of the foot of each subject.
Statistical analysis
For statistical analysis we used the Statistical Package for the Social Sciences (SPSS v. 17.0), using the descriptive statistics for subjects’ characterization. he Shapiro-Wilk test showed plantar pressure data with Gaussian distribution. We used Independent t-test to test subjects’ homogeneity (age, weight, height, and gait speed), Anova 2x6 (two groups X six plantar regions, being the six plantar regions considered repeated measures) to compare peak pressure (Kpa), contact area
(cm2), and contact time (ms) in the six plantar regions
between PFPSG and CHG, and the Wilcoxon test for comparing the pain of PFPSG subjects before and after climbing up and down stairs and the ramp. he signiicance level adopted was p≤0.05.
RESULTS
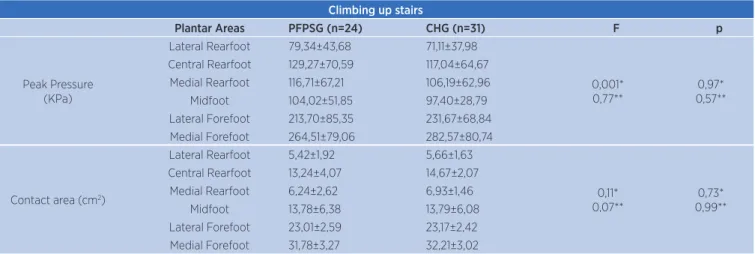
Table 1 presents the results for peak pressure (KPa),
contact area (cm2), and contact time (ms) for the six
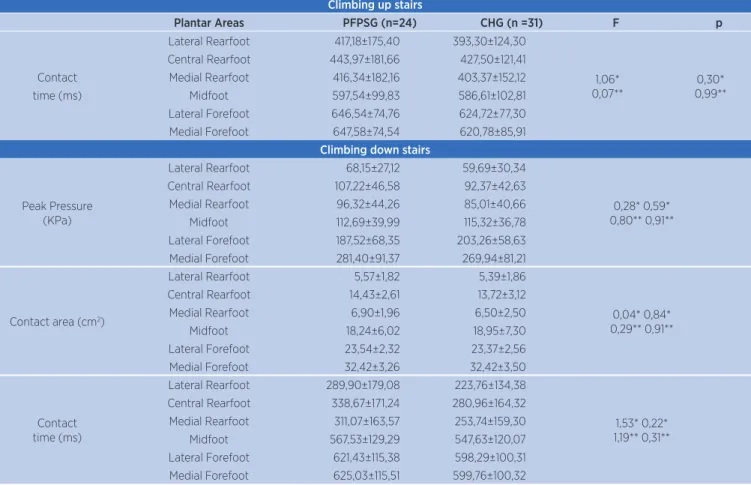
plantar regions of PFPSG and CHG during the activities of climbing up and down stairs. We did not observe group efect, or interaction between group and plantar regions for peak pressure, contact area, and contact time in both functional activities.
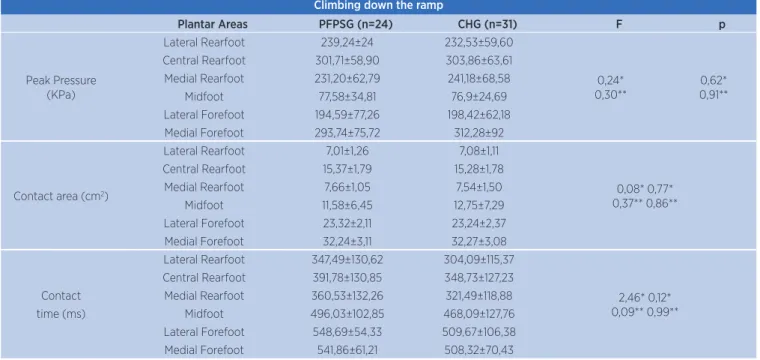
Data regarding peak pressure (KPa), contact area
(cm2), and contact time (ms) in the activities of climbing
up and down the ramp are shown in Table 2. We did not observe group efect or interaction between group and plantar regions in these activities.
(continues)
Table 1. Means and standard deviations for peak pressure (KPa), contact area (cm2), and contact time (ms) in the six plantar regions during the activities of climbing up and down stairs of PFPSG and CHG
Climbing up stairs
Plantar Areas PFPSG (n=24) CHG (n=31) F p
Peak Pressure (KPa)
Lateral Rearfoot 79,34±43,68 71,11±37,98
0,001* 0,77**
0,97* 0,57** Central Rearfoot 129,27±70,59 117,04±64,67
Medial Rearfoot 116,71±67,21 106,19±62,96 Midfoot 104,02±51,85 97,40±28,79 Lateral Forefoot 213,70±85,35 231,67±68,84 Medial Forefoot 264,51±79,06 282,57±80,74
Contact area (cm2)
Lateral Rearfoot 5,42±1,92 5,66±1,63
0,11* 0,07**
0,73* 0,99** Central Rearfoot 13,24±4,07 14,67±2,07
Climbing up stairs
Plantar Areas PFPSG (n=24) CHG (n =31) F p
Lateral Rearfoot 417,18±175,40 393,30±124,30
1,06* 0,07**
0,30* 0,99** Central Rearfoot 443,97±181,66 427,50±121,41
Contact Medial Rearfoot 416,34±182,16 403,37±152,12 time (ms) Midfoot 597,54±99,83 586,61±102,81 Lateral Forefoot 646,54±74,76 624,72±77,30 Medial Forefoot 647,58±74,54 620,78±85,91
Climbing down stairs
Peak Pressure (KPa)
Lateral Rearfoot 68,15±27,12 59,69±30,34
0,28* 0,59* 0,80** 0,91** Central Rearfoot 107,22±46,58 92,37±42,63
Medial Rearfoot 96,32±44,26 85,01±40,66 Midfoot 112,69±39,99 115,32±36,78 Lateral Forefoot 187,52±68,35 203,26±58,63 Medial Forefoot 281,40±91,37 269,94±81,21
Contact area (cm2)
Lateral Rearfoot 5,57±1,82 5,39±1,86
0,04* 0,84* 0,29** 0,91** Central Rearfoot 14,43±2,61 13,72±3,12
Medial Rearfoot 6,90±1,96 6,50±2,50
Midfoot 18,24±6,02 18,95±7,30
Lateral Forefoot 23,54±2,32 23,37±2,56 Medial Forefoot 32,42±3,26 32,42±3,50
Contact time (ms)
Lateral Rearfoot 289,90±179,08 223,76±134,38
1,53* 0,22* 1,19** 0,31** Central Rearfoot 338,67±171,24 280,96±164,32
Medial Rearfoot 311,07±163,57 253,74±159,30 Midfoot 567,53±129,29 547,63±120,07 Lateral Forefoot 621,43±115,38 598,29±100,31 Medial Forefoot 625,03±115,51 599,76±100,32
* Group efect
** Interaction between group and plantar regions
Table 2. Means and standard deviations for peak pressure (KPa), contact area (cm2), and contact time (ms) in the six plantar regions during the activities of climbing up and down the ramp of PFPSG and CHG
Climbing up the ramp
Plantar Areas PFPSG (n=24) CHG (n=31) F p
Peak Pressure (KPa)
Lateral Rearfoot 195,51±43,46 195,56±48,46
2,03* 1,14** 0,15* 0,33** Central Rearfoot 272,29±50,42 283,73±48,37
Medial Rearfoot 228,79±56,39 249,68±65,56 Midfoot 106,03±45,84 107,46±36,56 Lateral Forefoot 259,54±88,18 268,63±88,14 Medial Forefoot 323,122±83,65 369,64±97,99
Contact area (cm2)
Lateral Rearfoot 6,83±1,23 6,87±1,14
0,82* 0,23**
0,77* 0,94** Central Rearfoot 15,01±2,51 15,10±1,82
Medial Rearfoot 7,20±1,48 7,40±1,38 Midfoot 13,77±5,20 13,53±6,40 Lateral Forefoot 23,54±3,50 23,70±2,31 Medial Forefoot 31,80±4,64 32,62±3,30
Contact time (ms)
Lateral Rearfoot 464,64±98,68 418,79±105,97
2,82* 0,98*
0,09* 0,42* Central Rearfoot 538,69±97,71 479,05±11,80
Medial Rearfoot 489,36±107,51 470,41±113,93 Midfoot 474,82±102,02 453,58±85,82 Lateral Forefoot 526,69±90,14 473,74±81,63 Medial Forefoot 501,79±109,93 453,17±101,05
(continues)
In Graph 1 is possible to observe pain intensity (cm) before and after the activities of climbing up and down the ramp and stairs in PFPSG and CHG. We veriied a pain exacerbation in PFPSG after climbing
up and down stairs (p=0.01) and the ramp (p=0.01). On the other hand, CHG subjects did not have pain before or after the performance of functional activities.
Climbing down the ramp
Plantar Areas PFPSG (n=24) CHG (n=31) F p
Peak Pressure (KPa)
Lateral Rearfoot 239,24±24 232,53±59,60
0,24* 0,30**
0,62* 0,91** Central Rearfoot 301,71±58,90 303,86±63,61
Medial Rearfoot 231,20±62,79 241,18±68,58 Midfoot 77,58±34,81 76,9±24,69 Lateral Forefoot 194,59±77,26 198,42±62,18 Medial Forefoot 293,74±75,72 312,28±92
Contact area (cm2)
Lateral Rearfoot 7,01±1,26 7,08±1,11
0,08* 0,77* 0,37** 0,86** Central Rearfoot 15,37±1,79 15,28±1,78
Medial Rearfoot 7,66±1,05 7,54±1,50 Midfoot 11,58±6,45 12,75±7,29 Lateral Forefoot 23,32±2,11 23,24±2,37 Medial Forefoot 32,24±3,11 32,27±3,08 Lateral Rearfoot 347,49±130,62 304,09±115,37
2,46* 0,12* 0,09** 0,99** Central Rearfoot 391,78±130,85 348,73±127,23
Contact Medial Rearfoot 360,53±132,26 321,49±118,88 time (ms) Midfoot 496,03±102,85 468,09±127,76
Lateral Forefoot 548,69±54,33 509,67±106,38 Medial Forefoot 541,86±61,21 508,32±70,43
* Group efect
** Interaction between group and plantar regions
* Statistically higher after the completion of the activity
Graph 1. Comparison of pain intensity (cm) of each group (PFPSG and CHG) before and after the completion of the activities
Climbing up and down stairs PFPSG
Climbing up and down ramp GC PFPSG
GC 4
3.5 3 2.5 2 1.5 1 0.5 0
P
ain intensit
y (cm)
After Before
DISCUSSION
he evaluation of plantar pressure distribution did not show diferences between groups regarding peak pressure, contact area, and contact time in the six plantar regions analyzed at the stage of gait support in functional activities (climbing up and down stairs and the ramp).
Similarly to our study, Aliberti et al.18 analyzed plantar
pressure distribution during the stage of support for climbing down stairs in subjects with PFPS. However, diferently from our indings, the authors observed a contact medially directed in the rearfoot and midfoot as well as smaller plantar loads during the movement of climbing down stairs in subjects with PFPS. he
lowest pressure peaks in these subjects when climbing down stairs were related to an attempt to reduce the patellofemoral joint reaction force, aiming to reduce overload and pain, consequently.
On the other hand, Aliberti et al.17 assessed plantar
pressure distribution in three subphases of the gait support (initial contact, mean support, and propulsion) in subjects with PFPS, observing a initial contact medially directed in the rearfoot and a more lateralized propulsion in the forefoot. Consequently, pronation had to happen in the mean support in a more pronounced way, as evidenced by the increase in the lateral forefoot contact area still at this stage and culminating in a more lateral detachment of the foot and a reduction in the peak pressure in the medial forefoot for propulsion.
Whereas plantar pressure distribution can be inluenced by several factors, such as gait speed,
ground, footwear28, and gender29, some methodological
diferences between this study and those of Aliberti
et al.17,18 may explain conlicting indings between
these authors. In our study, we chose to use a standard
footwear during gait (Moleca® shoe), considering that
most functional activities of daily living are performed with shoes, and our aim was to get the subjects as close as possible to their daily living. On the other hand,
in the studies of Aliberti et al.17,18, subjects wore only
socks during data collection. Additionally, the authors controlled the rhythm of the subjects and consequently their gait speed. In our study, we had no such control, for we believe that this could change any pattern of gait behavior of the subjects. In the studies of Aliberti
et al.17,18, the sample was composed predominantly by
women, but some men participated. In our study, all the participants were women. Regarding gait evaluation,
Aliberti et al.17 analyzed it in three support subphases,
diferently from our study, in which we evaluate it with full support, and this can also have led to diferences in the results between these studies.
hijs et al.2, when investigating risk factors intrinsic
to the development of PFPS in women through the measurement of plantar pressure during gait, veriied the presence of three risk factors related to the gait, which could predispose PFPS development: a more lateralized pressure distribution at the initial contact of the foot, reduction in the time of maximum pressure in
the 4th metatarsus, and delay in the lateromedial change
of the center of pressure (COP) in the forefoot contact during gait. According to the authors, these changes can reduce shock absorption of the foot, transferring
part of the ground reaction force to more proximal joints, including the knee, which result in overload of the patellofemoral joint with consequent increase in patellofemoral pain. However, these indings, although relevant, cannot be generalized to the entire population with PFPS, nor compared directly with our study, since they were carried out with a speciic population (military), and used a diferent instrument (FootScan pressure platform).
In another study, hijs et al.19 assessed the plantar
pressure in barefoot running for non-professional runners, aiming to determine risk factors for the development of PFPS concerning the run. he authors analyzed vertical and mediolateral forces, absolute and relative impulses of eight foot areas, noting a reduction in time to reach the peak of vertical force in the lateral rearfoot and a greater peak of vertical force in the second metatarsus in runners who developed the syndrome, concluding that it is related to an increased impact of initial contact and propulsion during running.
So far, no studies evaluating for subjects with PFPS the plantar pressure distribution in activities such as climbing upstairs, and climbing up and down ramps have been found. Additionally, this was the irst study to assess gait using footwear during functional activities in subjects with PFPS.
During the activity of climbing up and down the ramp, the highest pressure peaks were observed in regions of the medial forefoot, followed by the central rearfoot.
hese data are consistent with Putti et al.30 who, when
assessing the plantar pressure distribution of 53 healthy subjects using Pedar-X, observed higher pressure peak below the hallux and followed by the calcaneus. Nova,
Rodríguez and García28 also investigated the plantar
pressure patterns of healthy subjects through Biofoot
system of instrumented insoles, noting that the 2nd
metatarsal head had higher peak pressure followed, by
heel, 1st and 3rd metatarsus, and hallux.
In our study, in the activities of climbing up and down stairs, highest peaks of pressure were found on medial forefoot and lateral forefoot, which can be explained by the fact that subjects perform this task touching the anterior part of the foot more than the posterior part. hese indings corroborate Aliberti
et al.18, who observed higher pressure peaks in the
activity of climbing upstairs both in subjects with
PFPS and asymptomatic ones; however, according to the observations of this study, we can say that pressure distribution patterns were similar to the activity of climbing down stairs.
he distribution pattern of the contact area observed
in the study of Aliberti et al.18 in the control group
during the activity of climbing down stairs is similar to the one observed in our present study in both groups (CHG and GSDPF) regarding this activity, with greater contact area in the medial forefoot followed by lateral forefoot. On the other hand, in subjects with
PFPS, Aliberti et al.18 found larger contact area in the
medial forefoot followed by midfoot, featuring a more medialized contact of these individuals.
Concerning contact time, Swanson31 found no
diferences in this variable in forefoot, midfoot, and rearfoot between 43 subjects with PFPS and 45 controls evaluated by the author both during gait and
treadmill run. Similarly, hijs et al.2 did not observe
diferences in contact time for militaries who have developed PFPS during their basic training and
those who have not. Aliberti et al.18 did not observe
diferences among subjects with and without PFPS regarding the integral of pressure-time when climbing down stairs in the six plantar regions. According to the authors, since the integral of pressure-time is characterized by the impulse of peak pressure in time, this similarity suggests that contact time may have been higher in the PFPSG. In our study, although there were no signiicant diferences in contact time between the groups, we can verify that values of this variable were higher in subjects with PFPS, suggesting that they perform this activity with greater caution than the control-group subjects.
Several studies have reported that subjects with PFPS adopt diferent strategies, such as lower knee lexion angle, reduction in the knee extensor moment and in ground reaction forces, in addition to reduction in gait speed and rhythm during functional activities to
avoid or reduce their pain levels6,9-11,13,14,32. In our study,
we initially hypothesized that subjects with PFPS could change their walking patterns as a strategy for reducing pain during the performance of functional activities, and this could lead to changes in plantar pressure distribution, reducing contact time and peak pressures of the member with pain in relation to the dominant member of the control group. However, this hypothesis was not conirmed during the study.
However, it is noteworthy that PFPS – for being a multifactorial disease with a wide variety of symptoms and potential etiologies – can be manifested by multiple strategies and compensations in the gait of these subjects, which perhaps could explain the diferent
indings veriied between this study and others2,19,17,18.
hus, it is possible that the subjects of our study adopted other strategies that did not inluence on their plantar pressure distribution patterns, or our instrument was not sensitive and/or speciic enough to detect them during the performance of the functional activities proposed.
Although there is no diference in the pattern and in the intensity of plantar pressure distribution between the groups, we veriied pain exacerbation in subjects with PFPS at the end of the four functional activities.
he activities of climbing up and down stairs were those in which the subjects had higher pain exacerbation (1,4cm) regarding climbing up and down the ramp (0,8cm). he higher pain intensity after climbing up and down stairs is due to the fact that these activities require greater knee lexion than during climbing up and down the ramp. he greatest knee lexion leads to an increase in reaction forces and contact areas in the patellofemoral joint because the angle between the patellar tendon and quadriceps becomes more acute, with the increase in the resulting vector; as the knee lexion increases, the efective lever arms of femur and tibia increase, requiring greater quadriceps activation to
resist the body weight lexion moment33. In this sense,
Chen, Scher and Powers34 found that the patellofemoral
joint loads considerably vary according to the task performed. hey noted higher reaction force peaks of patellofemoral joint on the run, following the activities of climbing up and down stairs and walking.
We considered as limitations of this study the fact that the participants did not performed the baropodometric evaluation simultaneously and synchronized with the range of ankle and knee motion evaluation.
CONCLUSIONS
Additionally, our indings show that functional activities, such as climbing up and down stairs and ramps, exacerbate the pain of subjects with PFPS. herefore, these activities could be used to assess the pain of these individuals, but we suggest caution regarding its use during the treatment.
ACKNOWLEDGEMENTS
We would like to thank physical therapists Marlon Francys Vidmar and Luiz Fernando Bortoluzzi de Oliveira, and the professor of the Program in Physical herapy from UPF Gilnei Lopes Pimentel for the assistance in data collection. Doctors César Antônio de Quadros Martins, André Kuhn, Osmar Valadão Lopes Junior, José Saggin, and Paulo Renato Saggin for conducting patients to our research.
REFERENCES
1. Manske RC, Davies GJ. A nonsurgical approach to examination and treatment of the patellofemoral joint, part 1: examination of the patellofemoral joint. Crit Rev Phys Rehabil Med. 2003;15(2):141-66.
2. Thijs Y, Tiggelen DV, Roosen P, De Clercq D, Vitvrouw E. A prospective study on gait-related intrinsic risk factors for patellofemoral pain. Clin J Sport Med. 2007;17(6):437-45.
3. Alaca R, Yilmaz B, Goktepe AS, Mohur H, Kalyon TA. Eicacy of isokinetic exercise on functional capacity and pain in patellofemoral pain syndrome. Am J Phys Med Rehabil. 2002;81(11):807-13.
4. Fredericson M, Yoon K. Physical examination and patellofemoral pain syndrome. Am J Phys Med Rehabil. 2006;85(3):234-43.
5. Powers CM, Mafucci R, Hampton S. Rearfoot posture in subjects with patellofemoral pain. J Orthop Sports Phys Ther. 1995;22(4):155-60.
6. Brechter JH, Powers CM. Patellofemoral joint stress during stair ascent and descent in persons with and without patellofemoral pain. Gait Posture. 2002;16(2):115-23.
7. Powers CM, Perry J, Hsu A, Hislop HJ. Are patellofemoral pain and quadriceps femoris muscle torque associated with locomotor function? Phys Ther. 1997;77(10):1063-78.
8. Powers CM, Landel R, Perry J. Timing and intensity of vastus muscle activity during functional activities in subjects with and without patellofemoral pain. Phys Ther. 1996; 76(9):946-55.
9. Paoloni M, Mangone M, Fratocchi G, Murgia M, Saraceni VM, Santilli V. Kinematic and kinetic features of normal level walking in patellofemoral pain syndrome: more than a sagittal plane alteration. J Biomech. 2010;43(9):1794-8.
10. Levinger P, Gilleard W. Tibia and rearfoot motion and ground reaction forces in subjects with patellofemoral pain syndrome during walking. Gait Posture. 2007;25(1):2-8.
11. Reis JG, Costa CG, Cliquet Junior A, Piedade SR. Análise cinemática do joelho ao subir e descer escada na instabilidade patelofemoral. Acta Ortop Bras. 2009;17(3):152-4.
12. Grenholm A, Stensdotter A, Häger-ross C. Kinematic analyses during stair descent in young women with patellofemoral pain. Clin Biomech. 2009;24(1):88-94.
13. Crossley KM, Cowan SM, Bennel KL, McConnell J. Knee lexion during stair ambulation is altered in individuals with patellofemoral pain. J Orthop Res. 2004; 22(2):267-74. 14. Nadeau S, Gravel D, Hébert LJ, Arsenault AB, Lepage Y. Gait
study of patients with patellofemoral pain syndrome. Gait Posture. 1997;5(1):21-7.
15. Reis AC, Correa JCF, Bley AS, Rabelo NDA, Fukuda TY, Lucareli PRG. Kinematic and kinetic analysis of the single-leg triple hop test in women with and without patellofemoral pain. J Orthop Phys Ther. 2015;45(10):799-807.
16. Salsich GB, Graci V, Maxam DE. The efects of movement-pattern modiication on lower extremity kinematics and pain in women with patellofemoral pain. J Orthop Sports Phys Ther. 2012;42(12):1017-24.
17. Aliberti S, Costa MSX, Passaro AC, Arnone AC, Hirata R, Sacco ICN. Inluence of patellofemoral pain syndrome on plantar pressure in the foot rollover process during gait. Clin Sci. 2011;66(3):367-72.
18. Aliberti S, Costa MSX, Passano AC, Arnone AC, Sacco IC. Medial contact and smaller plantar loads characterize individuals with Patellofemoral Pain Syndrome during stair descent. Phy Ther Sport. 2010;11(1):30-4.
19. Thijs Y, De Clercq D, Roosen P, Vitvrouw E. Gait related intrinsic risk factors for patellofemoral pain in novice recreacional runners. Br J Sports Med. 2008;42(6):466-71.
20. Powers, CM. Patellar kinematics, Part I: the inluence of vastus muscle activity in subjects with and without patellofemoral pain. Phys Ther. 2000;80(10):956-64.
21. Tumia N, Mafulli N. Patellofemoral pain in female athletes. Sports Med Arthrosc. 2002;10(1):69-75.
22. Cowan SM, Bennell KL, Hodges PW. Therapeutic patellar taping changes the timing of vasti muscle activation in people with patellofemoral pain syndrome. Clin J Sports Med. 2002;12(9):339-47.
23. Loudon JK, Wiesner D, Goist-Foley HL, Asjes C, Loudon KL. Intrarater reliability of functional performance tests for subjects with patellofemoral pain syndrome. J Athl Train. 2002;37(3):256-61.
24. Cabral CMN, Melim AMO, Sacco ICN, Marques AP. Fisioterapia em pacientes com Síndrome Fêmoro-Patelar: Comparação de exercícios em cadeia cinética aberta e fechada. Acta Ortop Bras. 2008;16(3):180-5.
25. Laprade J, Culham E, Brouwer B. Comparison of ive isometric exercises in the recruitment of the vastus medialis oblique in persons with and without Patellofemoral Pain Syndrome. J Orthop Sports Phys Ther. 1998;27(3):197-204.
measurement during free ambulation. Gait Posture (abstracts). 1997;5(2):165.
27. Lara-Muñoz C, De Leon SP, Feinstein AR, Puente A, Wells CK. Comparison of the three rating scales for measuring subjective phenomena in clinical research I. Use of experimentally controlled auditory stimuli. Arch Med Res. 2004;35(1):43-8. 28. Nova AM, Rodríguez RS, García JCC. Patrón de presiones
plantares en el pie normal: análisis mediante sistema Biofoot de plantillas instrumentadas. Rev Esp Cir Ortop Traumatol. 2008;52(2):94-8.
29. Putti AB, Arnold GP, Abboud RJ. Foot pressure diferences in men and women. Foot Ankle Surg. 2010;16(1):21-4.
30. Putti AB, Arnold GP, Cochrane L, Abboud RJ. The Pedar in-shoe system: repeatability and normal pressure values. Gait Posture. 2007;25(3):401-5.
31. Swanson KJ. A clinical and biomechanical proile of female athletes with and without Patellofemoral Pain. [Dissertação]. Minessota: Faculty of the Graduate School, University of Minnesota; 2009.
32. Salsich GB, Brechter JH, Powers CM. Lower extremity kinetics during stair ambulation in patients with and without patellofemoral pain. Clin Biomech. 2001;16(10):906-12.
33. Fulkerson JP. Patologia da articulação patelofemoral. 3ª ed.
Rio de Janeiro: Revinter; 2000.