Licence
Creative Commom CC
RBCDH
1 University Bourgogne Franche--Comte. EA 4660 Culture Sport Health Society. Plateforme EPSI. Besancon, France.
2 University Bourgogne Franche-Comte. FDE EA4267, (FHU INCREASE ou Labex LipSTIC ou autre), Service ou lab. hospitalier. Besancon, France.
3 University Hospital of Besancon. Laboratoire d’exploration fonc-tionnelle clinique du mouvement. Besancon, France.
4 University Hospital of Besancon. Centre d’Investigation Clinique. Besancon, France.
Received: 20 August 2014 Accepted: 11 March 2015
Accuracy of the Suunto system for heart
rate variability analysis during a tilt-test
Acurácia do sistema Suunto para a análise da
variabilidade da frequência cardíaca durante um teste
de inclinação
Anthony Bouillod1
Johan Cassirame1
Jean Marc Bousson2
Yoshimasa Sagawa Jr3,4
Nicolas Tordi2,4
Abstract– he aim of this study was to assess the accuracy of the Suunto Memory Belt
(SMB) heart rate (HR) recorder compared with that of a standard electrocardiogram system (ECG) and compared the heart rate variability (HRV) analyses conducted with each dataset. Heart rate was simultaneously recorded using ECG and SMB in iteen participants [mean (SD) age 27.3 (13.9) years, height 177.4 (10.2) cm and body mass 66.8 (15.3) kg] during an orthostatic tilt test. he two datasets were analysed to compare the number and type of R-R interval artefacts and indices from HRV (RMSSD, pNN50, HF, LF, SD1, and SD2). For artefact detection, 16,742 R-R intervals were analysed during all recordings. Only 18 artefacts, 9 type 1 (long R-R interval) and 9 type 2 (short R-R inter-val), were identiied with the SMB. Bland-Altman analysis indicated excellent accuracy for the SMB, with limits of agreement of -2.00 and +1.94 ms. Further, the reference and SMB systems were strongly correlated. he similarity between each device indicated that the SMB could reliably record R-R intervals.
Key words: Heart rate; Physiology; Validation studies.
Accuracy of the Suunto system Bouillod et al.
INTRODUCTION
he variability of R-R intervals, the period between 2 successive R-peaks of the QRS complex, is the basis for calculating heart rate variability (HRV). HRV analysis is a non-invasive tool used to assess the impact of the para-sympathetic and para-sympathetic systems on the heart. Since the studies of Sayers1, 40 years ago, HRV has been used in sports science to prevent or
detect overtraining2-4. he basic principle of HRV monitoring is to infer
possible changes in cardiac autonomic nervous system (ANS) status with training with repeated HRV assessments over the time. ANS status can be explored via HRV assessments in various situations (at rest, awake, asleep, during or ater exercise). he physiological determinants of resting HRV are related to genetics, plasma volume, autonomic activity and body position5-8.
Moving from the supine to standing posture results in the translocation of 300-800 ml of blood from the central intravascular compartment to dependent regions in the legs, buttocks, pelvis and splanchnic circulation. his orthostatic stress evokes a sequence of compensatory cardiovascular responses to maintain homeostasis. he sympathetic nervous system, para-sympathetic nervous system and barorelex play a role in this homeostatic response9. Because an HRV test is very simple to perform, it can easily
be used for advanced detection of an acute tiredness state or indicate an overtraining state10.
During the last 2 decades, technological advances produced a number of portable devices that may reliably, accurately, and easily record R-R intervals. he use of HRV requires accurate measuring devices and a rig-orous method of treatment and analysis as deined by the Task Force of European Society of Cardiology and the North American Society of Pac-ing and Electrophysiology11. To ensure the validity of HRV analysis, these
portable devices are usually compared with traditional electrocardiogram (ECG) systems12-13. However, in many situations, these conditions and
recommendations are not followed.
he quality of heart rate recording and subject activity during the recording may compromise the interpretation of the HRV analysis due to body motions or other external electronic or mechanical stimuli. he poor quality of the signal may in turn afect HRV parameters14-16.
Powerlab, ADInstruments, Castell Hill, Australia) during an active or-thostatic tilt-test and to verify the consistency of HRV data obtained with the SMB system during a standard test.
METHODOLOGICAL PROCEDURES
Subjects
To assess the accuracy of the SMB system, a total of 15 subjects, 13 men and 2 women [mean (SD) age 27.3 (13.9) years, height 177.4 (10.2) cm and body mass 66.8 (15.3) kg], with no known cardiovascular disease volunteered for this study. All participants took part in regular recreational sports, were in good health and were not taking any medication. We intentionally selected subjects with several anthropometrical and physical conditions to compose a heterogeneous sample to evaluate measures from the SMB and ECG in a potentially wide range of heart interval variability. Prior to testing and ater receiving a full explanation concerning the nature and purpose of this study, the subjects provided written informed consent. his study was conducted in accordance with the Declaration of Helsinki18 and
approved by the Human Research Ethics Committee ‘CPP EST II’ (Protocol reference: 12/667).
Experimental Design
he subjects underwent an active tilt test in the laboratory. First, the subjects were equipped with two devices. hree self-adhesive ECG electrodes were placed on both clavicles and the lower let ribcage. To register R-R intervals using the SMB, an elastic belt was ixated to the chest of the volunteer at the lower end of the sternum. hen, the subjects maintained a supine posi-tion for 8 minutes on a common bed, followed by a standing posiposi-tion for 8 minutes. Respiratory rate was not controlled because the HRV assessment was performed simultaneously with both systems.
Data Acquisition
R-R intervals were recorded simultaneously with the following two devices.
• PowerLab: ADInstruments products are designed, manufactured and serviced under the internationally recognized ISO9001: 2008 quality management system. Powerlab is a stationary ECG system equipped by an analog-digital converter (ADC) used to digitalize all signals. he digital signals were then transferred to a PC and analysed using LabChart sotware (version 7) with the peak analysis module.
Accuracy of the Suunto system Bouillod et al.
analysing at a later time with Kubios HRV analysis sotware, 2.0, for Windows (Biomedical Signal and Medical Imaging Analysis Group, Department of Applied Physics, University of Kuopio, Finland). his sotware is distributed free of charge upon request (http://venda.uku. i/research/biosignal).
Data Analysis
The ECG signal was collected using LabChart 7. R-peaks were detected with a cyclic measurement using a human ECG model, and R-R inter-vals were exported to a Microsoft Excel spreadsheet for comparison. Recordings from the SMB were transferred to a computer and analysed with the Kubios HRV analysis software. R-R intervals were exported in the same manner as the ECG signal. Data synchronization from both devices was performed with a temporal event marker (30 sec of apnoea) prior to the supine position period, using the shorter recorded R-R interval. After synchronization, the R-R intervals recorded via the SMB were visually examined for artefacts. Artefacts were detected throughout the measurement session and differentiated according to type. The first type of artefact (A1) occurs when a beat is ~30% longer than the previous qualified interval value19. The second type of
artefact (A2) occurs when noise is considered as a beat, resulting in 2 or more short R-R intervals (30% shorter than the previous qualified interval value).
For HRV analysis, the same recording periods of 256 beats collected with each device during supine and standing conditions were analysed.
In the time domain, we compared RMSSD (square root of the mean squared diferences of successive R-R intervals) and pNN50 (proportion derived by dividing NN50 by the total number of R-R intervals, where NN50 is the number of interval diferences of successive R-R intervals greater than 50 ms). In the frequency domain, low frequency (LF) was considered 0.04-0.15 Hz, and high frequency (HF) was considered 0.15-0.5 Hz. he absolute power in each of these frequencies was compared. In the nonlinear domain, we compared the SD1 and SD2 parameters.
Statistical Analysis
Each entire recording was compared with the Bland-Altman method20,
which involves plotting the discrepancy between the 2 diferent measure-ment techniques of the same signal on the y-axis against the value of the reference method (ECG R-R interval) on the x-axis. he Bland-Altman method enables calculation of the limits of agreement, including 95% of all discrepancies, according to the following formula:
Lower limit = M – 1.96 * SD Upper limit = M + 1.96 * SD
used a paired t-test to identify systematic diferences in R-R intervals or HRV indices between systems. Efect size (ES), which represents the ratio of the mean diference over the pooled variance21, was used to estimate
the magnitude of the diference. As proposed by Cohen (1998), the difer-ence was considered small when ES ≤ 0.2, moderate when ES ≤ 0.5 and
large when ES > 0.8. All calculations were performed with Sigmaplot 12.0
(Systat Sotware Inc., Chicago, USA).Statistical signiicance was set at P = 0.05 for all analyses.
RESULTS
Fiteen subjects completed the entire testing procedure. For artefacts detec-tion, 16,742 R-R intervals were analysed during all recordings. No artefacts were produced with ECG during either position. With SMB, 18 errors were identiied, 9 A1 and 9 A2 errors.
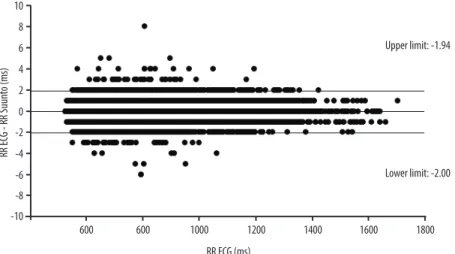
he Bland-Altman comparison (Figure 1) between the R-R intervals from each device in the supine and standing positions indicated strong agreement for all individual data. During the entire recording free from artefacts (mean R-R, 842.4 ± 193.0 ms), the accuracy analysis had limits of agreement of -2.00 and 1.94 ms.
Figure 1. Bland-Altman plot to compare the means R-R intervals with SMB and ECG.
Accuracy of the Suunto system Bouillod et al.
Figure 2 depicts an example of the synchronised R-R interval data during the entire recording.
Figure 2. The graph shows synchronised R-R data measured by SMB and ECG systems for a typical subject.
DISCUSSION
his study analysed the accuracy of the SMB for measuring R-R intervals compared with an ECG signal using a stationary standard system and investigated the validity of the heart rate variability analysis using data collected with the SMB.
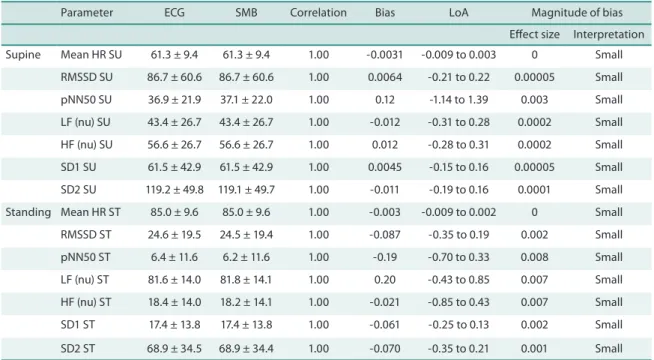
Table 1. HRV parameters obtained from the ECG and SMB signals (mean ± SD), correlation between ECG and SMB parameters, bias, magnitude of bias, and limits of agreement (LoA) in supine and standing positions.
Parameter ECG SMB Correlation Bias LoA Magnitude of bias
Efect size Interpretation
SMB does not transmit because the data are recorded and stored in an integrated memory chip, which appears to be essential for HRV analysis because wireless transmission can increase artefact production and re-duce tachogram accuracy. he error rate in detecting the R-peak for SMB compared with ECG was 0.11%, which makes it more reliable than other systems analysed in previous studies, which have reported error rates of
0.32-2.8%22,23. Among the eighteen total errors using SMB, 50% were A1,
and 50% were A2; no artefacts were observed with ECG. Artefacts can contaminate the bio-signals related to heart rate while measuring these
signals, and the R-R interval data can be missed14-16. he importance of R-R
series editing prior to analysis is oten overlooked11. Moreover, the presence
of a single ectopic beat over a 5-min recording can modify common HRV
indices up to 50%24. Because these diferences might not relect real changes
in ANS status, proper editing of the R-R series prior to analysis is crucial. Concerning the validity of the SMB, our results showed a strong rela-tionship between the R-R intervals extracted from ECG signal collected with Powerlab system and the R-R intervals extracted from the SMB device.
Furthermore, these results are in agreement with the literature10, 17. A small
efect size was reported between the R-R intervals measured with both systems. Considering all R-R measured (16,742), low and high limits of agreement were -2.00 ms and +1.94 ms, respectively. he narrow conidence interval suggests that the SMB is a valid tool for measuring R-R intervals.
All parameters estimated using the SMB and ECG signals were strongly correlated (r > 0.99, P < 0.05) in each position. he magnitude of the bias was lower than 0.2 for all parameters, conirming this very slight difer-ence17. We found that the SMB was a very reliable portable device able to
provide many data necessary to optimize analyses. Although non-linear analyses provide quantitative information on the regularity and complexity of autonomic cardiovascular control, linear analyses are most commonly reported in the literature. Time-domain approaches are based on calcula-tions derived from the direct measurement of R-R intervals or diferences between successive R-R intervals11. Frequency-domain variables are based
on spectral analysis of R-R intervals. Power spectral density decomposes R-R intervals into their fundamental frequency components and provides information on the distribution of power as a function of frequency. LF ranges from 0.04-0.15 Hz and relects the aggregate inluences of both sympathetic and parasympathetic branches of the ANS25, 26. HF ranges
from 0.15-0.40 Hz and represents parasympathetic activity26, 27. Very low
Accuracy of the Suunto system Bouillod et al.
ECG signal. Further, reduction of the duration of analytical epochs used to compute aggregated HRV indices across the epochs might yield diferent values. hese decisions have important implications and must be carefully considered, especially for time-domain variables28.
To use SMB during exercise or sport competitions, ield testing sessions should be performed to ensure that laboratory results are transferable to detect thresholds and assess the impact of training load.
CONCLUSIONS
his study assessed the accuracy of the SMB HR recorder, a simple system that enables R-R interval recording without transmission to a receiver. We conclude that this tool is very accurate for assessing changes in ANS, similar to a standard ECG system. Indeed, the low percentage of artefacts, narrow LoA, very good correlation and small efect size support the use of the SMB to measure HRV in supine and standing positions. Although this study was focused on sport applications, HRV can be used in a very large population and under diferent conditions. Further studies are required to compare systems with no receiver and systems with a receiver in more eco-logical situations. Because HRV analyses depend on tachogram accuracy, using the most accurate system is necessary. hus, comparisons between systems and under environmental conditions can provide information to improve the quality of analyses.
REFERENCES
1. Sayers BM. Analysis of heart rate variability. Ergonomics 1973; 16(1):17-32
2. Hedelin R, Kentta G, Wiklund U, Bjerle P, Henriksson-Larsen K. Short-term over-training: efects on performance, circulatory responses, and heart rate variability. Med Sci Sports Exerc 2000; 32(8):1480-4
3. Mourot L, Bouhaddi M, Perrey S, Cappelle S, Henriet MT, Wolf JP, et al. Decrease in heart rate variability with overtraining: assessment by the poincaré plot analysis. Clin Physiol Funct Imaging 2004; 24(1): 10-18
4. Baumert M, Brechtel L, Lock J, Hermsdorf M, Wolf R, Baier V. Heart rate vari-ability, blood pressure varivari-ability, and barorelex sensitivity in overtrained athletes. Clin J Sport Med 2006; 16(5):412-7
5. Achten J, Jenkendrup AE. Heart rate monitoring applications and limitations. Sports Med 2003; 33(7): 517-38.
6. Aubert AE, Seps B, Beckers F. Heart rate variability in athletes. Sports Med 2003; 33(12): 889-919.
7. Sandercock GR, Brodie DA. he use of heart rate variability measures to assess autonomic control during exercise. Scand J Med Sci Sports 2006; 16(5):302-13.
8. Bosquet L, Merkari S, Arvisais D, Aubert AE. Is heart rate a convenient tool to monitor over-reaching? A systematic review of the literature. Br J Sports Med 2008; 42(9):709-14.
9. Freeman R. Assessment of cardiovascular autonomic function. Clin Neurophysiol 2006; 117(4):716-30
Corresponding author
Anthony Bouillod
EA 4660 «Département Culture Sport Santé Société», University of Franche-Comte, Besancon, France.
LAAS-CNRS, N2IS, Toulouse, France French Cycling Federation, Montigny Le Bretonneux, France
email: [email protected]
physiological interpretation and clinical use. Circulation 1996; 93(5):1043-65
12. Gamelin FX, Berthoin S, Bosquet L. Validity of the polar S810 heart rate monitor to measure R-R intervals at rest. Med Sci Sports Exerc 2006; 38(5):887-93
13. Cassirame J, Tordi N, Mourot L, Rakobowchuk M, Regnard J. L’utilisation d’un nouveau système d’enregistrement de fréquence cardiaque battement à battement pour l’analyse traditionnelle de variabilité de fréquence cardiaque. Sci Sports 2007; 22(5): 238-242
14. Kim KK, Lim YG, Kim JS, Park KS. Efect of missing RR-interval data in the time domain. Physiol Meas 2007; 28(12):1485-94
15. Kim KK, Kim JS, Lim YG, Park KS. he efect of missing RR-interval data on heart rate variability analysis in the frequency domain. Physiol Meas 2009; 30(10): 1039-50
16. Kim KK, Baek HJ, Lim YG, Park KS. Effect of missing RR-interval data on nonlinear heart rate variability analysis. Comput Methods Programs Biomed 2012;106(3):210-8.
17. Weippert M, Kumar M, Kreuzfeld S, Arndt D, Rieger A, Stoll R. Comparison of three mobile devices for measuring R-R intervals and heart rate variability: Polar S810i, Suunto t6 and an ambulatory ECG system. Eur J Appl Physiol 2010; 109(4): 779-86
18. Harriss DJ, Atkinson G. International Journal of Sports Medicine-ethical stand-ards in sport and exercise science research. Int J Sports Med 2009; 30(10): 701-702
19. Tulppo MP, Makikallio TH, Takala TE, Seppanen T, Huikuri HV. Quantitative beat-to-beat analysis of heart rate dynamics during exercise. Am J Physiol Heart Circ Physiol 1996; 271(1): 244-252.
20. Bland JM, Altman DG. Comparing methods of measurement: why plotting dif-ference against standard method is misleading. Lancet 1995; 346(8982):1085-7.
21. Cohen J. Statistical Power Analysis for the Behavioral Sciences. Hillsdale: Lawrence Erlbaum Associates; 1988.
22. Ruha A, Sallinen S, Nissila S. A real time microprocessor QRS detector system with a 1ms timing accuracy fot the measurement of ambulatory HRV. IEEE Trans Biomed Eng 1997; 44(3):159-67.
23. Kingsley M, Lewis M J, Marson R E. Comparison of polar 810s and ambulatory ECG system for RR interval measurement during progressive exercise. Int J Sports Med 2005; 26(1): 39-44.
24. Bucheit M. Monitoring training status with HR measures: do all roads lead to Rome? Front Physiol 2014;5:73.
25. Akselrod S, Gordon D, Ubel FA, Shannon DC, Barger AC, Cohen RJ. Power spectrum analysis of heart rate luctuation: a quantitative probe of beat-to-beat cardiovascular control. Science 1981; 213(4504):220-2.
26. Berntson GG, Bigger JT, Eckberg DL, Grossman P, Kaufmann PG, Malik M, et al. Heart rate variability: origins, methods, and interpretive caveats. Psychophysiol-ogy 1997;34(6):623-48.
27. Pomeranz B, Macaulay RJB, Caudill MA, Kutz I, Adam D, Gordon D, et al. As-sessment of autonomic function in humans by heart rate spectral analysis. Am J Physiol 1985; 248 (1 Pt 2):H151-3.