Comparative study of image quality and entrance
and exit air kerma measurements on chest phantom
utilizing analog and CR digital imaging systems*
Estudo comparativo da qualidade da imagem e do kerma, de entrada e de saída, em simulador de tórax utilizando sistemas analógico e digitalizado CR de aquisição de imagensRenata Matos da Luz1, Gabriela Hoff2
OBJECTIVE: The process of migration from analog to digital imaging system requires specific attention to preserve images quality and minimizing the dose to the patients. The present study was aimed at analyzing and comparing images quality and entrance and exist air kerma measurements in a non-anthropomorphic chest phantom with analog and CR digital imaging systems. MATERIALS AND METHODS: Two different X-ray units (Siemens and Emic) with different wave rectification systems (12-pulse and high-frequency) were utilized in a single institution along the process of migration from analog to CR digital imaging system. Images were acquired on films and image plates. RESULTS: An increase on the X-ray tube peak voltage and/or load was observed in the migration from analog to CR digital system to preserve the diagnostic quality of the image. As a result, an increase in the air kerma rate was observed. CONCLUSION: The greatest differences (increase in dose and decrease in image quality) were observed with the 12-pulse wave rectification system with the CR image transducer (imaging plates).
Keywords: Computed radiography; Image quality; Air kerma.
OBJETIVO: O processo de migração de sistemas analógicos para digitalizados, para aplicações diagnósti-cas, requer cuidados específicos, a fim de manter a qualidade das imagens e minimizar a dose no paciente. Este trabalho tem como objetivo analisar e comparar a qualidade da imagem e o kerma num simulador não antropomórfico de tórax gerados por sistemas analógicos e digitalizados CR. MATERIAIS E MÉTODOS: Foram analisados a qualidade da imagem e o kerma, de entrada e saída, no simulador para dois equipamentos de raios X diferentes (Siemens e Emic), com diferentes sistemas de retificação de onda (12 pulsos e alta frequên-cia). Ambos os sistemas (analógico e digitalizado) estavam sendo utilizados no mesmo local. Foram geradas imagens em filme e em image plates. RESULTADOS: Foi observado aumento na tensão e/ou na carga trans-portada pelo tubo de raios X quando houve a migração para o sistema CR, para manutenção das caracterís-ticas diagnóscaracterís-ticas da imagem. Isto resultou em aumento de kerma coletado. CONCLUSÃO: As maiores di-ferenças determinadas (aumento de dose e redução da qualidade da imagem) foram observadas no equipa-mento com retificação de onda de 12 pulsos e transdutor de imagem CR (image plates).
Unitermos: Radiografia computadorizada; Qualidade da imagem; Kerma. Abstract
Resumo
* Study developed at Pontifícia Universidade Católica do Rio Grande do Sul (PUCRS) – Faculdade de Física, Porto Alegre, RS, Brazil.
1. Graduation, Medical Physics, Pontifícia Universidade Cató-lica do Rio Grande do Sul (PUCRS) – Faculdade de Física, Porto Alegre, RS, Brazil.
2. PhD, Professor TI 40 at Pontifícia Universidade Católica do Rio Grande do Sul (PUCRS), Porto Alegre, RS, Brazil.
Mailing address: Dra. Gabriela Hoff. Avenida Ipiranga, 6681, Prédio 10, Sala 207, Partenon. Porto Alegre, RS, Brazil, 91629-900. E-mail: [email protected] / [email protected]
Received August 17, 2009. Accepted after revision Novem-ber 13, 2009.
the images generated in this system, with the possibility of manipulating images with the preprocessing of the digital signal. However, this capability may actually hide technical mishaps and cause a dose in-crease in the patient for a certain technique. Thus the need emerged to acquire new knowledge, concepts and to change exist-ing procedures; that is to say that an entirely new set of problems is waiting for solu-tions. The patient absorbed dose is a vari-able to be managed in each system, as the manipulation of generated images may mask excessive doses. Additionally, the different technologies of the currently Luz RM, Hoff G. Comparative study of image quality and entrance and exit air kerma measurements on chest phantom utilizing analog and CR digital imaging systems. Radiol Bras. 2010;43(1):39–45.
with the objective of replacing the tradi-tional radiographic film. Since then, the need to reduce radiation dose while en-hancing contrast with low noise levels has encouraged the research for new storage systems for latent diagnostic images. The substitution of radiography with image in-tensifiers by computed systems brought many operational advantages, such as the electronic images storage and image post processing.
In the field of computed radiography, the concept of diagnostic image quality acquires a new meaning and interpretation due to the unique and dynamic attributes of
INTRODUCTION
In 1980, Fuji Film® from Japan
available digitized systems have highly differentiated signal conversion efficien-cies and resolutions and may bring about a dose increase (intrinsic to each technol-ogy) particularly as compared with a film-based system.
Because of such these differences in-trinsic to the digital imaging technology, an appropriate calibration of these systems is critical to obtain the lowest dose required to achieve diagnostic image quality and thus benefiting from the advantages of this technology. Some authors, among them Souza et al.(1), have published studies on this subject.
The present study was idealized and developed during the period of migration from the analog to the CR digital imaging system, with the objective of analyzing and comparing images quality and measure-ments of entrance and exit air kerma in a non-anthropomorphic chest phantom dur-ing procedures performed with both imag-ing systems. It also proposes a simple com-parative method between different images that can be adapted to calibrate the digital systems in the migration process, as well as comparing both systems regarding im-age quality and external dosimetry.
MATERIALS AND METHODS
Two different X-ray apparatuses, both at the same hospital in the city of Porto Alegre, RS, Brazil, were utilized during the transition from the analog to the computed radiology (CR) imaging system. One of the units is a Siemens Iconos model, which comprises a generator with a high-fre-quency wave rectifier, and the other is a non identified model manufactured by Emic, with a generator with a medium fre-quency wave rectifier (12 pulses). The phases in the data acquisition process were the following: assessment of equipment and instruments; checking of quality tests of the equipment; image acquisition fol-lowing parameters recommended in the adopted literature(2); digitization of all ob-tained images to carry out the quality pa-rameter calculations; study of the cata-logued and emitted mean spectra for the characteristics of the X-ray equipment and their implications on the image quality and absorbed dose. The quality control tests
performed demonstrated that the equip-ment was in compliance with Brazilian standards and appropriately operational.
The analog image processing system comprised a model MX-2 Macrotec pro-cessor, whose standard development tem-perature was 33.4°C. The images were ac-quired one day after flushing and substitu-tion of development chemicals utilized in such processor. The cassette utilized was manufactured by Konex, with 35 × 43 cm2
in size. Films and development chemical solutions were manufactured by Kodak.
The digitized system, by its turn, was comprised by a CR 950 Kodak multicas-sette system, a Kodak DryView 8900 laser imaging system with Kodak films, and a Kodak cassette with imaging plate measur-ing 35 × 43 cm2. Images acquisition was
performed with a polymethylmetacrilate (PMMA) non-anthropomorphic chest phantom measuring 30 × 30 × 20 cm3.
The PMMA phantom has the thickness to present an optical density similar to that of a standard adult patient. An aluminum bar (Al) measuring 30.0 × 2.0 × 1.0 cm3 was
added to the phantom in an appropriate slot provided for such purpose in order to simu-late absorption and scattering by the spine. The images were acquired with both X-ray systems with the same exposure factors, equal focus–film distance and the same positioning adopted for chest radiography, as established in the usual literature on ra-diographic techniques(2). The exposure fac-tors were varied until the generated images acquired a similar visual contrast, as fol-lows: 102 kVp and 2 mAs, 102 kVp and 4 mAs and 117 kVp and 4 mAs, all of them with 200 mA anodic current (gross focus) at a distance of 1.5 m of the film focal point. With such exposure factors, three images were generated with the analog system and three others in the CR digital system, for each one of the apparatuses.
With a view to the clinical applications of the present study, based on the principles of radiological protection and the applica-tion of the ALARA principle, it is not pos-sible to separate the patient absorbed dose from the radiographic technique during the radiological procedure. In other words, an application to evaluate and/or improve the diagnostic quality of the image will only be valid when the dose to which the patient is
exposed, is the lowest possible, while maintaining the quality criteria for diagnos-tic imaging. For this reason, exposure mea-surements were performed during proce-dures simulations with a duly calibrated Radcal 9010 ionization chamber. The chamber was aligned with the focal point on the acquisition geometry. Two measure-ments were performed, one at the primary beam entrance surface, and the other at the primary beam exit surface of the phantom. This way, the phantom entrance and exit air kerma were determined.
The films containing the acquired im-ages were digitized on a Microtek, Scan-Maker 1000 XLscanner specific for films. The images were digitized in 16 bits and 300 dpi with minimum parameters for con-trast, brightness, enhancement and shad-ows, so that no image characteristics were altered. After digitization, all the images were converted into the DICOM format (Digital Imaging Communications in Medi-cine). The images acquired with the CR digital system were saved and processed without addition of any filters, by the Kodak system.
Quality parameters represent a way to evaluate digital images quality(3). The main factors affecting digital image quality in-clude: resolution, signal intensity, contrast, noise and signal-noise ratio. The values of these descriptors were obtained for each image by means of the Java public domain software ImageJ(4) for the development of applications for image processing and analysis. With this software,after selection of a region of interest (ROI), the area, mean, and standard deviation (SD) of the signal were obtained, as they play an essential role in the image quality parameters calculation. An approximately constant circular ROI was defined for all the images, over the simulated pulmonary field and over the region of the spine simulation.
The contrast in the radiographic image is defined as the signal difference between two adjacent regions on the film. It is di-rectly dependent upon the subject contrast(a)
(irradiated material), reflecting differences between atomic numbers, electrons density,
(a) Subject contrast is defined as the difference in
and thickness of the material of which the image is generated, as well as the charac-teristics of the energy spectrum of the emit-ted radiation beam(5–7). As an example, the measurement of radiation flow (F) between two adjacent regions of a patient, F1 and F2, such flows being different because of distinctive tissues constitution. Thus, the image contrast(b) (IC) may be measured as
the difference in signal intensity (S), where S represents the mean ROI value, between two areas on the film or on the digital im-age, divided by the signal from the ROI area of interest , as shown in equation 1.
CI = (S2 – S1) / S1 (1)
Noise is the main factor limiting the digital image contrast; it is a signal that interferes in homogeneity, reducing the contrast. It is frequently defined as uncer-tainty in a signal due to random fluctua-tions of such signal(8,10). Possible causes for such fluctuations are originated in the sta-tistical nature of the radiation beam emerg-ing from the tube, whose number of pho-tons emitted by time unit varies either as a Gaussian or Poisson distribution(10). Other random fluctuation sources are introduced by the process of radiation attenuation by mater, which also follows a Poisson distri-bution, besides the fact that the electronic system introduces noise because of the electronic binary processing(10).
The SD is the most appropriate variable to characterize the noise in an image sys-tem, as it quantifies an image pixel values variation around a mean value(10), being determined for a Poisson distribution, ac-cording to equation 2.
SD = (S)–1/2 = standard deviation
of the signal of ROI (2)
In the present study, the ROI SD was utilized as being representative of the im-age noise, besides the above estimate pre-sented on equation 2. Based on the distri-bution of the signal intensity frequency chart, the SD was calculated as being the uncertainty of the values of signal intensity around a mean value. Equation 2 represents the mean number of pixels at the ROI.
In order for the noise to have a physical meaning, it is associated with a signal at the ROI, so that it is utilized in the definition of the signal noise ratio (SNR). SNR de-scribes a relation between the mean signal value and the variation around this mean value. By means of this descriptor, it is possible to define the efficiency of the image acquisition system. Equation 3 dem-onstrates the SNR.
SNR = S / SD (3)
The images were also analyzed by means of their histograms, which are graphi-cal representations of the frequency distri-bution as a function of the signal(3). They are statistical functions of the image, which at each level of gray scale, calculates the number of pixels in that particular gray scale level, so that the image contrast is determined by the window width and by the brightness level on the histogram.
The increase in the window width de-creases the contrast, but inde-creases the pos-sibility of representing a higher number of gray tones that can be seen by the “naked eye”, while the increase in level increases the brightness(10).
RESULTS
The results comprise data that were evaluated based on the image characteris-tics (Table 1) and on collected air kerma data.
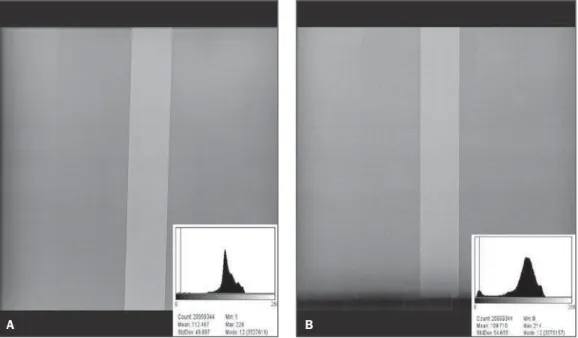
The CR digital system images that pre-sented best visual contrast and have visu-ally similar characteristics for the two types of equipment were those acquired with exposure factor of 117 kVp with 4 mAs. For that reason, images obtained under such technical conditions were analyzed in particular.
Figures(c) 1 and 2 compare the images
obtained in the two apparatuses, for both analyzed systems.
Another point to be considered, besides patient absorbed dose, is the fact that in order to generate an image in the studied CR digital imaging system, a greater pho-tons flow was necessary as compared with
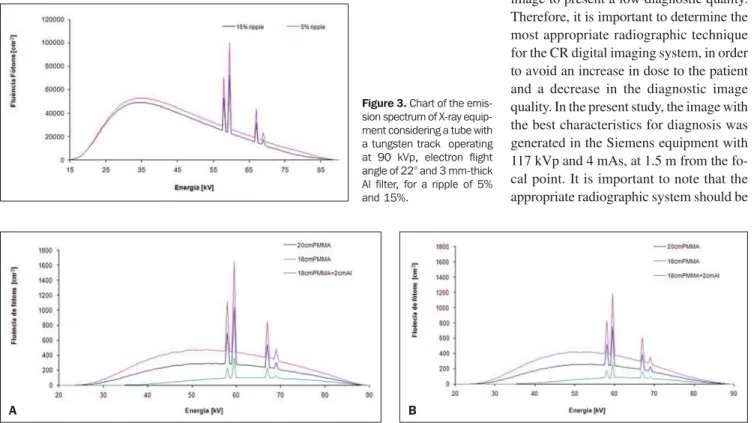
the analog system for a given exposure in-dex. An analysis of the photon spectra may assist in the understanding of the differ-ences between the two apparatuses and the different responses for each image trans-ducer. For this purpose, the charts pre-sented on Figures 3 and 4 show, retively, the X-ray equipment emission spec-trum, considering a tube added of a tung-sten track operating at 90 kVp, angle of electron flight of 22° and a 3 mm-thick Al filter, for a ripple of 5% and 15%, and the different filtrations for spectra with differ-ent ripples(11).
DISCUSSION
Based on the data presented on Table 1, considering the images generated on the Siemens equipment with the analog sys-tem, the signal was reduced from 15.6 to 3.0 after the increase in the tube voltage from 102 kVp to 117 kVp, with a constant tube current at 4 mAs. In this system, with the increase in voltage and in transported load, a signal reduction of 527% of the initial value was observed. For the CR digi-tal imaging system, the signal value was 114% lower for the voltage of 117 kVp as compared with the lowest voltage of 102 kVp, with the highest signal value being 35.9. On the other hand, with respect to the images generated with the Emic equip-ment, the analog processing resulted in a signal increase of 247% with the duplica-tion of the load transported in the tube, since for the factors 102 kVp and 2 mAs the signal value was 6.4, while for 102 kVp and 4 mAs that value was 15.8, an increase of 186%, with the tube voltage increase. The signal values for the exposure factors of 102 kVp and 2 mAs and 117 kVp and 4 mAs were, respectively, 6.4 and 29.4. For the Emic equipment and the CR digital imaging system, the signal increased 107%, with the duplication of mAs, where the sig-nal value for 104 kVp and 2 mAs was 35.5, and for 102 kVp and 4 mAs, was 37.9. A reduction of 112% of the initial signal value was observed when the tube voltage was increased from 102 kVp to 117 kVp. Thus, in the case of analog image processing, SNR increased with transported load and was reduced with the increase in voltage. On the other hand, in the CR signal trans-(b) Image contrast shall here be understood as being the
result of the interaction between the contrast of the ob-ject and that of the signal transducer.
(c)The presented images did not undergo any
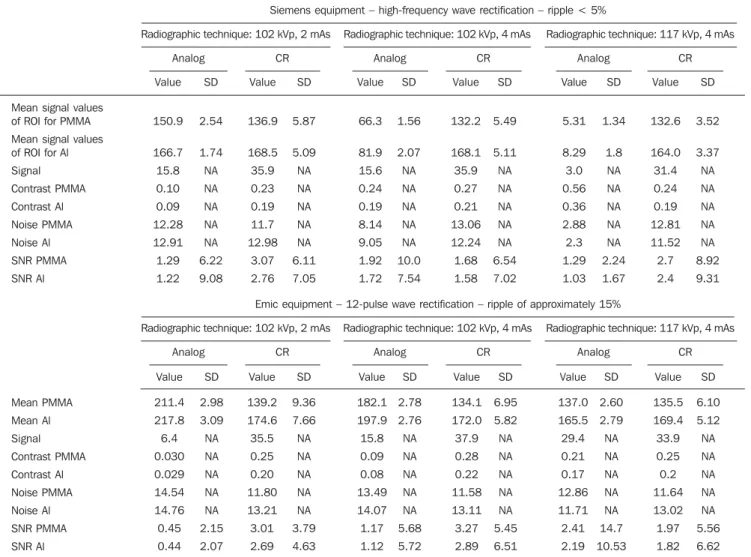
Table 1 Worksheet presenting quality parameter values (mean values for ROI, noise and SNR for PMMA – simulating the lung –, and for the Al bar – simu-lating the spine, and the signal resulting from these studied regions) for the analog and the digital CR imaging systems in both apparatuses.
Mean signal values of ROI for PMMA
Mean signal values of ROI for Al
Signal Contrast PMMA Contrast Al Noise PMMA Noise Al SNR PMMA SNR Al Mean PMMA Mean Al Signal Contrast PMMA Contrast Al Noise PMMA Noise Al SNR PMMA SNR Al Value 150.9 166.7 15.8 0.10 0.09 12.28 12.91 1.29 1.22 SD 2.54 1.74 NA NA NA NA NA 6.22 9.08 Value 136.9 168.5 35.9 0.23 0.19 11.7 12.98 3.07 2.76 SD 5.87 5.09 NA NA NA NA NA 6.11 7.05 Value 66.3 81.9 15.6 0.24 0.19 8.14 9.05 1.92 1.72 SD 1.56 2.07 NA NA NA NA NA 10.0 7.54 Value 132.2 168.1 35.9 0.27 0.21 13.06 12.24 1.68 1.58 SD 5.49 5.11 NA NA NA NA NA 6.54 7.02 Value 5.31 8.29 3.0 0.56 0.36 2.88 2.3 1.29 1.03 SD 1.34 1.8 NA NA NA NA NA 2.24 1.67 Value 132.6 164.0 31.4 0.24 0.19 12.81 11.52 2.7 2.4 SD 3.52 3.37 NA NA NA NA NA 8.92 9.31 Siemens equipment – high-frequency wave rectification – ripple < 5%
Radiographic technique: 102 kVp, 2 mAs Radiographic technique: 102 kVp, 4 mAs Radiographic technique: 117 kVp, 4 mAs
Analog CR Analog CR Analog CR
Emic equipment – 12-pulse wave rectification – ripple of approximately 15%
Radiographic technique: 102 kVp, 2 mAs Radiographic technique: 102 kVp, 4 mAs Radiographic technique: 117 kVp, 4 mAs
Analog CR Analog CR Analog CR
Value 211.4 217.8 6.4 0.030 0.029 14.54 14.76 0.45 0.44 SD 2.98 3.09 NA NA NA NA NA 2.15 2.07 Value 139.2 174.6 35.5 0.25 0.20 11.80 13.21 3.01 2.69 SD 9.36 7.66 NA NA NA NA NA 3.79 4.63 Value 182.1 197.9 15.8 0.09 0.08 13.49 14.07 1.17 1.12 SD 2.78 2.76 NA NA NA NA NA 5.68 5.72 Value 134.1 172.0 37.9 0.28 0.22 11.58 13.11 3.27 2.89 SD 6.95 5.82 NA NA NA NA NA 5.45 6.51 Value 137.0 165.5 29.4 0.21 0.17 12.86 11.71 2.41 2.19 SD 2.60 2.79 NA NA NA NA NA 14.7 10.53 Value 135.5 169.4 33.9 0.25 0.2 11.64 13.02 1.97 1.82 SD 6.10 5.12 NA NA NA NA NA 5.56 6.62
SD, standard deviation; NA means “not applicable”, that is, the image descriptor calculation is not applicable for that data row.
Figure 1. Comparison between images from the analog system for 117 kVp and 4 mAs exposure fac-tors from the Siemens equipment (high frequency) (A) and from the Emic equipment (12 pulse) (B).
ducer system, SNR increased both with voltage increase and current increase in the tube. The images on Figures 1 and 2 will help in the discussion of results presented on Table 1.
The analysis of data regarding signal intensity obtained from images generated in the Siemens equipment did not present significant changes when mAs was in-creased from 2 mAs to 4 mAs, with con-stant 102 kVp, independently of analog or digital processing. However, when voltage was increased from 102 kVp to 117 kVp, in both cases there was a decrease in sig-nal intensity. The images generated by the analog system are over exposed and present low contrast (darkened image), an evidence of the excessive radiation captured by the transducer system. The ideal image for this system is obtained at 102 kVp and 2 mAs for both apparatuses. On the other hand, the images generated by the CR digital imag-ing system presented low contrast, and ac-cording to the medical staff at the hospital, even with the digital processing resources, the diagnostic quality could not be attained. This characteristic was particularly more evident in the Emic equipment with 12 pulse wave rectification.
Based on data presented on Figures 1 and 2 and data on Table 1, it is possible to observe that an image contrast reduction occurs in the analog image generated by the Siemens equipment (high frequency
recti-fication). This is caused by the fact that spectrum generated by the Siemens equip-ment has, on average, a higher energy level than that of the Emic equipment, as for the same exposure technique, the visual result was significantly different for this imaging system. Furthermore, the signal is reduced with the increase in voltage in the high fre-quency equipment, while in the equipment with 12 pulse wave rectification, the signal increases. This directly affects the image contrast, which is lower in the high fre-quency equipment.
Data on Table 1 show that the difference between the digital images resides mainly in the increase in image noise, represented on Figure 2B. This is clearly observed on the dotting of the image and in the widen-ing of gray scale of the images histogram, which demonstrate the noise representation on such images.
Usually, the histogram with a peak in the signal intensity distribution at the center of the gray scale is observed in standardized and stable processes, in which the quality characteristic is continuous.
With the obtained air kerma results, the authors could observe that phantom exit flow for the Emic equipment, with medium frequency wave rectification (12-pulse rec-tification and ripple of approximately 15%) is lower than that obtained with the Si-emens equipment, that has high-frequency wave rectification (ripple < 4%).
Addition-ally, the spectrum generated by the Emic equipment presents lower mean energy than that generated by the Siemens equip-ment, which is related to wave rectification differences between both apparatuses. This characteristic has a direct influence on the quality of the X-ray spectrum, resulting, for the Emic equipment, in a spectrum with lower penetration in the phantom and, con-sequently, in images with lower definition and greater noise. This is caused by the decrease in the phantom exit flow. In order to obtain an image similar to those from the Siemens equipment, a different technique would be required, with greater exposure factors, and consequently, increased patient absorbed dose. The value calculated for the ratio between phantom entry and exit flow for the Emic equipment is greater than the ratio with the Siemens equipment. This happens because the mean energy of the spectrum emitted by the Emic equipment (Figure 3) is lower than that emitted by the Siemens equipment and, as the beam pen-etrates the phantom, a greater energy depo-sition occurs on its different layers, obvi-ously depending on the thickness and com-position of the phantom, which results in different exit flows (Figure 3). Comparing the spectra of the studied equipment, the Siemens one always presents a greater pho-tons flow in the same exposure conditions and phantom thickness, if one takes into account only the possible spectrum
gener-Figure 2. Comparison between images from the CR imaging sys-tem for 117 kVp and 4 mAs ex-posure factors from the Siemens equipment (high frequency) (A) and from the Emic equipment (12
ated by each equipment and its alterations caused by each system’s ripple.
In the Emic equipment, with spectra that presented lower penetration power than that of the Siemens equipment, there will be added wear of the X-ray tube, as it will operate at higher temperatures, which may damage the anode. In other words, many times the compensation will be performed by the automatic exposure control, increas-ing the mAs. Actually, this increase in mAs (usually in exposure time) generates an increase in the patient absorbed dose and reduces the useful tube life because of the anode heating and wear. Considering the studied irradiation geometry and the X-ray beam transport from the focal point, as the phantom is penetrated, the beam may only pass through 20 cm of PMMA, or by 18 cm of PMMA (representing the entry flow on the aluminum bar in the phantom), or pass through the 18 cm of PMMA and the 2 cm Al bar (representing the phantom exit flow). Figure 4(A,B) exemplifies the spec-trum alterations when passing through the phantom. For each studied spectrum, 90 kVp spectra were utilized as, in the catalog, these were the closest spectra to the ones
Figure 3. Chart of the emis-sion spectrum of X-ray equip-ment considering a tube with a tungsten track operating at 90 kVp, electron flight angle of 22° and 3 mm-thick Al filter, for a ripple of 5% and 15%.
studied, considering the characteristic equipment’s ripple changes.
As Figures 4A and 4B are compared, one can realize that the final photons flow after crossing the material is greater for the 5% ripple, indicating that for a 15% ripple, the energy and, consequently, the spectrum penetration power is smaller. This directly influences the generation of quantum noise on the image, this spectrum being not ad-visable for use with transducers of low conversion efficiency. The reduction in the area under the curves is quite visible on the chart representing the spectrum with 15% ripple in comparison with the spectrum with 5% ripple in all studied cases. This analysis becomes important as the two dif-ferent spectra undergo difdif-ferent alterations before reaching the transducer, with differ-ent flows that will be differdiffer-ently recorded, influencing the image quality and the dose in the procedure.
Actually the present study was devel-oped after several tube changes due to burn-outs in the Emic equipment (with 12-pulse rectification). The present study corrobo-rates the indication that, when migrating from analog to digital system, it is
impor-tant to consider the conversion efficiency of the X-radiation of the latent image from the transducer and the type of equipment available (specially the wave rectification in the input generator). In case of systems with 12-pulse wave rectification, or ripple of ≥ 15%, the transducer conversion effi-ciency should be evaluated to assure the image quality and the equipment integrity.
CONCLUSIONS
The measured air kerma values demon-strated that the equipment with wave rec-tification presenting a ripple ≥ 15% gener-ates a significantly smaller photons flow at the phantom exit than that of the equipment with wave rectification with a ripple ≤ 5%. On the other hand, the image quality pa-rameters were more appropriate on the images generated by the CR digital imag-ing system, when wave rectification sys-tems with ripple of ≤ 5% were utilized. When the equipment with wave rectifica-tion presenting ripple of ≥ 15% was uti-lized, the determined exposure level had to be higher than that recommended by the literature(8), in order to reduce noise on images, which would otherwise cause the image to present a low diagnostic quality. Therefore, it is important to determine the most appropriate radiographic technique for the CR digital imaging system, in order to avoid an increase in dose to the patient and a decrease in the diagnostic image quality. In the present study, the image with the best characteristics for diagnosis was generated in the Siemens equipment with 117 kVp and 4 mAs, at 1.5 m from the fo-cal point. It is important to note that the appropriate radiographic system should be
Figure 4. Chart of the phantom exit photons flow, considering the emission spectrum of the X-ray tube with a tungsten track operating at 90 kVp, electron flight angle of 22° and 3 mm-thick Al filter, for a ripple of 5% (A) and 15% (B) and PMMA thickness of 20 and 18 cm and 18 cm plus 2 cm of the Al bar.
determined for each imaging system and operating team.
The contribution of the present study is the determination of a relatively simple and reproducible method for adapting the ra-diographic technique by means of the com-parison of dose and image descriptors, and/ or a method that can be utilized for com-paring digitized image apparatuses from different institutions with a low cost, given the instruments utilized. It is important to observe that the proposed process is only valid if the image descriptors criteria are in agreement with the minimum image qual-ity required for diagnosis.
At the present stage, the authors suggest that whenever an institution plans on the acquisition of a CR digital imaging system, an evaluation of its X-ray systems charac-teristics be carried out, considering the photons flow and signal conversion effi-ciency required for the image generation in the CR digital imaging system. Otherwise, the acquisition of new X-ray equipment may be necessary after the deployment of the CR digital imaging system, which will bring an additional and unforeseen cost. Additionally, the utilization of reference dose levels defined by the Order (Portaria) No. 453(12) of the Brazilian Ministry of
Health is suggested, for the examinations to be performed in the recently installed systems, in order to assure that the dose to the patient is the lowest possible(1,13). This way, the radiological protection ALARA principle will be efficiently applied.
Acknowledgments
To the Núcleo de Imagens Médicasof
Pontifícia Universidade Católica do Rio Grande do Sul (PUCRS), for providing the film scanner and the calibration process developed for the correct digitization of images. To Professor Elaine Evani Streck, for her assistance, contributing in the re-search that originated the present study.
REFERENCES
1. Souza ABB, Dias SK, Mecca FA, et al. Avaliação do kerma no ar na superfície de entrada e da qua-lidade da imagem em radiografias de tórax. Ra-diol Bras. 2009;42:315–9.
2. Bontrager LK. Tratado de técnicas radiológicas e base anatômica. 7ª ed. Rio de Janeiro: Guana-bara Koogan; 1999.
3. Rangayyan RM. Biomedical image analysis. Florida: CRC Press LLC; 2005.
4. ImageJ: image processing and analysis in Java. [acessado em 20 de novembro de 2008]. Dispo-nível em: rsbweb.nih.gov/ij/
5. Montgomery DC, Runger GC. Estatística apli-cada e probabilidade para engenheiros. 2ª ed. Rio de Janeiro: LTC; 2003.
6. Silva RR. Processamento de imagens radiográfi-cas e análise de defeitos em cordão-de-solda [dis-sertação de mestrado]. Rio de Janeiro: COPPE/ UFRJ; 2000.
7. Universidade de Caxias do Sul. Centro de Ciên-cias Exatas e Tecnologia. Departamento de Física e Química. Medidas e grandezas físicas E. Teo-ria de erros. [acessado em 5 de novembro de 2008]. Disponível em: http://hermes.ucs.br/ccet/defq/ mlandreazza/Teo-ince.htm#_toc416523375 8. Shinohara AH, Acioli E, Khoury HJ. Avaliação da
técnica de radiografia digital em gamagrafia. Anais da 6ª COTEQ – Conferência sobre Tecno-logia de Equipamentos. Salvador, BA, Brasil; agosto de 2002.
9. Oliveira DF. Análise da radiografia computado-rizada em condições de águas profundas [disser-tação de mestrado]. Rio de Janeiro: COPPE/UFRJ; 2007.
10. Sprawls P Jr. Physical principles of medical im-aging. Madison: Medical Physics Pub; 1995.
11. Cranley K, Gilmore BJ, Fogarty GWA, et al. Cata-logue of diagnostic X-ray spectra and other data. IPEM Report 78. York: Institute of Physics and Engineering in Medicine; 1997.
12. Brasil. Ministério da Saúde. Diretrizes de prote-ção radiológica em radiodiagnóstico médico e odontológico. Portaria nº 453, de 1º de junho de 1998. Brasília: Diário Oficial da União, 2 de ju-nho de 1998.