Article
J. Braz. Chem. Soc., Vol. 25, No. 9, 1601-1606, 2014. Printed in Brazil - ©2014 Sociedade Brasileira de Química 0103 - 5053 $6.00+0.00
A
*e-mail: [email protected]
Application of a Low Pressure Spray Chamber for the Determination of Mercury
Concomitantly to other Trace Elements by Inductively Coupled Plasma Mass
Spectrometry
Jefferson S. de Gois*,a and Daniel L. G. Borgesa,b
aDepartamento de Química, Universidade Federal de Santa Catarina,
88040-970 Florianópolis-SC, Brazil
bINCT de Energia e Ambiente do CNPq, Florianópolis-SC, Brazil
Uma nova abordagem para introdução de amostras utilizando uma câmara de nebulização de baixa pressão foi empregada para a determinação de Hg e outros elementos por espectrometria de massa com plasma indutivamente acoplado. O sistema consiste de uma camara de nebulização ciclônica conectada a um nebulizador e a um tubo de sucção. A taxa de sucção, otimizada em 0,3 L min- 1, foi utilizada para induzir a baixa pressão no interior da câmara de nebulização. Não
houve diferenças nos parâmetros do plasma, avaliados antes e após a aplicação da sucção; no entanto, a vazão de gás de nebulização foi ligeiramente afetada. O efeito de memória para Hg foi reduzido utilizando a câmara de nebulização de baixa pressão e limites de detecção na ordem de µg L - 1 foram obtidos para todos os elementos. Amostras de referência certificadas foram analisadas
obtendo-se boa concordância com os valores certificados.
A new sample introduction setup employing a low pressure spray chamber was applied for Hg determination simultaneously to other trace elements by inductively coupled plasma mass spectrometry. The system consists of a cyclonic spray chamber connected to a nebulizer and to a suction tube. A suction rate, optimized at 0.3 L min-1, was employed to induce reduced pressure
inside the spray chamber. The plasma parameters were evaluated without and upon application of the low pressure spray chamber, and the only affected parameter was the nebulizer gas flow-rate. Memory effect for Hg was dramatically reduced using the low pressure spray chamber. Detection limits were obtained in the µg L-1 range for all elements. Digested certified reference samples were
analyzed using the proposed system, and good agreement between certified and obtained values was achieved for all elements.
Keywords: mercury determination, ICP-MS, spray chamber
Introduction
Despite the wide applicability of inductively coupled plasma mass spectrometry (ICP-MS) for trace elemental determination, the analytical process may be hindered in some cases by the presence of interferences and elemental particularities.1-3 Mercury is probably the most
important example due to its peculiar characteristics, which include high ionization energy and high volatility, enabling the formation of elemental Hg vapor inside the spray chamber.4 Mercury is widely recognized as
a major environmental pollutant and health hazard for humans and animals. Environmental contamination is
mostly derived from metallurgy, gold extraction from mines and production of chemicals.5 Health hazard effects
associated to Hg depend on the chemical form of the element, and include damage to kidney and to the immune system, in addition to cardiovascular and nervous system diseases.6,7
Mercury determination is usually carried out by chemical vapor generation (CVG) associated with techniques that include atomic fluorescence spectrometry,8
inductively coupled plasma mass spectrometry (ICP-MS) and atomic absorption spectrometry.9,10 Depending on
the specific application, CVG may also be associated to separation techniques, such as gas chromatography and high performance liquid chromatography.11 Despite the
determination, most of these approaches are typically monoelemental, although some authors have reported on the use of basic ICP-MS instrumentation to perform simultaneous determination of Hg and other elements. In general, the use of oxidants such as Au and washout steps are required to decrease the memory effect.12-15 It is a fact
that Hg determination suffers from severe memory effects, which are mostly due to the retention of Hg vapors inside the spray chamber.16-18
Despite the ability of reducing the memory effect for Hg determination that arises from the use of AuCl3,
2-mercaptoethanol, cysteine or other washout solutions,19,20
problems that include deposition of Au and C on the cones surfaces, spectral interferences due to polyatomic ion formation and even health hazards associated to the handling of toxic chemicals such as 2-mercaptoethanol have to be considered.19 Hence, the aim of this work was
to evaluate the efficiency of a low pressure spray chamber on reducing the memory effect for Hg determination by ICP-MS using a conventional concentric nebulizer, with the possibility to determine Hg simultaneously to other elements.
Experimental
Instrumentation
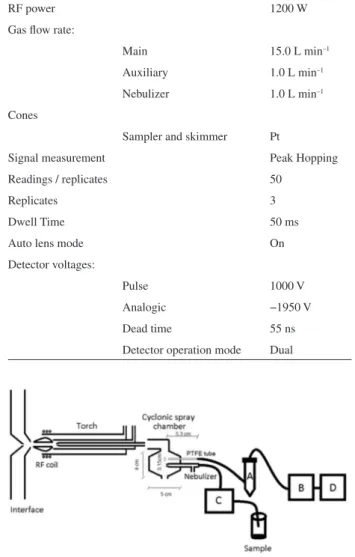
An ICP-MS equipment model Elan 6000 (Perkin Elmer-Sciex, Thornhill, Canada) coupled to a Meinhard nebulizer (MN) from Glass Expansion (West Melbourne, Australia) and a customized cyclonic spray chamber were employed in all experiments. The operating parameters of the ICP-MS instrument are listed in Table 1. Argon (99.996%) (White Martins, São Paulo, Brazil) was used as plasma and aerosol carrier gas.
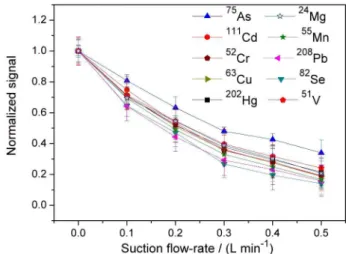
The cyclonic spray chamber was connected to a nebulizer and to a polytetrafluoroethylene (PTFE) suction tube according to the scheme presented in Figure 1. The system was adapted to a suction tube, which is placed parallel to the nebulizer inlet and inserted into the cyclonic spray chamber. An intermediate flask (Figure 1A) containing a cotton ball saturated with a 10 mg L-1 Au solution was used, which can
oxidize the Hg0 to Hg2+ and then prevent gaseous Hg from
reaching the lab atmosphere.21 Following the intermediate
tube, a gas flow controller (Figure 1B) (Cole-Parmer, Illinois, USA) was adapted in order to control the suction rate induced by a model TE-058 vacuum pump (Figure 1D) (Tecnal, São Paulo, Brazil).
Microwave-assisted digestion of the samples was carried out in a MLS-1200 MEGA microwave-assisted digestion station (Milestone, Sorisole, Italy).
Reagents, standards and samples
All reagents used were at least analytical grade. Nitric acid (Merck, Darmstadt, Germany) was purified by double sub-boiling distillation in a quartz still (Kürner Analysentechnik, Rosenheim, Germany). Deionized water was obtained from a Milli-Q system (Millipore, Bedford, MA, USA) at a resistivity of 18.2 MΩ cm. A stock multi-element standard solution ICP-3 (Perkin-Elmer) and individual stock standard solutions containing 1000 mg L-1
Rh (Sigma-Aldrich, St. Louis, USA), 1000 mg L-1 Hg
(SpecSol, São Paulo, Brazil) and hydrogen peroxide 30% m/m (Merck) were used.
Five certified reference materials were used to attest the accuracy of the procedure. Lobster Hepatopancreas (TORT-2), Dogfish Liver (DOLT-4) and Fish Protein Table 1. Operating parameters of the ICP-MS instrument
RF power 1200 W
Gas flow rate:
Main 15.0 L min–1
Auxiliary 1.0 L min–1
Nebulizer 1.0 L min–1
Cones
Sampler and skimmer Pt
Signal measurement Peak Hopping
Readings / replicates 50
Replicates 3
Dwell Time 50 ms
Auto lens mode On
Detector voltages:
Pulse 1000 V
Analogic −1950 V
Dead time 55 ns
Detector operation mode Dual
Figure 1. Schematic representation of the lowpressure spray chamber system. A: flask containing a cotton ball saturated with a 10 mg L-1 Au
(DORM-3) were acquired from National Research Council Canada (Ottawa, Canada); Pine Needles (SRM 1575) was provided by NIST (Gaithersburg, USA) and Pig Kidney (BCR 186) was acquired from IRMM (Geel, Belgium).
Procedures
The spray chamber gas suction-rate, RF power and nebulizer gas flow-rate were all optimized using a solution containing 10 µg L-1 eachof As, Cd, Cr, Cu, Hg, Mg, Mn,
Pb, Se, V and Rh in 0.14 mol L-1 HNO 3.
The signal stability study wascarried out for 20 min, with signal readings every two minutes. Evaluation of the memory effect was carried out identically, except for blank solutions, which were evaluated for a total of 10 min, with one minute steps.
Microwave-assisted digestion of certified reference samples was carried out by weighing about 100 mg of each sample and mixing with 6 mL HNO3 and 2 mL H2O2 in
perfluoroalcoxy (PFA) flasks. Afterwards, the mixture was heated in a microwave station as follows: 2 min at 250 W, cooling for 2 min, 6 min at 250 W, 5 min at 400 W, 5 min at 600 W and cooling for 10 min. The resulting solutions were diluted to 30 mL with deionized water. Blank solutions were submitted to the same analytical procedure as the samples.
All measurements were carried out using 10 µg L-1 Rh
as an internal standard, and the monitored isotopes were
75As, 111Cd, 52Cr, 63Cu, 202Hg, 24Mg, 55Mn, 208Pb, 82Se, 51V
and 103Rh.
Results and Discussion
Evaluation of suction rate, RF power and nebulizer gas flow-rate
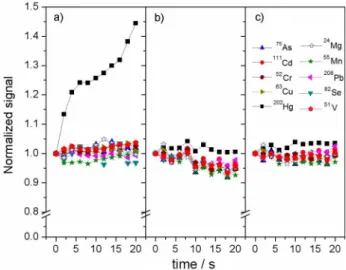
The effect of the suction rate of the spray chamber on the analytical signal is shown in Figure 2. As expected, increasing suction rates result in decrease of the analytical signal for all isotopes, with a sensitivity reduction higher than 80% for 82Se, 208Pb and 55Mn at 0.5 L min-1. This
decrease in the analytical signal is mostly due to the fact that part of the aerosol arising from the nebulizer is drained from the interior of the spray chamber and prevented from reaching the plasma. In order to establish the optimum suction flow rate, a solution containing 10 µg L-1 of each
analyte in 0.14 mol L-1 HNO
3 was aspirated for 20 min
and the suction rate was varied. The results (Figure S1) demonstrate that suction rates lower than 0.3 L min-1 are
insufficient to reduce the memory effect for Hg, whereas pronounced total count loss was detected with higher suction flow rates. Concomitantly, the withdrawal of gas
from the spray chamber may lead to modification of the plasma conditions. Hence, 0.3 L min-1 was selected as the
optimum suction rate for subsequent studies.
Optimizations of RF power and nebulizer gas flow-rate were carried out without suction and with a suction flow-rate of 0.3 L min-1 in the cyclonic spray chamber. The
optimum RF power (1200 W) was identical under both conditions, which suggests that the suction promoted little or no change in the plasma energy.
A similar situation was observed for the nebulizer gas flow-rate, which was kept under the same optimum value (1.0 L min-1), regardless of the spray chamber pressure.
The only significant difference was observed when higher nebulizer gas flow-rates were applied, resulting in more pronounced signal drop, which is likely due to a carryover effect associated to the removal of substantial amounts of the aerosol cloud upon application of suction into the spray chamber.
Evaluation of signal stability and memory effect
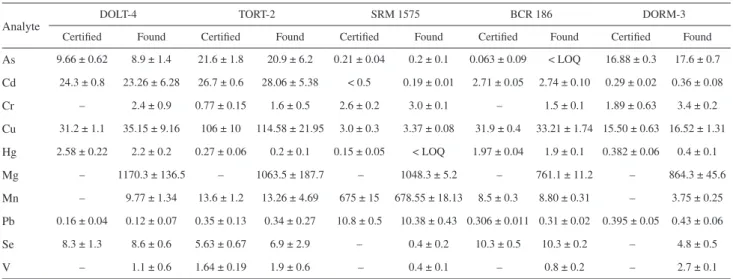
A short-term signal stability study was conducted for a series of analytes at 10 µg L-1; the results are shown in
Figure 3. The analytical signal increased up to about 45% of the initial analytical signal for 202Hg+, with a spray
chamber operated at atmospheric pressure after continuous aspiration for 20 min. This increase is related to retention of Hg vapor inside the spray chamber, promoting its accumulation and a considerable memory effect;4,22 analyte
adsorption onto the chamber walls is also likely to play an important role in this process. Upon application of suction to the spray chamber (Figure 3b), the analytical Figure 2. Effect of the suction flow-rate of the spray chamber on the analytical signals, using a solution containing 10 µg L-1 of each analyte in
0.14 mol L-1 HNO
3 (n = 3). Analytical signals were normalized considering
signal remained approximately stable over time, which is due to the constant removal of Hg vapor from the spray chamber promoted by the negative pressure difference. It is noticeable, however, that the overall signal stability is affected by the reduced pressure, which is caused by the instability of the flow controller, an effect that could be easily corrected by the use of an internal standard, as shown in Figure 3c. Upon adoption of Rh as an internal standard and reduced pressure on the spray chamber, variation of the analytical signal was reduced to about 5% of its mean value for all isotopes.
The evaluation of the memory effect was carried out after continuously aspirating a solution containing the analytes for 20 min. After ceasing the aspiration of the solution, the residual signal generated by the aerosol which remained inside the spray chamber, characterizing the memory effect, was measured for 10 min in one min steps. Memory effects were negligible for all elements with or without induced pressure drop inside the spray chamber, with the exception of 202Hg+ (Figure 4).
For this element, with the spray chamber maintained at atmospheric pressure, approximately 18% of the analytical signal could be detected even after 12 minutes without aspirating any solution whatsoever (Figure 4a). The insertion of a washout step using deionized water resulted in a decrease of approximately 27% in the analytical signal one minute latter (Figure 4b), evidencing a pronounced memory effect. Application of a suction flow-rate to the spray chamber, immediately after ceasing aspiration of the analytical solution, resulted in detection
of a residual signal, although it represented only ca. 10% of the analytical signal obtained for the aqueous standard, i.e., the memory effect was reduced by a factor of about five. It was noticed, however, that after 8 min of readings without aspirating any solution, an increase of about 60% in the analytical signal was observed (Figure 4c), which may be related to evaporation of residual solution that remained deposited on the spray chamber inner walls. This results in the release of Hg vapor, induced also by the pressure drop, generating a residual signal. In order to prevent this effect, deionized water was aspirated continuously after ceasing aspiration of the analytical solution, which kept the residual signal for Hg compatible with the one obtained for a blank solution (Figure 4d). This can be considered as a simple and efficient measure to definitely reduce the memory effect for Hg, allowing low and temporally-stable signal for blank solutions to be obtained.
Figures of merit
All measurements were carried out using Rh as the internal standard at a final concentration of 10 µg L-1. The
correlation coefficients obtained for all calibration curves were equal or superior to 0.999. Instrumental detection limits (LOD) (Table 2) were determined as three times the standard deviation of 10 readings of a blank solution with or without spray chamber operation at reduced pressure, divided by the slope of the calibration curve.23 Despite the
fact that the reduced pressure of the spray chamber resulted in a decrease of the analytical signal for all elements, no significant differences were observed on the LODs, and low LODs were obtained for both systems, in the µg L-1
range, demonstrating that the reduced pressure does not provide negative effects in the analysis using ICP-MS. It Figure 3. Short-term signal stability using a solution containing 10 µg L-1
of each analyte in 0.14 mol L-1 HNO
3 under different spray chamber
operating conditions: (a) atmospheric pressure; (b) suction flow-rate of 0.3 L min-1; (c) suction flow-rate of 0.3 L min-1 and Rh as internal
standard. The analytical signals were normalized according to the initial measurement (n = 3; individual RSDs were lower than 10%).
Figure 4. Evaluation of the memory effect for 202Hg using a solution
containing 10 µg L-1 of the analyte in 0.14 mol L-1 HNO
3 under different
operating conditions of the spray chamber: (a) without suction; (b) without suction + washout step with water; (c) suction rate of 0.3 L min-1 and
(d) suction rate of 0.3 L min-1 + washout step with water. The relative signal
becomes apparent that, although the sensitivity is reduced upon operation of the spray chamber at reduced pressure, the precision is somewhat improved as to compensate for the sensitivity loss.
Analytical application
Five certified reference materials were digested and analyzed upon application of the proposed method. In order to avoid losses of Hg after digestion, the PFA vessels were completely cooled down to room temperature before opening and the solutions were stored at 5 oC by a maximum
of two days until analysis.
The results, shown in Table 3, are in agreement with the certified values for all elements, except for Cr, according to a t-test at a 95% of confidence level. Chromium
determination was hindered by the presence of polyatomic interference from 40Ar12C+, which is believed to be formed
due to the residual carbon content of the digested samples. Despite the instability from the flow controller, the use of Rh as an internal standard was proven efficient to enable relatively low standard deviations for all elements, except for Hg in the TORT-2 sample, for which a 50% RSD was determined, due to the fact that the Hg concentration in this sample is close to the LOD of the method.
Conclusions
Operation of a spray chamber under low pressure conditions leads to a reduction in the amount of aerosol that effectively reaches the plasma, leading to reduced sensitivity for all elements. However, the system allowed to reduce the well-known memory effect for Hg, enabling its determination without compromises and concomitantly to other elements. Instability of the measurements due to oscillations in the flow rate controller can be efficiently corrected using Rh as an internal standard. Water aspiration after aspirating analyte solutions is required to avoid the evaporation of Hg from the spray chamber walls. The use of a reduced pressure spray chamber allowed the determination of all the evaluated elements, including Hg, with detection limits in the order of µg L-1. The system
is inexpensive and can be easily operated and adapted to virtually any commercial ICP-MS instrument.
Supplementary Information
Supplementary data (Figure S1) is available free of charge at http://jbcs.sbq.org.br as PDF file.
Table 2. Detection limits, in µg L-1, obtained upon operating the spray
chamber of the ICP-MS instrument at atmospheric pressure and applying a suction flow-rate of 0.3 L min-1
Analyte Atmospheric pressure Low pressure
As 0.1 0.1
Cd 0.02 0.02
Cr 0.06 0.1
Cu 0.01 0.01
Hg 0.2 0.2
Mg 0.3 0.7
Mn 0.03 0.04
Pb 0.01 0.02
Se 0.3 0.3
V 0.1 0.1
Table 3. Concentrations, in µg g-1, obtained by ICP-MS in certified reference materials using the low pressure spray chamber (n = 9; mean ± confidence
interval at a 95% statistical level)
Analyte
DOLT-4 TORT-2 SRM 1575 BCR 186 DORM-3
Certified Found Certified Found Certified Found Certified Found Certified Found
As 9.66 ± 0.62 8.9 ± 1.4 21.6 ± 1.8 20.9 ± 6.2 0.21 ± 0.04 0.2 ± 0.1 0.063 ± 0.09 < LOQ 16.88 ± 0.3 17.6 ± 0.7
Cd 24.3 ± 0.8 23.26 ± 6.28 26.7 ± 0.6 28.06 ± 5.38 < 0.5 0.19 ± 0.01 2.71 ± 0.05 2.74 ± 0.10 0.29 ± 0.02 0.36 ± 0.08
Cr – 2.4 ± 0.9 0.77 ± 0.15 1.6 ± 0.5 2.6 ± 0.2 3.0 ± 0.1 – 1.5 ± 0.1 1.89 ± 0.63 3.4 ± 0.2
Cu 31.2 ± 1.1 35.15 ± 9.16 106 ± 10 114.58 ± 21.95 3.0 ± 0.3 3.37 ± 0.08 31.9 ± 0.4 33.21 ± 1.74 15.50 ± 0.63 16.52 ± 1.31
Hg 2.58 ± 0.22 2.2 ± 0.2 0.27 ± 0.06 0.2 ± 0.1 0.15 ± 0.05 < LOQ 1.97 ± 0.04 1.9 ± 0.1 0.382 ± 0.06 0.4 ± 0.1
Mg – 1170.3 ± 136.5 – 1063.5 ± 187.7 – 1048.3 ± 5.2 – 761.1 ± 11.2 – 864.3 ± 45.6
Mn – 9.77 ± 1.34 13.6 ± 1.2 13.26 ± 4.69 675 ± 15 678.55 ± 18.13 8.5 ± 0.3 8.80 ± 0.31 – 3.75 ± 0.25
Pb 0.16 ± 0.04 0.12 ± 0.07 0.35 ± 0.13 0.34 ± 0.27 10.8 ± 0.5 10.38 ± 0.43 0.306 ± 0.011 0.31 ± 0.02 0.395 ± 0.05 0.43 ± 0.06
Se 8.3 ± 1.3 8.6 ± 0.6 5.63 ± 0.67 6.9 ± 2.9 – 0.4 ± 0.2 10.3 ± 0.5 10.3 ± 0.2 – 4.8 ± 0.5
Acknowledgements
The authors are thankful to Conselho Nacional de Desenvolvimento Científico e Tecnológico (CNPq, Process 309252/2011-0) and Fundação de Amparo à Pesquisa e Inovação do Estado de Santa Catarina (FAPESC, TO 11.344/2012-1) for financial support. J. S. G. has a scholarship from CNPq and D. L. G. B. has a research scholarship from CNPq.
References
1. Jarvis, K. E.; Gray, A. L.; Houk, R. S.; Handbook of Inductively Coupled Plasma Mass Spectrometry; Blackie Academic & Professional: London, 1992.
2. Jarvis, I.; Jarvis, K. E.; Chem. Geol.1992, 95, 1.
3. de Gois, J. S.; Maranhão, T. A.; Oliveira, F. J. S.; Frescura, V. L. A.; Curtius, A. J.; Borges, D. L. G.; Spectrochim. Acta Part B2012, 77, 35.
4. Campbell, M. J.; Vermeir, G.; Dams, R.; Quevauviller, P.; J. Anal. At. Spectrom.1992, 7, 617.
5. Wang, J.; Feng, X.; Anderson, C. W. N.; Xing, Y.; Shang, L.; J. Hazard. Mater.2012, 221, 1.
6. Stern, A. H.; Environ. Res. 2005, 98, 133.
7. Hogberg, H. T.; Kinsner-Ovaskainen, A.; Coecke, S.; Hartung, T.; Bal-Price, A. K.; Toxicol. Sci. 2010, 113, 95. 8. Zhang, W. B.; Su, Z. F.; Chu, X. F.; Yang, X. A.; Talanta2010,
80, 2106.
9. Kenduzler, E.; Ates, M.; Arslan, Z.; McHenry, M.; Tchounwou, P. B.; Talanta2012, 93, 404.
10. Oreste, E. Q.; Jesus, A.; Oliveira, R. M.; Silva, M. M.; Vieira, M. A.; Ribeiro, A. S.; Microchem. J.2013, 109, 5.
11. Meng, W.; Weiyue, F.; Junwen, S.; Fang, Z.; Bing, W.; Motao, Z.; Bai, L.; Yuliang, Z.; Zhifang, C.; Talanta2007, 71, 2034.
12. Allibone, J.; Fatemian, E.; Walke, P. J.; J. Anal. At. Spectrom.
1999, 14, 235.
13. Millour, S.; Noel, L.; Kadar, A.; Chekri, R.; Vastel, C.; Guérin, T.; J. Food Compos. Anal.2011, 24, 111.
14. Han, F. X.; Patterson, W. D.; Xia, Y.; Sridhar, B. B. M.; Su, Y.; Water Air Soil Pollut.2006, 170, 161.
15. Mann, J. L.; Long, S.; Shuman, C. A.; Kelly, W. R.; Water Air Soil Pollut.2005, 163, 19.
16. Harrington, C. F.; Merson, S. A.; Silva, T. M. D.; Anal Chim. Acta2004, 505, 247.
17. López-Antón, M. A.; Díaz-Somoano, M.; Ochoa-González, R.; Martínez-Tarazona, M. R.; Int. J. Coal. Geol.2012, 94, 44. 18. Woller, A.; Garraud, H.; Martin, F.; Donard, O. F. X.; Fodor, P.;
J.Anal. At. Spectrom.1997, 12, 53.
19. Li, Y. F.; Chen, C. Y.; Li, B.; Sun, J.; Wang, J. X.; Gao, Y. X.; Zhao, Y. L.; Chai, Z. F.; J. Anal. At. Spectrom.2006, 21, 94. 20. Drennan-Harris, L. R.; Wongwilawan, S.; Tyson, J. F.; J. Anal.
At. Spectrom.2013, 28, 259.
21. Walker, P. J.; J. Anal. At. Spectrom. 2000, 15, 1512. 22. Buchee, D. S.; Analyst1988, 113, 1167.
23. Currie, L. A.; Anal Chim. Acta 1999,391, 127.
Submitted: March 23, 2014