0103 - 5053 $6.00+0.00
Article
* e-mail: [email protected]
A Simple Low-Cost Simulation Protocol for Approximate Localization of Structural Water
Molecules in DNA Oligonucleotides
Amarílis de V. Finageiv Neder and Marçal de Oliveira Neto*
Instituto de Química, Universidade de Brasília, Campus Darcy Ribeiro, CP 04478, 70904-970 Brasília - DF, Brazil
Utilizando um protocolo combinado de mecânica e dinâmica molecular, de baixo custo computacional, empregando-se a expressão e os parâmetros do campo de força OPLS-AA, foi possível reproduzir as principais características da primeira camada de hidratação de hetero-oligonucleotídeos de DNA em duplas hélices na conformação A (1DPL) e B (1DPN e 1ENN), conforme descrições cristalográficas com resolução atômica; nosso protocolo também reproduziu satisfatoriamente as características das primeiras camadas de hidratação de homo-oligonucleotídeos de DNA na conformação B [(AT)12 e (CG)12] obtidas em simulações por dinâmica molecular empregando-se protocolos mais longos e mais sofisticados. Um modelo preliminar da primeira camada de hidratação de oligonucleotídeos poderia ser útil para aqueles interessados em proceder cálculos mecânico-quânticos em sistemas cujas características de hidratação são desconhecidas em nível molecular ou, ainda, para refinamento de estruturas cristalográficas por comparação com padrões de difração experimentais.
Using a computational low-cost protocol by combining molecular mechanics energy minimization and molecular dynamics employing the OPLS-AA force field, we were able to reproduce the main structural features of the first hydration shell of double-helix DNA hetero-oligonucleotides in the A (1DPL) and B-conformations (1DPN and 1ENN), whose coordinates are available with atomic resolution from crystallographic data. Our simple protocol also reproduced the main hydration patterns of DNA homo-oligonucleotides in the B-conformation [(AT)12 and (CG)12], obtained before by computer simulation using a longer and more sophisticated molecular dynamics protocol. A preliminary model of the first hydration shell of oligonucleotides may be very useful to those interested in performing quantum-mechanical calculations of systems where hydration features are unknown at the molecular level; the model may also be used by crystallographers during refinement steps.
Keywords: nucleic acids, hydration, quenched dynamics, bound water
Introduction
Water is a ubiquitous molecule in the biological environment and is considered to be an intrinsic component of the structure of nucleic acids (structural water molecules). Many ligands, such as amino acids, drugs or even other nucleotides, interact with nucleic acids either through a water bridge or by replacing structural water molecules bound to specific sites or, most commonly, by both types of contacts.1 Although the preferential hydration
sites of nucleic bases are quite conservative according to comparative crystallographic data,2 different nucleotide
sequences,3 base compositions,4 and conformations5 affect
hydration in a very complex manner. In order to understand
the function of this type of biomolecule in the cell environment or even inside cell organelles, it is important to investigate nucleic acid hydration sites more extensively, including the dynamics of the first hydration shells, the energetics of water binding, and the role of hydration and ions in nucleic acid conformations and ligand recognition-binding processes as well. To reach this goal, different complementary strategies in experimental and theoretical fields must be considered.
In early fiber diffraction studies it was shown that water content affects the DNA helix geometry, inducing a conformation transition from B to A-DNA at relatively low humidities between 75 and 80%.6 The first experimental
H2O were observed and were attributed to the first hydration shell of water molecules interacting with DNA atoms with different relative strengths.6 The absorption frequencies of
certain groups such as P-O, P-O-, C=O, C-O, heterocyclic N,
NH and NH2, were also changed due to the effect of humidity. Another useful technique for studying DNA hydration and the location of water molecules is X-ray crystallography. There are a huge number of reviews concerning this subject and we will discuss only those results which were considered for the development of this work. One of the most studied deoxyribonucleotides has been the “Dickerson-Drew” (DD) dodecamer [d(CGCGAATTCGCG)2], a double-helix DNA with B conformation in which a total of 72 localized water molecules and a “spine of hydration” were first observed in the minor groove of the center of the AATT tract; hydration of major groove N or O atom bases was predominantly monodentated and the phosphate groups were the most hydrated sites.7 Today, atomic resolution X-ray data describe
regular water networks and bridges of hydrogen-bonded waters around DNA oligomers, whose characteristics seem to be conformation-dependent.5 Due to the high quality of
some of these reported crystallographic data, in terms of the description of hydration sites, they can be considered as reliable experimental standards for supporting theoretical approaches.5,8
Over the past few years, advances in computer simulation have prompted researchers to study the dynamics of water molecules and ions explicitly represented around DNA oligonucleotides comprising from 10 to 28 base-pairs.9 However, depending on the chosen
program, the protocol or the level of theory, such calculations are time-consuming and require a high computing power. Here we present a simple low-cost protocol involving mixed steps of molecular dynamics (MD) and energy minimization (EM) calculations which can reproduce the main features of the hydration profile of nucleic acid oligomers as described by crystallographic studies. A simpler procedure than that given here, which also involves combined steps of EM and MD, was successfully used to describe a hydration model for the antiepileptic drug vigabatrin and the prosthetic group
interaction.10The current protocol based on “quenched
dynamics” methodology was performed with explicitly represented water molecules (TIP3P),11 with free vacuum
boundaries, without counter-ions in a total 20 ps simulation using the OPLS-AA force field12 implemented
in the Hyperchem program.13 Validation of the
methodology was carried out by comparing our results to the high-resolution crystallographic data of two DNA heteroligomers in the B conformation (PDB codes: 1DPN5
and 1ENN8), a DNA decamer in the A-conformation (PDB
code: 1DPL5), and two homoligomers d(CG)
12 and d(AT)12,
whose first shell hydration characteristics were described by Auffinger and Westhof14 using a much more
sophisticated MD protocol and longer simulation (~10-12 ns). With this simple protocol one may quickly produce a reliable model of the main hydration patterns with the approximate localizations of structural water molecules of an oligonucleotide as would be found in its crystal structure. Such a preliminary model may be very useful to those interested in performing refined quantum-mechanical calculation of hydrated oligonucleotides whose first hydration shell is not known at the molecular level; it can also be used by crystallographers in order to prepare the first hydration model of a nucleic acid oligomer to be refined according to the experimental diffraction pattern.
Experimental
Model systems
The high quality X-ray crystallographic analysis of the A-DNA decamer [d(GCGTAMTACGC)
2], and the B-DNA
dodecamer [d(CGCGAAFTTCGCG)
2], at 0.83 and 0.95Å,
respectively, by Egli and co-workers,5 is so fully described
that we considered their results to be one of the best experimental data published to date for the purpose of validation of computationally simulated hydration sites of double-helical DNAs.
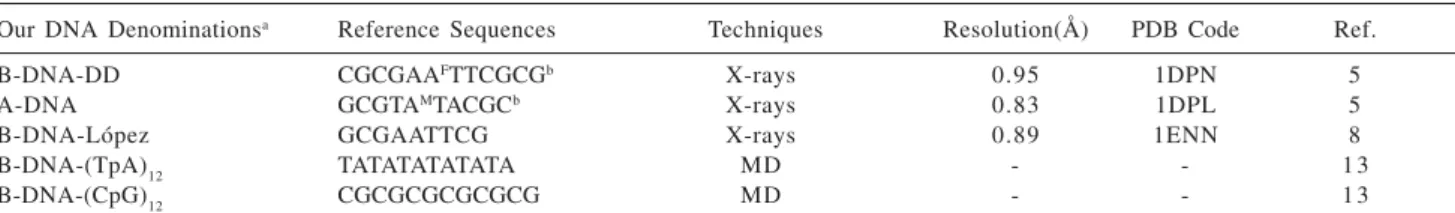
For simulation, all DNA double helix oligomers studied (see Table 1) were drawn using the database/ building modules of Hyperchem, except in the case of
B-Table 1. General description of double-helix DNA oligomers used as reference to validate our protocol
Our DNA Denominationsa Reference Sequences Techniques Resolution(Å) PDB Code Ref.
B-DNA-DD CGCGAAFTTCGCGb X-rays 0.95 1DPN 5
A-DNA GCGTAMTACGCb X-rays 0.83 1DPL 5
B-DNA-López GCGAATTCG X-rays 0.89 1ENN 8
B-DNA-(TpA)12 TATATATATATA MD - - 1 3
B-DNA-(CpG)12 CGCGCGCGCGCG MD - - 1 3
DNA-López, where the crystallographic coordinates were directly extracted from PDB (crystallization water molecules and ions were excluded).
Since 1DPL and 1DPN crystallographic coordinates were fragmented, B-DNA-DD and A-DNA sequences were drawn without modifications on the thymidine backbone, which were introduced to facilitate crystallization (root mean-square atomic deviation, RMSD, between 1DPN and 1DPL and our draws were not higher than 0.46Å). B-DNA-DD has the same sequence as the Dickerson-Drew dodecamer, which contains the recognition site of EcoRI
restriction enzyme. DNA phosphate groups were kept charged and the phosphodiester oxygens O3’ and O5’ in the phosphate groups at the helix extremities were manually saturated with hydrogens.
In the case of B-DNA-López, the hydrogens of O3’ from G9, and O1P and O2P from G1 at 5’ were manually added while the remaining hydrogens were automatically attributed by Hyperchem. Only in this system, the coordinates of all non-hydrogen atoms were held fixed while the geometry of hydrogens was optimized in vacuum using the Polak-Ribière conjugate gradient method with OPLS-AA force field up to a RMS gradient convergence of 0.01 kcal/Å mol.
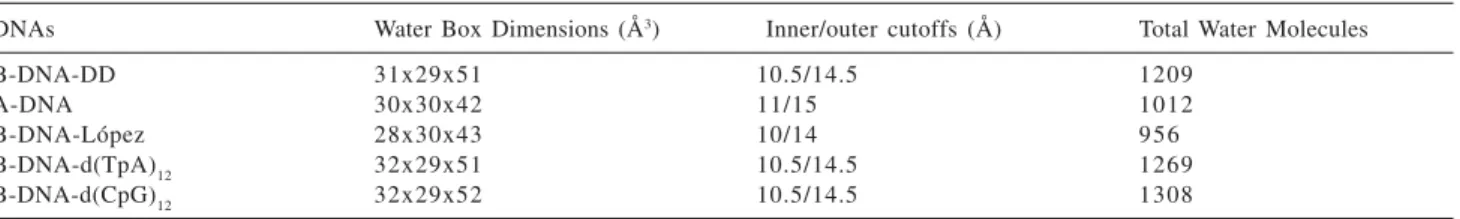
The DNA double helix was surrounded by a cubic box of about 1000 to 1300 TIP3P water molecules corresponding to a hydration shell with 10 to 15 Å thickness (Table 2). In Hyperchem13 these water molecules
come from a cubic water box comprising 216 molecules previously equilibrated according to a procedure developed by Jorgensen and co-workers using the Monte Carlo method. When the system encompasses more than 216 water molecules, several identical copies of the box are merged in a larger box to create a new box of 3x3x3x216 water molecules, from which the solvent water molecules are extracted. Since the extra water molecules are images of the original Jorgensen box, it is necessary to perform an initial EM calculation with these water molecules prior to the first MD step. No periodic boundary condition was used, and MD simulations were carried out as if each DNA double-helix was imbibed in a water drop surrounded by vacuum. No counter-ions were added since Egli and co-workers5 did not report a significant number
of ions in the first hydration shell of 1DPL and 1DPN deoxyribonucleotides; also, according to Mazur,15 charge
neutrality is not required for MD simulations of DNA chains in the case of an isolated cluster like this one.
Methods and simulation protocol
All calculation procedures were carried out using the OPLS-AA force field12 as implemented in Hyperchem 6
Professional.13 This program was run in a PC (Pentium III
900 MHz and Pentium IV 1.6 GHz, 256Mb RAM) hardware system. The Polak-Ribière conjugate gradient method was chosen to perform all EM calculations up to an RMS gradient convergence of 0.01 kcal/Å mol. Since water was explicitly represented, the dielectric constant H=1 was set; inner and outer cutoffs, with switching function, were automatically assigned by the program as half of the smallest dimension of the initial water box (outer cutoff) minus 4 Å (inner cutoff). During both MD runs, a time increment (stepsize) of 1fs was selected. No special strategy or algorithm was employed to calculate long-range electrostatic interactions – the Coulombic term of OPLS-AA force field12 was used.
Keeping atomic coordinates of DNAs fixed during the whole protocol, the following five steps were successively carried out with the water molecules only: 1) EM; 2) MD at 800K during 5ps; 3) EM of the last geometry; 4) MD at 300K during 15ps using a random initial velocity; 5) EM of the last geometry. Whenever necessary, after the second step any water molecule which “evaporated” beyond the external boundary at a distance long enough to forbid a hydrogen bond (H-bond) contact to water molecules of the main water cluster was manually deleted.
The “quenched dynamics” method was chosen as a computational resource to improve EM procedures. Performing an MD simulation at high temperatures is an artificial tool to force the system to cross possible energy barriers.
Although OPLS-AA force field12 was especially
developed to simulate hydrated nucleic acids, to our knowledge there is no paper in the literature concerning the hydration of nucleic acid oligomers by MD using this force field.
Table 2. Initial parameters of the DNA model systems
DNAs Water Box Dimensions (Å3) Inner/outer cutoffs (Å) Total Water Molecules
B-DNA-DD 31x29x51 10.5/14.5 1209
A-DNA 30x30x42 11/15 1012
B-DNA-López 28x30x43 10/14 956
B-DNA-d(TpA)12 32x29x51 10.5/14.5 1269
Analytical procedures
of a hydration spine observed in our simulations and Figure 2 shows some interesting polygonal structures extracted from the water network.
A-DNA
As shown in Table 3, of all of the potentially hydrophilic groups of the A-DNA decamer, the phosphate groups and the oxygen O3’ were the most hydrated. The average number of water molecules interacting through H-bond with ribose O4’ and atoms of the nucleic bases were comparable. These observations are in agreement with the crystallographic data described for 1DPL by Egli and co-workers.5 Concerning the nucleic bases, in our
simulations at least one water molecule was found interacting through a H-bond with major groove atoms N7(G), N7(A), O6(G), N4(C), and O4(T), and also with minor groove atoms O2(T) and N3(A). In contrast to the experimental work,5 the simultaneous hydration of all these
nucleic base atoms was not observed, probably due to
differences between the geometric criteria adopted in selecting the water molecules of the first hydration shell. Due to a more compact conformation, adjacent A-DNA phosphate groups were interconnected by only one or two water molecules, as described for 1DPL.5
In the case of 1DPL, Egli and co-workers5 did not
observe water molecules at distances shorter than 3.6Å to nitrogen N6 from the adenine exocyclic amino group, which prefers to interact with oxygen O4 in stacked thymines in the same strand. The DNA conformational constraint imposed by our protocol and the parameterization of OPLS-AA force field allowed the hydration of this exocyclic amino group in the A-DNA decamer, and a water bridge interconnecting the adenine N6 group and the carbonyl oxygen O4 of the adjacent thymine was observed.
Also, with 1DPL5 it was observed that at the periphery
of the major groove, fused hexagons and pentagons of water molecules connected phosphate groups with the base atoms. This hydration pattern was also observed in our simulation. As described for B-DNA-DD, the A-DNA decamer presents a huge water network that fills all grooves and involves the whole DNA, but no regular arrangement is seen in the major grooves, except for the above-mentioned fused polygons.
B-DNA-DD versus A-DNA
The reasons why a double helix prefers an A or B-conformation is still a matter for discussion. Nevertheless, some experimental evidence suggests that in low humidity environments the more compact A-conformation is favored over the B-A-conformation.17 The
more modest hydration of the 1DPL phosphate groups compared with 1DPN, due to the compactness that allows just one or two water molecules to bridge adjacent phosphate oxygens, was remarked upon by Egli and co-workers.5 As shown in Table 3, our simulations reproduced
this behavior, as well as the more extensive hydration of O1P in B-DNA-DD in comparison with A-DNA. As reported for 1DPL and 1DPN,5 we also observed that oxygens O3’
are more hydrated in A-DNA than in B-DNA-DD. In the simulations of B-DNA-DD and A-DNA, all potentially hydrophilic atoms of the terminal CG pairs interact with water molecules in contrast to the crystallographic study, where minor groove atoms O2(C), N2(G) and N3(G) interact mostly with DNA atoms from neighboring helices.
Feig and Pettitt17 compared the hydration profile of
DNA oligomers in the A and B conformations obtained by long-duration (~10 ns) molecular dynamics simulations
Figure 1. A spine motive seen in AATT tract interconnecting adenines
and thymines non-base-paired from opposite strands, involving minor groove atoms N3(A), O2(T) and O4’ (from B-DNA-DD simu-lations).
Figure 2. Hexagonal and pentagonal water arrangements observed
with experimental data. As noted by the authors, MD simulations usually observe the individual hydration of the guanine exocyclic amino group -N2(G), although the average water densities near the N2 atom calculated by Schneider and co-workers2 indicated that in B-DNAs N2(G)
is almost completely unhydrated, while N3(G) is the most hydrated site in the minor groove; in the case of A-DNAs, the highest water density is located between N2(G) and N3(G). Feig and Pettitt18 investigated this issue using only
high-resolution crystal structures to compare with their simulated densities, and concluded that the individual N2(G) hydration is statistically plausible, supporting the results obtained in our simulations.
Another observation from Feig and Pettitt’s18 MD
simulations which was not reported in experimental studies and differentiates DNA oligomers in the A- and B-conformations is the presence of water bridges interconnecting, in the same strand, the minor groove atoms N3 or O2, mainly in the AT tract, with ribose O4’ of the adjacent sugar, a characteristic seen only in A-DNA simulations. In our simulations, this hydration pattern was also more often verified in the A-DNA system.
B-DNA-López
The description of the arrangements of the water molecules of the first hydration shell of DNA nonamer 1ENN8 is rather limited, except for the hydration spine at
the central AATT sequence. López and co-workers8 gave
the total number of water molecules which are in contact with one or more DNA atoms (97) and remarked that, in general, the hydration sites agreed with those described by Schneider and co-workers.2 They also highlighted that
most phosphate groups have four to five associated water molecules and that polygons of different sizes are the main structures of the water network that covers the whole duplex.8
In our simulations of B-DNA-López we observed a similar hydration picture, as can be confirmed in Table 5. The phosphate oxygens were the most hydrated sites in the double-helix and, on the average, four water molecules were found interacting with each phosphate group.
Although not described by López and co-workers, we also observed interphosphate water bridges formed by two, three or more water molecules as was obtained in the B-DNA-DD simulations, predominantly at the central AT sequence in both strands. In B-DNA-López simulations polygonal structures were recognized in the water network involving the duplex, and a water spine motive was also noticed, with the notable participation of the ribose O4’ and the minor groove atoms of the AT tract.
Radial distribution of water molecules and water density
The definition of hydration shells in experimental studies depends on the technique employed. In structural analysis by X-ray diffraction, the spatial ordering of the water molecules and the B-factor reflects the differences among hydration shells. Egli and co-workers5 defined the
maximum in the radial distribution graphic is between 2.5 and 3.0Å and the following minimum is between 3.3 and 3.6-4.0Å, numbers that are in agreement with the theoretical17 and experimental definitions5 of the first
hydration shell of DNA oligomers given above. In all simulations, the total number of water molecules interacting with the nucleic acid atoms through H-bonds, according to the visual inspection method, was comparable to the number of water molecules of the supposed first hydration shell using the DETPDB program.16 The total number of water molecules in the first
layer in the simulations of DD, A-DNA or B-DNA-López is very close to the reported numbers for 1DPN5,
1DPL5, and 1ENN8 (Table 4).
Another way to perform the theoretical estimate of solvation layers is by the approximate determination of the relative density of a group of water molecules at regular distances from the DNA molecule. As explained in the description of analytical procedures (see Experimental Section), in all simulated systems the distance range related to the maximum in the density graph coincided with the first maximum in the radial distribution graph between 2.5 and 3.0Å (see Figure 3). Apparently, our protocol is able to satisfactorily delimit the first hydration layer of a
DNA double-helix oligomer comprising from 9 to 12 pairs of nucleotides.
B-DNA-d(TpA)12versus B-DNA-d(CpG)12
established between atoms of the DNA and the hydration shell during a single trajectory divided by the total number of configurations analyzed during the last 1.5ns of simulation, considering an H-bond criterion where the distance d(H…A) < 2.5Å and the angle T(D-H...A) > 135o.
Their results showed that O1P, O2P, major groove atoms N7(G and A), N4(C) and O4(T), and minor groove atoms O2(C and T) and N3(G and A) are apparently the strongest H-bond acceptors for solvent molecules, while O3’, and especially O4’ and O5’, are weaker H-bond acceptors. The low HB% for O4’ was attributed to a supposed involvement of this atom in a non-conventional contact C2’- H…O4’, a peculiarity not seen in our simulations, probably due to the conformational constraint imposed on DNA or to another methodological reason. Similarly to Auffinger and Westhof’s results,14 we did not record an expressive
hydration of the exocyclic amine group N6 of adenines, and we also observed in the simulations of d(AT)12 and d(CG)12 a higher hydration of the phosphate oxygens O1P and O2P and the base atoms N7(A and G), O4(T), O2(C and T), N4(C). In contrast, we noticed an appreciable hydration of atoms O6(G) and N2(G), and we did not observe a significant hydration of the minor groove N3(A and G) – the hydration of the exocyclic amine group N2(G), close to the N3, was the preferable hydrophilic group. Concerning the carbonyl oxygen O6(G), Auffinger and Westhof14found that this was one of the most important
potassium ion (K+) interaction sites and in our simulation,
without counter-ions, we observed a recurrent H-bond interaction of O6(G) with water molecules.
A hydration pattern observed by Auffinger and Westhof14 only for d(CG)
12 was the presence of long-lived
water molecule bridges (W) interconnecting O2(C)n…W…O4’n+1 and N3(G)n...W...O4’n+1, which persisted for more than 150ps. In our simulation we also observed this type of water bridge only for d(CG)12, but in
the case of guanine the bridge involved only the N2 atom, instead of N3.
During our simulations of B-DNA-d(CG)12 and B-DNA-d(AT)12 we observed interphosphate bridges involving two or more water molecules, as already recorded for the B-DNA-DD and B-DNA-López simulations.
In agreement with Auffinger and Westhof ’s simulations,14 we did not recognize the famous water spine
connecting minor groove atoms in the simulation of B-DNA-d(AT)12; the only observed hydration pattern was three isolated water bridges in different ApT steps linking the O2 oxygens from adjacent thymines of opposite strands, similar to the water bridge described in the AT tract of 1DPN.
During their simulations of DNA and RNA homoligomers, Auffinger and Westhof14 affirmed that “the
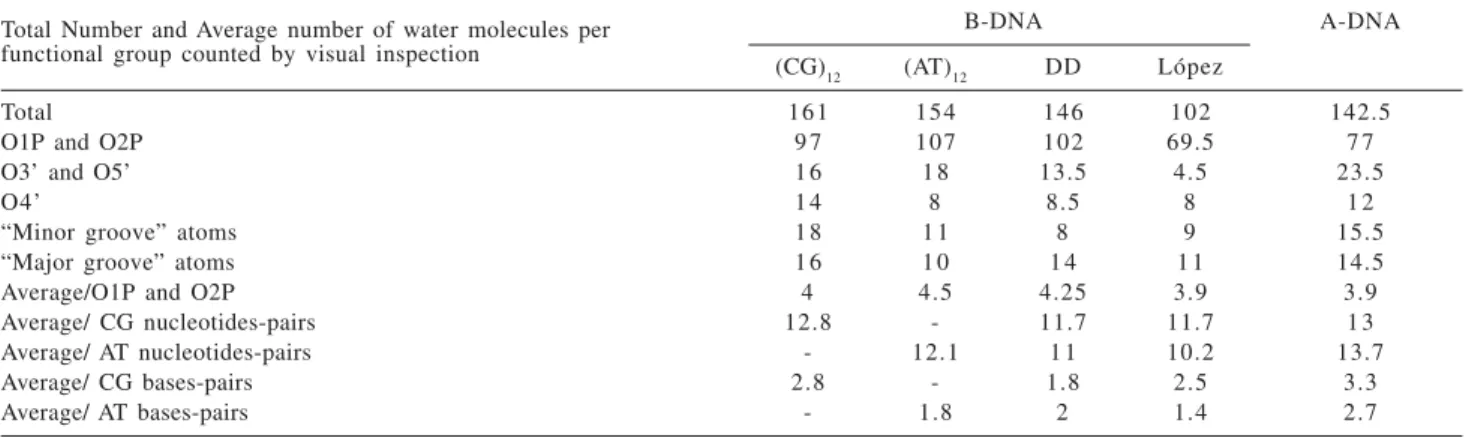
good level of convergence obtained for these simulations is reflected by the similar number of water molecules calculated around the backbone atoms, a property which is non-sequence dependent”. According to this criterion, we can also assume that our simulations achieved a good level of convergence if we compare the average number of water molecules interacting with the O1P and O2P phosphate oxygens (see Table 5).
B-DNA homoligomers versus B-DNA heteroligomers
Using high-precision densiometric and ultrasonic measurements, Chalikian and co-workers4 determined the
apparent molar volumes and compressibilities of DNA oligomers with varying base compositions and base sequences, and reached some general conclusions about the hydration of B-DNA duplexes: the CG base-pairs are more hydrated than the AT base-pairs and mixed base sequences are less hydrated than either CG or AT B-DNA homopolymers. In agreement with this experimental study,
Table 5. Total number of water molecules per functional group observed during the simulations of B-DNA-d(AT)12and B-DNA-d(CG)12, B-DNA-DD, B-DNA-López, A-DNA, and the average number of water molecules per pair of nucleotides and bases AT and CG
Total Number and Average number of water molecules per B-DNA A-DNA
functional group counted by visual inspection (CG)
12 (AT)12 DD López
Total 161 154 146 102 142.5
O1P and O2P 9 7 107 102 69.5 7 7
O3’ and O5’ 1 6 1 8 13.5 4.5 23.5
O4’ 1 4 8 8.5 8 1 2
“Minor groove” atoms 1 8 1 1 8 9 15.5
“Major groove” atoms 1 6 1 0 1 4 1 1 14.5
Average/O1P and O2P 4 4.5 4.25 3.9 3.9
Average/ CG nucleotides-pairs 12.8 - 11.7 11.7 1 3
Average/ AT nucleotides-pairs - 12.1 1 1 10.2 13.7
Average/ CG bases-pairs 2.8 - 1.8 2.5 3.3
we observed in most studies, independently of base sequence or duplex conformation, the superior hydration of the CG base-pairs in relation to the AT base-pairs; our simulations also showed a higher hydration of the CG and AT pairs of nucleotides in homopolymeric B-DNAs in comparison to B-DNAs with mixed sequences, suggesting that our protocol is able to discriminate B-DNA homoligomers from B-DNA heteroligomers (see Table 5).
Selecting potentially hydrophilic sites in unknown structures
Some of the hydration patterns detected at the end of the simulation protocol were already present after the third step of our protocol. This observation suggested a simple criterion for selecting the most hydrophilic sites in molecules with unknown first shell hydration arrangements. According to this criterion, the sites that are hydrated from the third step of the protocol until the end of the simulation could be considered as potentially hydrophilic sites, and those water molecules that visit them and interact through H-bonds, as assigned by Hyperchem, could eventually be considered as potential candidates for the crystallographic status of structural water molecules.
Conclusions
Using a simple low-cost computational protocol with mixed steps of molecular dynamics and energy minimization calculations employing the OPLS-AA force field, we were able to satisfactorily reproduce the main hydration patterns of the first shell water molecules of DNA heteroligomers in the A- and B-conformations, in agreement with atomic resolution crystal data.5,8
In the case of B-DNA homoligomers, the results obtained in our simulations were comparable to those described in the literature, which utilized a more sophisticated protocol and a longer MD simulation.14
Although our simulations were performed in the absence of counter-ions, without periodic boundary conditions and with a cut-off radius for the electrostatic calculations, we verified the principal structural arrangements of the water molecules of the first hydration layer, enabling the differentiation of the A-form from B-form DNA heteroligomers, and the B-DNA homoligomers from B-DNA heteroligomers as well.
Instead of average interaction distribution or location of water molecules of hydration, our protocol allows the approximate location of possible hydration sites including some water bridges, with similar characteristics to those described for high-resolution crystallographic structures.
The validity of such a protocol, which reproduces some of the hydration patterns around DNA oligomers seen in crystallographic studies, should be recognized, since longer and more sophisticated MD simulations that model the aqueous solution environment also correlate their results with crystallographic data.14,17-19 The agreement between the
hydration profile of nucleic acids in solution simulations and in high-resolution crystal data supports the idea that crystal structures give a confident picture of the first hydration shell of DNA’s oligomers, which may help in the understanding of many biologically relevant processes.
Acknowledgements
We thank Professor Dr. Bernard Maigret for providing us with the Hyperchem 6 Professional Package, and Professor Dr. Pedro G. Pascutti for the use of his DETPDB program. We also thank CAPES (PROCAD 003/01-8) and CNPq (Project 521071/01-1 (NV)) for support to this work. We are very grateful for relevant comments by the referees. We are also thankful to Peter Bakuzis and Susie Casement Moreira for english revision and helpful comments during the preparation of this manuscript"
References
1. Halle, B.; Denisov, V. P.; Biopolymers1998,48, 210; Shotton,
M. W.; Pope, L. H.; Forsyth, V. T.; Langan, P.; Grimm, H.;
Rupprecht, A.; Denny, R. C.; Fuller, W.; Physica B (Amsterdam,
Neth.) 1998,241-243, 1166; Auffinger, P.; Westhof, E.; J. Mol. Biol.2000,300, 1113.
2. Schneider, B.; Cohen, D. M.; Schleifer, L.; Srinivasan, A. R.;
Olson, W. K.; Bermas, H. M.; Biophys. J. 1993,65, 2291.
3. Jacobson, A.; Leupin, W.; Liepinsh, E.; Otting, G.; Nucleic
Acids Res. 1996,24, 2911.
4. Chalikian, T. V.; Sarvazyan, A. P.; Plum, E. G.; Breslauer, K. J.;Biochemistry1994,33, 2394.
5. Egli, M.; Tereshko, V.; Teplova, M.; Minasov, G.; Joachimiak, A.; Sanishvili, R.; Weeks, C. M.; Miller, R.; Maier, M. A.; An,
H.; Dan Cook, P.; Manoharan, M.; Biopolymers1998,48, 234.
6. Bloomfield, V. A.; Crothers, D. M.; Tinoco Jr, I.; Nucleic Acids
- Structures, Properties, and Functions; University Science
Books: California, 2000, ch. 11.
7. Drew, H. R.; Dickerson, R. E.; J. Mol. Biol.1981, 151, 535.
8. López-Soler, M.; Malinina, L.; Subirana, J. A .; J. Biol. Chem.
2000,275, 23034.
9. Cheatham III, T. E.; Young, M. A.; Biopolymers2001,56,
232; Beveridge, D. L.; McConnell, K. J.; Curr. Opin. Struct.
Biol.2000, 10, 182; Giudice, E.; Lavery, R.; Acc. Chem. Res.
10. Giambiagi, M.; Giambiagi, M.S.; Oliveira Neto, M.; Phys. Chem. Chem. Phys. 2001,3, 5059.
11. Jorgensen, W. L.; Chandrasekhar, J.; Madura, J. D.; Impey, R.
W.; Klein, M. L.; J. Chem. Phys. 1983,79, 926.
12. Pranata, J.; Wierschke, S. G.; Jorgensen, W. L.; J. Am. Chem.
Soc.1991, 113, 2810.
13.HyperChem 6 Professional; Hypercube, Inc.: Florida, 2000.
14. Auffinger, P.; Westhof, E.; J. Mol. Biol.2001,305, 1057.
15. Mazur, A. K.; J. Am. Chem. Soc.2002, 124, 14707.
16. Pascutti, P. G.; DETPDB, Program for Molecular Detail
Display from PDB Files, Universidade Federal do Rio de Janeiro, Brazil, 2001.
17. Feig, M.; Pettitt, B. M.; Biopolymers1998,48, 199.
18. Feig, M.; Pettitt, B.M.; J. Mol. Biol.1999,286, 1075.
19. Duan, Y.; Wilkosz, P.; Crowley, M.; Rosenberg, J. M.; J. Mol.
Biol.1997, 272, 553.
Received: April 1, 2004