www.bjorl.org.br
Brazilian Journal of
OTORHINOLARYNGOLOGY
1808-8694/$ - see front matter © 2014 Associação Brasileira de Otorrinolaringologia e Cirurgia Cérvico-Facial. Published by Elsevier Editora Ltda. All rights reserved.
DOI: 10.5935/1808-8694.20140009
ORIGINAL ARTICLE
Comparative study between pure tone audiometry and auditory
steady-state responses in normal hearing subjects
Roberto Miquelino de Oliveira Beck
a,*, Bernardo Faria Ramos
a, Signe Schuster Grasel
a,
Henrique Faria Ramos
b, Maria Flávia Bonadia B. de Moraes
a,
Edigar Rezende de Almeida
a, Ricardo Ferreira Bento
aa Department of Otorhinolaryngology, Faculdade de Medicina da Universidade de São Paulo (FMUSP), São Paulo, SP, Brazil b Hospital Universitário Cassiano Antônio de Moraes, Universidade Federal do Espírito Santo (UFES), Vitória, ES, Brazil
Received 26 March 2013; accepted 30 July 2013
KEYWORDS
Audiometry pure-tone; Audiometry evoked response;
Electrophysiology
PALAVRAS-CHAVE
Audiometria de tons puros;
Eletroisiologia;
Audição
Abstract
Introduction: Auditory steady-state responses (ASSR) are an important tool to detect objec-tively frequency-speciic hearing thresholds. Pure-tone audiometry is the gold-standard for hearing evaluation, although sometimes it may be inconclusive, especially in children and uncooperative adults.
Aim: Compare pure tone thresholds (PT) with ASSR thresholds in normal hearing subjects.
Materials and methods: In this prospective cross-sectional study we included 26 adults (n = 52 ears) of both genders, without any hearing complaints or otologic diseases and normal pure-tone thresholds. All subjects had clinical history, otomicroscopy, audiometry and immitance measurements. This evaluation was followed by the ASSR test. The mean pure-tone and ASSR thresholds for each frequency were calculated.
Results: The mean difference between PT and ASSR thresholds was 7,12 for 500 Hz, 7,6 for 1000 Hz,
8,27 for 2000 Hz and 9,71 dB for 4000 Hz. There were no difference between PT and ASSR means at either frequency.
Conclusion: ASSR thresholds were comparable to pure-tone thresholds in normal hearing adults.
Nevertheless it should not be used as the only method of hearing evaluation.
© 2014 Associação Brasileira de Otorrinolaringologia e Cirurgia Cérvico-Facial. Published by Elsevier Editora Ltda. All rights reserved.
Estudo comparativo entre audiometria tonal limiar e resposta auditiva de estado estável em normouvintes
Resumo
Introdução: As respostas auditivas de estado estável permitem avaliar de forma objetiva limiares auditivos frequência-especíica. A audiometria tonal é o exame padrão-ouro; no entanto, nem sempre pode ser conclusiva, principalmente em crianças e adultos não cola-borativos.
Objetivo: Comparar os limiares auditivos da RAEE aos da audiometria tonal em indivíduos com audição normal.
Please cite this article as: Beck RM, Ramos BF, Grasel SS, Ramos HF, Moraes MF, Almeida ER, et al. Comparative study between pure tone audiometry and auditory steady-state responses in normal hearing subjects. Braz J Otorhinolaryngol. 2014;80:35-40.
* Corresponding author.
Introduction
Auditory steady-state responses (ASSR) assessment has an important place in the arsenal of audiological
evaluation methods. Since the introduction of univer -sal neonatal hearing loss has been diagnosed earlier, and thus arises the need to define the characteristics of hearing loss in order to choose the most appropriate
treatment.1-3
Due to limitations of the responses obtained in behav-ioral tests in children younger than 6 months,
electrophysi-ological methods are the most used resources.
The tone-burst evoked potential is the preferred test
for frequency-speciic assessment in childhood, which pro -vides the electrophysiological threshold for each frequency
tested. The limitations of this procedure are time, since the test is usually long, and the dificulty and subjectivity in the interpretation of the responses. Nevertheless, the as
-sessment of evoked potentials with transient stimuli such as tone bursts does not allow for stimulation at levels greater than 90 dB HL.4
In adults, pure-tone (PT) audiometry is the gold stan
-dard for obtaining thresholds and audiometric conigura
-tion. However, this test is subjective and it is not always
possible to perform in children younger than 6 years of age,
especially when some psychomotor impairment is present.
The increasingly more frequent use of ASSR is due to the possibility of objectively evaluating the electrophysiological
thresholds in patients with suspected hearing impairment. For that purpose, it would be appropriate to perform a com
-parative study with other already established methods and ASSR. According to John and Picton,5 and Valdes et al.,6 the
method has advantages, such as the objective threshold
de-tection as well as the simultaneous evaluation of multiple
frequencies7 and the presentation of high intense stimuli.8
Since ASSR allows for the assessment of different fre -quencies in both ears at the same time, the duration of
the examination is usually shorter.9 As there are differ-ent ASSR equipmdiffer-ents and software, and a higher difference between PT and ASSR thresholds in the low frequency may occur, the results should be interpreted with cau
-tion.10-12
Among the software with large number of studies in the
literature, Audera and Multiple Auditory Steady-State
Re-sponse (MASTER) must be highlighted. The Audera is based
on single frequency stimulation, is usually monaural, and
uses phase coherence as a response detection method.13
The MASTER software allows for simultaneous binaural stimulation, with continuous tones at four frequencies (500, 1,000, 2,000, and 4,000 Hz) modulated in amplitude and frequency. It is believed that the responses generated in frequency modulation between 70 and 110 Hz relect the activity of the auditory brainstem structures.14
Responses are converted from their original form in the
time domain to the frequency domain by fast Fourier trans
-form (FFT). They appear as peaks in the modulation fre
-quency domain, which emerge from electroencephalogram (EEG).15 They are then evaluated against background noise, and statistical signiicance is determined by the software itself (MASTER) through the F-test.16,17
The results are shown as an electrophysiological audio
-gram, which allows the physician to see the coniguration
of hearing loss, if any, and make the appropriate choice of
treatment (ampliication, cochlear implant, or others).
Several studies have determined the reliability of
eval-uating the objective threshold in individuals with normal hearing or sensorineural hearing loss.18-20 Most of them
aimed to compare PT audiometry with ASSR, analyzing pa
-tients with varying degrees of hearing loss together with normal hearing individuals. Lins et al.10 evaluated 117 pa
-tients, including adults with and without hearing loss, ado
-lescents, and children. Canale et al.21 included 11 patients,
six of whom with normal hearing and ive with hearing loss. Valdes et al.6 studied 15 patients with normal hearing; how
-ever, they only evaluated the frequencies of 500 and 1,000 Hz. As for Brazilian authors, Ferraz et al.22 studied 25 indi
-viduals with no hearing complaints, whereas Duarte et al.23
evaluated 48 patients with varying types of hearing loss. The small number of publications at the Brazilian level and the need for standardization of thresholds in normal hearing subjects for clinical practice was the rationale for this study in this population. The MASTER software was cho
-sen, as it allows for binaural stimulation of four frequencies simultaneously.
This study aimed to compare the electrophysiological
thresholds obtained by ASSR with those obtained by PT au
-diometry in normal hearing adults.
Materiais e métodos: Foram incluídos neste estudo prospectivo de corte transversal 26 adul -tos (52 orelhas), de ambos os gêneros, com audiometria normal e sem queixas otológicas. Os pacientes foram submetidos a anamnese, otomicroscopia, audiometria e imitanciometria. A seguir, realizou-se avaliação de respostas auditivas de estado estável. Os resultados obtidos foram analisados estatisticamente e comparados entre si.
Resultados: A diferença entre os limiares (em dB NA) obtidos em ambos os exames para cada frequência testada foi de 7,12 dB para 500 Hz; 7,6 dB para 1000 Hz; 8,27 dB para 2000 Hz e 9,71 dB para 4000 Hz, com limiares mais elevados na RAEE, em todas as frequências. Não houve diferença estatística entre as médias para cada frequência testada.
Materials and methods
Participants
A total of 28 normal hearing adults (n = 56 ears), of both genders, between 18 and 35 years were evaluated in this cross-sectional study. The study was performed between July and December of 2011. All participants were informed of the study purpose and signed the informed consent. The study was approved by the ethics committee of the institu
-tion under number 0058/11.
The individuals were selected according to the follow
-ing inclusion criteria: no ear or hear-ing complaints; nor
-mal otomicroscopy; nor-mal PT audiometry; with thresholds ≤ 25 dB HL at frequencies of 250, 500, 1,000, 2,000, 3,000, 4,000, 6,000 and 8,000 Hz; normal immitance, i.e., type A tympanometry; and present stapedial relexes. The study excluded individuals with any morphological and functional alterations of the external or middle ear, detected at the anamnesis or otorhinolaryngological examination, as well as those who had any of the above mentioned hearing disor
-ders or neurological alterations. Those who did not reach
an appropriate level of electroencephalographic noise for
response recording (< 30 μV) were also excluded.
Audiological assessment
Anamnesis and otorhinolaryngological clinical
exa-mination
All patients underwent otorhinolaryngological clinical ex
-amination directed at hearing complaints. Then all patients were submitted to otomicroscopy (model M9000 - DF Vas
-concellos - Valença, RJ, Brazil).
Audiometry and immitanciometry
PT audiometry was performed in a sound booth using a Mad -sen Midimate 622 audiometer (GN Otometrics - Copenha-gen, Denmark) calibrated according to American National
Standards Institute (ANSI) S3.6-1996 standards. Tone thresh
-olds by air conduction were obtained with PT at frequencies of 500, 1,000, 2,000, and 4,000 Hz presented through su
-pra-aural headphones (TDH 39).
For tympanometry and stapedial relex measurements at 500, 1,000, 2,000, and 4,000 Hz, an AZ26 Interacoustics imped
-anciometer (Interacoustics A/S - Assens, Denmark) was used.
Stimuli and auditory steady-state response
acqui-sition
Bio-Logic Navigator Pro 580 NAVPR2 equipment (Natus Med -ical Incorporated - San Carlos, CA, USA) and the MASTER
2.04.i00 software were used. Stimuli by air conduction were calibrated in dB NPS, according to the ANSI S3.6-1996 stan
-dard, using a Quest Model 1700 sound level meter with a
2 cm3 Brüel & Kjær DB138 coupler.
The disk electrodes were placed on the frontal region (Fz) as the active electrode, neck (Oz) as reference, and right shoulder as ground (Pz). Eight simultaneous stimuli of modulated continuous tones (100% modulation in expo
-nential amplitude and 20% in frequency) were offered, fol
-lowing the procedure pre-established by the manufactur
-er, starting at 40 dB HL. Modulation rates for the right ear were 84.375 Hz, 89.062 Hz, 93,750 Hz and 98,437 Hz for 500, 1,000, 2,000, and 4,000 Hz, respectively, and for the left ear, 82.031 Hz, 86.719 Hz, 91.406 Hz and 96.094 Hz for 500, 1,000, 2,000, and 4,000 Hz, respectively. The maxi
-mum number of sweeps (32 sweeps at the intensities of 40 dB HL and 30 dB HL and 40 scans at lower intensities down to threshold) were performed following the manufacturer’s recommendation to ensure better test reliability.
The threshold was established by modifying the intensity level by 5 dB HL, the same procedure used in audiometry. All ASSR thresholds were retested. Sweeps containing elec
-trophysiological activity > 90 nV were eliminated.17,18,24 The signiicance of the signal-to-noise ratio was veriied by the F-test with a 95% conidence interval for each sweep. The response was considered present when the F-value was signiicant at the level of p < 0.05 in at least eight consec
-utive sweeps.25
Statistical analysis
The mean threshold obtained by PT audiometry and audi
-tory steady state response (ASSR) was compared at 500, 1,000, 2,000, and 4,000 Hz.
The descriptive analysis of the thresholds in PT audiome
-try and ASSR were performed by calculating central tenden -cy measures (such as means), and measures of dispersion (such as the standard deviation [SD] and standard error) for each frequency in both methods, considering a normal data
distribution.
The difference between the means at 500, 1,000, 2,000, and 4,000 Hz was calculated by analysis of variance (ANO
-VA). The same test was used to assess the threshold differ
-ences between males and females, as well as between right and left ears (p < 0.05).
Results
Among the 28 initially recruited subjects (n = 56 ears), two were excluded as they failed to reach suficient relaxation to a noise level < 30μV.
The study encompassed 17 females and 9 males. There was no significant difference between genders (p = 0.82).
Among the 26 subjects, measurable thresholds were ob
-tained in 100% of the tested frequencies in ASSR.
The age of the evaluated subjects ranged from 22 to 31
years (mean: 27.3 years; SD: 2.26 years).
The separate analysis of the right and left ears showed no difference in thresholds between them (p = 0.34). For further analyses, all ears were analysed together.
Table 1 presents the mean, standard deviation, and standard error of audiometric thresholds and steady-state
Table 1 Mean audiometric thresholds and steady-state responses (n = 52 ears) for each frequency with standard deviation (SD)
and standard error.
Audiometry ASSR
Frequency (Hz) n Mean (dB HL) SD Standard error Mean (dB HL) SD Standard error
500 52 11.63 4.51 0.63 18.75 7.73 1.07
1000 52 7.02 5.17 0.72 14.62 6.48 0.9
2000 52 4.81 5.33 0.74 13.08 5.16 0.72
4000 52 5.19 5.94 0.82 14.9 5.56 0.77
Table 2 Mean thresholds obtained for each frequency in each test and the corresponding difference between the means (p = 0.30 - ANOVA, n = 52 ears).
Frequency
(Hz) n
Mean audiometry
Mean
ASSR Difference
500 52 11.63 18.75 7.12
1000 52 7.02 14.62 7.6
2000 52 4.81 13.08 8.27
4000 52 5.19 14.9 9.71
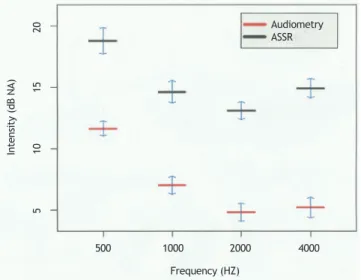
Fig. 1 shows the association between the thresholds ob
-tained in the two aforementioned examinations. Thresholds obtained in the steady-state responses were consistently higher. The mean difference between the thresholds in both tests was 8.175 dB, which remained constant at all frequen
-cies (p = 0.30), i.e., there was no variability between the frequencies investigated by the two methods (Table 2).
Discussion
Several authors6,10,18,23,25-27 have reported better
cor-relation of PT thresholds and steady-state responses in patients with sensorineural hearing loss as compared to those with normal hearing. It has been suggested that this difference may relect an increase in the amplitude of response due to the presence of recruitment.21,28
In 2012, Korczak et al.29 reported that there is no dif-ference between ASSR and PT thresholds in individuals with sensorineural hearing loss compared with those with normal
hearing, both in the stimulation of a single frequency and
with multiple simultaneous frequencies.
In the present study, a difference of 7.12, 7.6, 8.27, and 9.71 dB was observed at frequencies of 500, 1,000, 2,000, and 4,000 Hz, respectively, reaching a mean dif
-ference of 8.175 dB HL between audiometric and elec
-trophysiological thresholds. There was no statistical difference between the values obtained at the assessed frequencies (p = 0.30).
In 2006, Canale et al.21 reported a mean difference of
audiometric and ASSR thresholds in individuals with normal hearing of 32 dB, while Ferraz et al.22 reported a mean
dif-ference of 20 dB. Other authors6,29 observed results with a smaller mean difference between tests, but always above 10 dB.
Some studies8,19,26,27,30 have found major differences
in the frequencies of 500 and 4,000 Hz, differing from the present study, in which there was no signiicant differ
-ence between the thresholds of the four frequencies. One reason for this inding is possibly sample homogeneity, comprising only individuals with normal hearing and age 22 to 31 years.
The smaller difference between the thresholds ob
-tained in both tests shown in this study when compared to the literature is probably due to sample size (larger
than most reported in the literature) and the adequate
test conditions, especcially low background noise, allow
-ing the identiication of responses at very low intensities, which usually have a small amplitude. The test was com
-pleted after averaging 32 scans at intensities of 40 dB HL and 30 dB HL and 40 sweeps at lower intensities (maxi
-mum sweep number suggested by the software) for each intensity, approaching electrophysiological to PT thresh
-olds. As the threshold was assessed at 5 dB intervals, the same procedure used for PT audiometry, an increase in accuracy and decrease in variability of values was ob
-tained.
Figure 1 Mean thresholds on PT and ASSR and respective standard
errors. The igure shows the mean thresholds obtained in tonal audiometry and auditory steady-state responses (ASSR) at fre-quencies of 500, 1,000, 2,000, and 4,000 Hz with their respective standard error (n = 52 ears).
Audiometry ASSR
500 1000 2000 4000
5
10
15
20
Frequency (HZ)
In
te
ns
it
y
(d
B
N
It is important to highlight that similar results may not
be obtained in clinical practice. It is not always suitable to estimate ASSR thresholds at 5 dB intervals, as it can great
-ly increase the test time without adding data which may modify the decision on the best therapeutic approach.31
Varied age ranges (including elderly and children), levels
of relaxation in awake patients, or EEG changes during sedation/anesthesia may also interfere in the threshold evaluation.
As electrophysiological thresholds are approximately 10 dB HL above the tonal thresholds, the software provides a correction factor. Its use, as suggested by the software Mas
-ter Bio-Logic Navigator Pro 580 NAVPR2 (Mundelein, Il) of 10 dB for frequencies tested, brings the ASSR results even closer to those obtained by the audiometry.
Although this study is one of the largest exclusively normal hearing individuals, further studies with larger
numbers of participants or multicenter studies are
need-ed in order to conirm these results, especially in the Bra
-zilian population.
These thresholds, obtained with modulated continu
-ous-tone stimuli using the MASTER software, should not be extrapolated to represent those acquired from other available equipment that evoke ASSR with different types of stimuli (e.g. Chirp) and other methods of response de
-tection. Further studies are needed in order to evaluate
different methods of ASSR stimulation and detection to
as-sess whether the thresholds are comparable, thus providing greater accuracy for the physician when estimating hearing thresholds.
Conclusion
The ASSR thresholds were comparable to those of tonal audiometry in individuals with normal hearing, and they showed a mean difference that remained constant at all tested frequencies. However, as electrophysiological tests
only estimate hearing thresholds, the ASSR should not be
used as the sole method of auditory assessment.
Conlicts of interest
The authors declare no conlicts of interest.
References
1. Ribeiro FM, Carvallo RM, Marcoux AM. Auditory steady-state
evoked responses for preterm and term neonates. Audiol Neu
-rootol. 2010;15:97-110.
2. D’Haenens W, Vinck BM, De Vel E, Maes L, Bockstael A, Ke
-ppler H, et al. Auditory steady-state responses in normal hearing adults: a test-retest reliability study. Int J Audiol. 2008;47:489-98.
3. Rodrigues GR, Lewis DR, Fichino SN. Steady-state auditory evoked responses in audiological diagnosis in children: a comparison with brainstem evoked auditory responses. Braz J Otorhinolaryngol. 2010;76:96-101.
4. Introduction to auditory evoked responses measurement. In:
Hall JW III. New handbook of auditory evoked responses. Bos
-ton: Allyn and Bacon; 2006. p. 58-108.
5. John MS, Picton TW. A Windows program for recording multiple auditory steady-state responses. Comput Methods Programs Biomed. 2000;61:125-50.
6. Valdes JL, Perez-Abalo MC, Martin V, Savio G, Sierra C, Ro
-driguez E, et al. Comparison of statistical indicators for the automatic detection of 80 Hz. auditory steady-state responses. Ear Hear.1997;18:420-9.
7. John MS, Lins OG, Boucher BL, Picton TW. Multiple auditory
steady-state responses (MASTER): stimulus and recording para
-meters. Audiology. 1998;37:59-82.
8. Rance G, Dowell RC, Rickards FW, Beer DE, Clark GM. Steady
--state evoked potential and behavioral hearing thresholds in a group of children with absent click-evoked auditory brain stem response. Ear Hear. 1998;19:48-61.
9. Picciotti PM, Giannantonio S, Paludetti G, Conti G. Steady state auditory evoked potentials in normal hearing subjects:
evaluation of threshold and testing time. ORL J Otorhinolaryn
-gol Relat Spec. 2012;74:310-4.
10. Lins OG, Picton TW. Auditory steady-state response to multiple simultaneous stimuli. Electroencephalogr Clin Neurophysiol. 1995;96:420-32.
11. Herdmann AT, Stapells DR. Auditory steady-state response thresholds of adults with sensorineural hearing impairments. Int J Audiol. 2003;42:237-48.
12. Picton TW, van Roon P, John MS. Multiple auditory steady state
responses (80-101Hz: effects of ear, gender, handedness, in
-tensity and modulation rate. Ear Hear. 2009;30:100-9. 13. Luts W, Wouters J. Comparison of MASTER and AUDERA for
measurement of auditory steady-state responses. Int J Audiol. 2005;44:224-53.
14. Herdmann AT, Picton TW, Stapells DR. Place speciicity of mul
-tiple auditory steady-state responses. J Acoust Soc America. 2002;112:1569-82.
15. Josilene LD. A utilização da resposta auditiva de estado estável para estimar limiares auditivos em indivíduos com perda
audi-tiva neurossensorial [MSc dissertation]. Bauru (SP): Universida
-de -de São Paulo; 2007.
16. Grasel SS, Ramos HF, Beck RMO, Almeida ER. Evaluation of he
-aring loss in childhood. In: Sih T, Chinski A, Eavey R, Godinho R. IX IAPO: Manual of pediatric otorhinolaryngology. São Paulo: Editora e Gráica Vida & Consciência; 2010. p. 243-62. 17. Ramos HF, Grasel SS, Beck R, Ramos M, Ramos B, Almeida R, et
al. Evaluation of residual hearing in cochlear implants candi
-dates using auditory steady-state response. Int J Audiol. 2013. In press.
18. Dimitrijevic A, John MS, Van RP, Purcell DW, Adamonis J, Os
-troff J, et al. Estimating the audiogram using multiple auditory steady-state responses. J Am Acad Audiol. 2002;13:205-24 19. Herdmann AT, Stapells DR. Thresholds determined using the
monotic and dichotic multiple auditory steady-state res-ponse technique in normal-hearing subjects. Scand Audiol. 2001;30:41-9.
20. Thumak AL, Rubinstein E, Durrant JD. Meta-analysis of varia
-bles that affect accuracy of thresholds estimation via mea-surement of the auditory steady-state response (ASSR). Int J Audiol. 2007;46:692-710.
21. Canale A, Lacilla M, Cavalot AL, Albera R. Auditory steady-s
-tate responses and clinical applications. Euro Arch Otorhino
-laryngol. 2006;263:499-503.
22. Ferraz OB, Freitas SV, Marchiori LLM. Análise das respos
-tas obtidas por potenciais evocados auditivos de estado estável em indivíduos normais. Rev Bras Otorrinolaringol. 2002;68:480-6.
23. Duarte JL, Alvarenga KF, Garcia TM, Costa Filho OA, Lins OG.
Auditory steady-state response in the auditory evaluation: cli
-nical application. Pro Fono. 2008;20:105-10.
24. Attias J, Buller N, Rubel Y, Raveh E. Multiple auditory steady
25. D’haenens W, Vinck BM, Maes L, Bockstael A, Keppler H, Philips B, et al. Determination and evaluation of clinically eficient stopping criteria for the multiple auditory steady-state respon-se technique. Clin Neurophysiol. 2010;121:1267-78.
26. Rance G, Rickards FW, Cohen LT, De Vidi S, Clark GM. The automated prediction of hearing thresholds in sleeping sub-jects using auditory steady-state evoked potentials. Ear Hear. 1995;16:499-507.
27. Picton TW, Durieux-Smith A, Champagne SC, Whittingham J, Moran LM, Giguère C, et al. Objective evaluation of aided thresholds using auditory steady-state responses. J Am Acad Audiol. 1998;9:315-31.
28. Perez-Abalo MC, Savio G, Torres A, Martín V, Rodríguez E, Galán
L. Steady state responses to multiple amplitude-modulated to
-nes: an optimized method to test frequency-speciic threshol
-ds in hearing-impaired children and normal-hearing subjects. Ear Hear. 2001;22:200-11.
29. Korczak P, Smart J, Delgado R, Strobel TM, Bradford C. Auditory steady-state responses. J Am Acad Audiol. 2012;23:146-70.
30. Lins OG, Picton TW, Boucher BL, Durieux-Smith A, Champagne
SC, Moran LM, et al. Frequency-speciic audiometry using ste
-ady-state responses. Ear Hear. 1996;17:81-96.