Hearing Pro
fi
le of Brazilian Forestry Workers
’
Noise Exposure
Adriana Lacerda
1Juliana Quintiliano
1Diolen Lobato
1Claudia Gonçalves
1Jair Marques
11Communication Disorder, Universidade Tuiuti do Paraná, Curitiba,
Paraná, Brazil
Int Arch Otorhinolaryngol 2015;19:22–29.
Address for correspondence Adriana Lacerda, MSc, PhD, Mestrado e doutorado em distúrbios da comunicação, UTP, Rua Sidney Lima Santos 238 238, Curitiba, Paraná 82.010-330, Brazil
(e-mail: [email protected]).
Introduction
Brazil is the sixth largest country in terms of reforested area in the world, with 4.98 million hectares in 2000. Brazil has 14% of the worldwide forest coverage and possesses possible extensive areas for cultivation. This area possibly increased by at least 220 to 230 thousand hectares per year in the period between 2003 and 2010, due to paper and cellulose companies.1
There arefive main reforesting agents in Brazil: cellulose companies, steelmaker companies, wooden solid products companies (such as lumber and sheets of wood), state
govern-ments (through their forest institutes), and small producers. Besides these, there have been several other companies and rural producers who have reforested due to very different aims.1
Forestry activity has also grown and new technologies have been applied in this area, which have saved forestry workers from rudimentary activities, such as chopping with an axe or manual saw, with a gradual implementation of automated machines on timber harvesting. Even so, according to Occupation Safety and Health Administration (OSHA), logging is the most dangerous occupation in the United States. Therefore, studies are needed to improve the
Keywords
►
noise-induced hearing
loss
►
occupational health
►
noise
Abstract
Introduction
Researchers studying the hearing health of forestry workers have
revealed the presence of a noise-induced hearing loss (NIHL) in this population and
have concluded that the vibration of the equipment, the carbon monoxide released by
motors, and pesticides might also contribute to NIHL.
Objective
To analyze the noise exposure in the Brazilian forestry industry workers and
the effects on hearing.
Methods
The study sample comprised 109 employees of a company that specialized
in reforestation. Their participants
’
mean age was 35.5 years (21 to 54 years), mean
tenure at the company was 3.9 years (1 to 13 years), and mean total duration of noise
exposure was 12.3 years (1 to 30 years). The existing documentation reporting on the
jobs risk analysis was examined, noise level was measured, and pure tone audiometry
was performed in all participants. Participants were divided into three groups according
to their noise exposure levels in their current job.
Results
Of the participants who were exposed to noise levels less than 85 dBA
(decibels with A-weighting
fi
lter), 23.8% had hearing loss, and 5.5% of the participants
who were exposed to noise ranging from 85 to 89.9 dBA and 11% of the participants
who were exposed to noise greater than 90 dBA had audiogram results suggestive of
NIHL.
Conclusion
The implementation of a hearing loss prevention program tailored to
forestry workers is needed.
received February 24, 2014 accepted March 21, 2014 published online July 22, 2014
DOI http://dx.doi.org/ 10.1055/s-0034-1382098. ISSN 1809-9777.
Copyright © 2015 by Thieme Publicações Ltda, Rio de Janeiro, Brazil
workers’ health conditions, security, comfort, and well-being.2
Other risks present in forestry activity include intense noise, vibrations, temperature variation, altitude, and pesti-cides, among others. These, when exceeding the recom-mended limits, might provoke several diseases that modify workers’well-being.3
These effects on forestry worker health have been mostly due not only due to equipment characteristics and conditions but also because of a lack of protective measures and knowl-edge of the risks by users, along with daily exposure and inappropriate work postures, which might be associated with the workplace.
Research has been performed to determine whether the noise of logging equipment causes negative effects on the hearing capacities of the operators. Research related to hear-ing health of forestry workers has revealed the presence of noise-induced hearing loss (NIHL) in this population, and authors have found that the vibration of the equipment, the carbon monoxide released by motors, and pesticides might also contribute to or exacerbate NIHL.3–13Longitudinal
stud-ies (1997 to 2003) have shown that the hearing difficulty of forestry workers is most prevalent when compared with other categories of work. The prevalence ratio of this profes-sional category has been 1.73 (95% confidence interval: 1.32 to 2.27).
Thus, the aim of this study was to analyze the noise exposure in Brazilian forestry industry workers and the effect on the hearing.13
Methods
This cross-sectional study was approved by the Ethics Com-mittee under the protocol number 0030/2007. The partici-pants of this research received an explanation letter, and they signed a clarified and free informed consent form to allow the usage of the collected data and to ensure the confidentiality regarding the identification of the participants.
The company studied was located at the city of Telemaco Borba, in the state of Parana; it specializes in reforestation and has a total of 250 employees in both administrative and operation positions. It had various machines to prepare, plant, and maintain forests, as well as for other activities related to silviculture.
The activities performed by the company’s employees included silviculture (soil preparing, controlling of leaf-cut-ting ants, planleaf-cut-ting, fertilizing, controlling of weeds, cultural treatments, forest protection) and forest harvesting (felling, dragging, processing, stacking, and transporting).
The company has two health and occupational safety programs: Program for the Prevention of Environmental Risks14 and the Medical Control and Occupational Health
Program.15Tonal audiometry tests were given only to
work-ers exposed to noise levels over 80 dBA (decibels with A-weightingfilter), as described in Attachment 1 in Regulatory Norm 7 (NR 7)15from the Ministry of Labor. The company
does not have a hearing loss prevention program implemented.
The participants were invited to participate in the study at the time of a periodic audiometry completed from March 2007 to October 2007. All participants who were invited to participate accepted and none were excluded. The sample was composed of 109 men, with mean age of 35.5 years (21 to 54 years), who worked in the company for a mean period of 3.9 years (1 to 13 years), in different posts, such as forest harvesting, yard movement, machinery rental, soil preparation, silviculture, and general cargo transporta-tion. The participants were grouped according to the levels of exposure to noise at their current job.
The exposure to noise data were collected from the Environmental Prevention of Risk Program (ERPP), following the patterns of the Brazilian laws (Regulatory Norm [RN] 15),16 and using a dosimeter, model DOS-500, Instruthem
(Brazil), at a measuring band of 70 to 140 dBA. The dosimeters were put into the participants’pockets with the microphones set close to the ear. This aimed to verify the allowed maximum dosage of 85 dBA for 8-hour working day (NR 15, which deals with the Unhealthy activities and operation—Brazilian Min-istry of Labor—Brazilian Ordinance no. 3.124 of 06/08/1978). As part of the hearing evaluation, anamnesis was obtained, as well as history of life habits and occupational history of the subjects. The participants were also questioned about their use of ear protection (yes or no) and which model was used (plugs or muffs). Then they had conventional tonal audiome-try. Preceding the audiological tests, the inspection of the external acoustic meatus was performed to verify whether it would be possible to execute the tests using a meatoscope, model TK 007, Missouri, USA.
Audiological tests were executed in an acoustic cabin, following the international recommendations (ISO 8235), using an Auditec (USA) audiometer model VSD 2090 with phone THD-39, which was calibrated according to the inter-national norm American National Standards Institute (ANSI) S. 31–1999.17The participants took an acoustic rest of at least 14 hours before this test execution, following the criteria of the Ordinance 19 from Brazilian Ministry of Labor (1998).15
The tonal audiometry by air conduction at 250- to 8,000-Hz frequencies and by bone conduction at 500- to 4,000-8,000-Hz frequencies were only executed when the hearing thresholds were higher than 25-dB hearing level (HL).
Audiometry results were classified according to NR 7 criteria, Attachment 2—Ordinance 9 from Brazilian Ministry of Labor.15 In accordance with this ordinance, audiograms
showing hearing thresholds less than or equal to 25-dB HL in all the examined frequencies were considered within normal limits. Audiograms at frequencies of 3 and/or 4 and/or 6 kHz with hearing thresholds higher than 25-dB HL both in the air and bone conduction tests, in one or both sides, were considered suggestive of NIHL. Audiograms that did notfit the above descriptions were considered not suggestive of NIHL.
Statistical Analysis
Analysis of variance, chi-square and Kruskal-Wallis tests, and the test of different proportions, with a 5% significance level (0.05), were used as appropriate. Age as a confounding variable was controlled for using the presbycusis hearing thresholds at the 50th percentile of the Norma ANSI S3.4 1996 standard.18
Results
►Table 1illustrates the sample regarding age, period of years
at the current company, and total time of occupational exposure to noise in relation to the level of exposure to noise at the company. There was a statistically significant difference in relation to years at the current company and total exposure time to noise (p<0.05). It was not possible to determine the time of exposure to noise at previous workplaces. Most of the participants were exposed to noises less than 85 dBA (55.97%). The audiometry results were classified according to NR 7 criteria and showed 61 cases considered within the acceptable limits, 54 considered suggestive of NIHL, and 14 considered not suggestive of NIHL.
►Table 2illustrates the distribution of the jobs regarding
level of exposure to noise at the current company and the ratio of cases with and without a suggestive NIHL audiogram.►Table 3shows the distribution of the results
regarding exposure to noise dosage in relation to noise level. ►Table 4 shows the distribution of frequencies in
relation to noise level (in decibels with A-weighting filter per 8-hour exposure daily with conversion factor of 5 dBA [dBA/LAeq-8h]) and the type of hearing protector used. The
plug-type protectors (3M model CA 14471, Brazil) have a 10-dB NRRsf (noise reduction rating - subjectfit), and the shell-type protectors (3M models CA 7166) have an 18-dB NRRsf. Finally,►Table 5shows the distribution of frequencies of the
groups according to the classification of the audiometry, tinnitus, and hearing loss complaints (test of different proportions).
The chi-square test was used to verify the relationship between the audiometry classification and the years at company, time of total exposure to noise, tinnitus, and hearing loss complaints. To apply the test, audiometry classi-fication was divided into three bands (less than 3 years, from 3 to 6 years, and 7 or more years) and the time of total exposure to noise was divided into the bands less than 10 years, from 10
to 19 years, and 20 years or more. A significant relationship was observed among the audiometry classification, the years at company (p<0.0001), the time of total exposure to noise (p¼0.0034), and hearing loss complaint (0.0045).
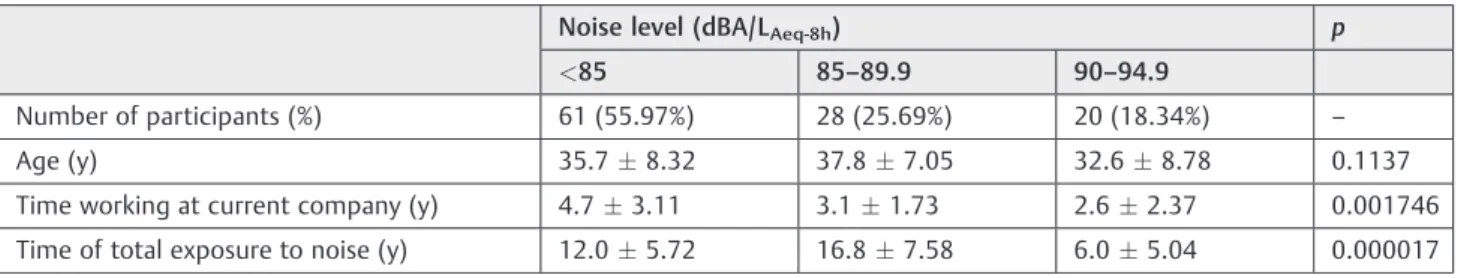
►Fig. 1shows the mean, minimum, and maximum values
of the hearing thresholds in the right ear (►Fig. 1A) and left
ear (►Fig. 1B) of the group that showed a noise level<85 dBA/LAeq-8hand the mean hearing values of the ANSI S3.44
norm for individuals of 30 years (50th percentile).►Fig. 2
shows the mean, minimum, and maximum values of the hearing thresholds in the right ear (►Fig. 2A) and left ear
(►Fig. 2B) of the group that showed a noise level ranging from
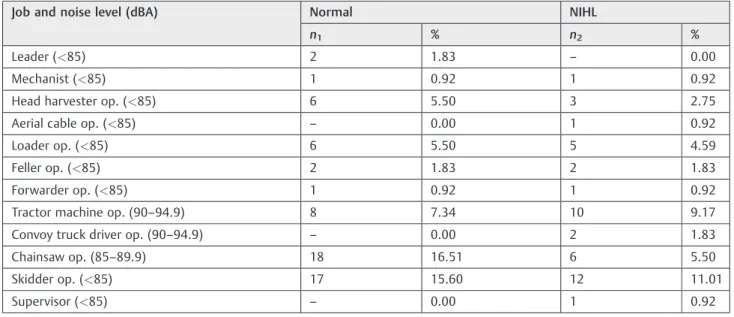
85 to 89.9 dBA/LAeq-8hand the mean hearing values of the
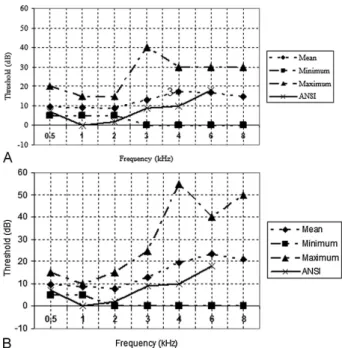
ANSI S3.44 norm for individuals of 30 years (50th percentile).►Fig. 3 shows the mean, minimum, and
maxi-mum values of the hearing thresholds in the right ear (►Fig. 3A) and left ear (►Fig. 3B) of the group that showed
a noise level ranging from 90 to 94.9 dBA/LAeq-8h and the
mean hearing values of the ANSI S3.44 norm for individuals of 30 years (50th percentile).
The Kruskal-Wallis test was performed for the mean, minimum, and maximum hearing thresholds of the partic-ipants. Results showed that there was no significant differ-ence between mean (p>0.05 in all the tested frequencies) and minimum thresholds of the three groups (p¼0.2149). For the maximum thresholds, results showed significant differences among groups (p¼0.0244), with noise< 85-dBA group6¼noise from 85- to 89.9-dBA group; noise< 85-dBA group6¼noise from 90- to 94.9-dBA group and noise from 85- to 89.9-dBA group6¼noise from 90- to 94.9-dBA group.
Discussion
This study was executed with the aim to analyze the noise exposure in the Brazilian forestry industry workers and the effects on the hearing. The company studied had a great turnover of staff, which influenced length of time on the job with statistically significant differences between time with the company and the time of total exposure to noise (►Table 1). Therefore, this turnover made it difficult to assess
exposure to noise analysis during the work life of the worker. In this study, only the information about noise level of the studied company was available. The turnover of staff could be explained due poor work conditions. Because this work
Table 1 Description of age, years at current company and time of total occupational exposure at current company of the participants regarding to the level of exposure to noise at the current company
Noise level (dBA/LAeq-8h) p
<85 85–89.9 90–94.9
Number of participants (%) 61 (55.97%) 28 (25.69%) 20 (18.34%) –
Age (y) 35.78.32 37.87.05 32.68.78 0.1137
Time working at current company (y) 4.73.11 3.11.73 2.62.37 0.001746
Time of total exposure to noise (y) 12.05.72 16.87.58 6.05.04 0.000017
requires great physical labor and unfavorable conditions, studies have demonstrated how such work could influence health and well-being of workers, resulting in reduced quality of life.3,19,20This situation was worsened because the
com-pany did not have a Medical Control and Occupational Health Program.
In Brazil, legislation has established tolerance limits for continued or intermittent noise through NR 15, which is 85-dBA allowed maximum exposure for 8 hours daily with conversion factor of 5 dBA, according to Attachments I and II (Brazil, NR 15). In this present study, the mean noise levels (dBA/LAeq-8h) at different job placements ranged from<80 to
92.9 dBA and the maximum noise levels (dBA/LAeq-8h) ranged
from 81.1 to 111.8 dBA, with 44.03% of the workers exceeding the limit allowed by the legislation and exposing themselves to risk of hearing loss. This means the company must provide protective equipment to workers (►Table 2).
►Table 2shows the audiograms most suggestive of NIHL
were found in workers with the jobs of skidder operator (11.01%), machine/tractor operator (9.17%), chainsaw opera-tor (5.50%), and loader operaopera-tor (4.59%). In addition to producing noise, all these machines also vibrate and release carbon monoxide due to diesel fuel motor combustion.3,10
Other studies on occupational exposure of forestry workers Table 2 Ratio of normal and suggestive NIHL audiograms related to the job at the company regarding to level of exposure to noise— test of different proportions
Job and noise level (dBA) Normal NIHL
n1 % n2 %
Leader (<85) 2 1.83 – 0.00
Mechanist (<85) 1 0.92 1 0.92
Head harvester op. (<85) 6 5.50 3 2.75
Aerial cable op. (<85) – 0.00 1 0.92
Loader op. (<85) 6 5.50 5 4.59
Feller op. (<85) 2 1.83 2 1.83
Forwarder op. (<85) 1 0.92 1 0.92
Tractor machine op. (90–94.9) 8 7.34 10 9.17
Convoy truck driver op. (90–94.9) – 0.00 2 1.83
Chainsaw op. (85–89.9) 18 16.51 6 5.50
Skidder op. (<85) 17 15.60 12 11.01
Supervisor (<85) – 0.00 1 0.92
Abbreviations: dBA, decibels with A-weightingfilter; NIHL, noise-induced hearing loss; op., operator.
Note: The forestry harvester is responsible for cutting and cubing logs, removing twigs, peeling and processing logs; forwarders use autoloader tractors for transferring logs in access areas difficult for road trucks; feller-bunchers are machines that fell the trees; skidders are forestry tractors used for dragging trees and logs; loaders are forestry tractors used for loading of logs; aerial cable is equipment joined to a tractor and used for removing the logs from difficult areas.
Table 3 Distribution of the results regarding dose of exposure to noise in relation to noise level (dBA/LAeq-8h)
Dose (%) dBA/LAeq-8h Total,n5(%)
<85,n1(%) 85–89.9,n2(%) 90–94.9,n3(%) No information,n4(%)
63.3 18 (16.51) – – – 18 (16.51)
64.0 4 (3.67) – – – 4 (3.67)
68.6 4 (3.67) – – – 4 (3.67)
69.2 3 (2.75) – – – 3 (2.75)
70.2 29 (26.61) – – – 29 (26.61)
76.5 – 28 (25.69) – – 28 (25.69)
83.2 – – 2 (1.83) – 2 (1.83)
92.52 – – 18 (16.51) – 18 (16.51)
No information 2 (1.83) – – 1 (0.92) 3 (2.75)
Total 60 (55.05) 28 (25.69) 20 (18.34) 1 (0.92) 109 (100)
have described the results on noise exposure, revealing that the National Institute for Occupational Safety and Health time-weighted average of noise exposure was 90.3 dBA, and the OSHA time-weighted average was 86.1 dBA. The highest mean National Institute for Occupational Safety and Health21 and OSHA time-weighted averages by operation
were felling (cutting the trees) and road construction.22
Noise dosage (►Table 3) over 8 hours daily did not surpass
the limit established in the Brazilian legislation (NR-15), probably due to the type of activity that was performed by the workers (►Table 2). Similar noise levels have been
described by different authors.2,3,8–10,23
Of participants, 80.7% used hearing protectors (►Table 4).
The most commonly used hearing protectors, independently of the noise level, were muffs (46.59%). Brazilian legislation has foreseen the obligatory usage of hearing protectors when noise levels were higher than 80 dBA for 8 hours. In this study, the usage of auricular protectors by workers who were exposed to noise less than 85 dBA reached 38.53%. However, 1.83% of the workers exposed from 90 to 94.9 dBA did not use
protection because they drivers of convoy trucks. The Brazil-ian Traffic Code does not comment on the use of ear plugs in professional drivers, only prohibits the use of headphones on the connected equipment sound or cell phone. Results of a longitudinal study (1953 to 1995) on the usage of hearing protectors with forestry, yard, and paper industry workers showed that 95% of forestry workers used hearing equipment during the entire working day, with higher values when compared with yards and industry workers.24
A significant difference was observed among groups re-garding frequency distribution due to audiometry classifi ca-tion, tinnitus complaint, and hearing loss complaint (►Table 5). The 85-dBA group had a higher percentage of
suggestive NIHL audiograms (23.85%). This may be because 31.14% of the workers did not use personal protective equip-ment, because they were exposing themselves to a lower levels of noise, or because of a previous exposure to high noise levels, which could not be evaluated. A significant relation-ship was observed between the audiometry classification, the years at company (p¼0.0003), and the time of total exposure Table 5 Frequencies of the groups according to audiometry classification, tinnitus, and hearing loss complaints—test of different proportions
Variables Noise levels (dBA/ LAeq-8h) Test of different
proportions
<85 (group 1), n(%)
85–89.9 (group 2), n(%)
90–94.9 (group 3), n(%)
Audiometry classification
Normal 34 (31.94) 19 (17.43) 8 (7.34) G16¼G26¼G3
Suggestive of NIHL 26 (23.85) 6 (5.50) 12 (11.01) G16¼G2 and G16¼G3
Other causes –(0.00) 4 (3.67) –(0.00) Test does not apply
Tinnitus complaint
No 56 (51.38) 26 (23.85) 20 (18.35) G16¼G2 and G16¼G3
Yes 4 (3.57) 3 (2.75) 0 (0.00) G16¼G3
Hearing loss complaint
No 56 (51.38) 27 (24.77) 20 (18.35) G16¼G2 and G16¼G3
Yes 4 (3.67) 2 (1.83) –(0.00) G16¼G3
Abbreviations: dBA, decibels with A-weightingfilter; dBA/LAeq-8h, decibels per 8-h exposure daily with conversion factor of 5 dBA; NIHL, noise-induced hearing loss.
Note: Group 1 was exposed to<85 dBA/LAeq-8h; group 2, 85–89.9 dBA/LAeq-8h; group 3, 90–94.9 dBA/LAeq-8h. Table 4 Distributions of frequencies (%) regarding noise level (dBA/LAeq-8h) and protector usage
dBA/LAeq-8h No usage Type of hearing protector Total usage,n(%)
Muffs (CA 7166-NRRsf 18 dB),n(%) Plug (CA14471-NRRsf 10 dB),n(%)
<85 19 32 (35.23) 10 (11.36) 42 (46.59)
85–89.9 0 28 (31.82) – 28 (31.82)
90–94.9 2 15 (15.91) 5 (5.68) 20 (21.59)
Total 21 73 (46.59) 15 (17.5) 88 (100.00)
to noise (p¼0.0084). A worsening in audiometry results with the increase of the years at company and time of noise was also seen.
Tinnitus and hearing loss complaints are more frequent with increased level of exposure to noise (>85 dBA). Tinnitus, independent of the hearing complaint, has been reported often by individuals exposed to noise,25–28and the exposure
length and noise severity have been significantly associated with the symptom.29 Other studies showed that tinnitus
prevalence has increased according to hearing damage evo-lution, which was controlled for age and exposure to noise period. These authors concluded that there was no associa-tion between NIHL and tinnitus, although there was a dosage-answer relationship between hearing loss and tinnitus.27
In this study, a relationship between the audiometry classification and tinnitus complaint (0.3463) was not ob-served; however, a significant relationship with the hearing loss complaint could be observed. This demonstrates that participants with audiograms suggestive of NIHL and other causes would have higher hearing loss complaints when compared with the participants with normal audiograms.
Some data regarding hearing loss classification were brought to our attention. First, 23.85% of the participants who were exposed to noise less than 85 dBA had audiograms suggestive of NIHL. Other studies also demonstrated the
occurrence of NIHL in participants who were exposed to noise less than 85 dBA, with fewer occurrences of hearing losses due to increased exposure to environmental noise level,30 and also noted that 35 workers (48%) exposed to
Fig. 3 Mean, minimum, and maximum values of hearing thresholds in the right ear (A) and left ear (B) of the group that showed noise level raging from 90 to 94.9 decibels with A-weightingfilter (dBA) per 8-hour exposure daily with conversion factor of 5 dBA (LAeq-8h) and the mean hearing values of the American National Standards Institute S3.4 norm for subjects aging 30 years (50th percentile).
Fig. 1 Mean, minimum, and maximum values of hearing thresholds in right ear (A) and left ear (B) of the group that showed noise level <85 decibels with A-weightingfilter (dBA) per 8-hour exposure daily with conversion factor of 5 dBA (LAeq-8h) and mean hearing values of American National Standards Institute S3.4 norm for subjects aging 30 years (50th percentile).
noise levels less than 80 dBA exhibited hearing loss.31Second,
11.01% of participants exposed to noise higher than 90 dBA and with a mean total period of noise of 6.0 years had audiogram results suggestive of NIHL.
Several hypotheses were drawn regarding these two re-sults: (1) due to large turnover of the staff, workers might have had hearing loss when hired for the job and would have performed their roles with low exposure to noise (<80 dBA); (2) other environmental contaminants such as vibration, carbon monoxide, and pesticides (not evaluated by the com-pany) could have contributed to NIHL appearance or worsen-ing, even in workers who were exposed to noise below tolerance limits (►Tables 2and3); (3) workers exposed to
noise<85 dBA might not have been properly using the hearing protector because they underestimated the noise (►Table 4); (4) workers exposed to noise greater than 90
dBA might not have been appropriately receiving hearing protection (►Table 4); (5) hearing protectors might have been
only appropriate for workers exposed to noise ranging from 85 to 89.9 dBA (►Table 4).
No significant differences were found between the mini-mum and mean hearing threshold of the three groups in all evaluated frequencies (p>0.05). However, for maximum hearing thresholds, significant differences among groups were observed (p¼0.0244). This suggests that exposure to noise would increase the risk to develop worse hearing thresholds.
It was also observed that the participants exposed to noises less than 85 dBA, when compared with ANSI S3.44 norm, had worse mean bilateral hearing thresholds for 3-, 4-, and 6-kHz frequencies in the and 2 kHz, in the left ear (►Fig. 1). Results of studies comparing the differences in
hearing thresholds of the participants, applying the OSHA age correction tables for audiograms, determined that at 4,000 Hz, the mean hearing threshold of the participants was significantly higher than the rest of the frequencies.32
An epidemiologic study was conducted including audiom-etry of forestry workers who underwent a medical checkup for vibration disease, and results were analyzed for acute hearing loss. The study found that hearing threshold at 4,000 Hz was significantly higher than the threshold recog-nized as a function of age in every age group. The participants with greater number of operating hours for the three tools developed greater hearing loss than those with fewer hours. Workers who used the three tools for more hours exhibited more advanced audiogram types of NIHL than those who operated the three tools for fewer hours.33Other audiometric
tests in 114 forest loggers determined whether there was significant hearing loss. The participants in this study oper-ated chainsaws and tractors. Results indicoper-ated that the degree of hearing loss (hearing threshold) was in the range of 40 to 50 dB. The study found the hearing threshold at 4,000 Hz to be 42 dB.34
The participants exposed to noises ranging from 85 to 89.9 dBA/LAeq-8h, when compared with ANSI S3.44 norm,18had
worse mean bilateral hearing thresholds, except for 500-Hz bilateral hearing thresholds and 6 kHz in the right ear (►Fig. 2). The participants exposed to noises ranging from
90 to 94.9 dBA/LAeq-8h, when compared with the same norm,
showed worse mean bilateral hearing thresholds except for 6 kHz in the right ear (►Fig. 3). This confirms the impact of
the exposure to noise, even below the tolerance limits, on the hearing of the studied groups.
Others performed a longitudinal study (1972 to 1978) to analyze the effects of noise (96 to 103 dBA) and vibration (linear acceleration 30 to 70 milliseconds) on the hearing of lumber workers. The results demonstrate that when the lumber workers were classified by age, the group exposed to noise and vibration had comparative worsening in NIHL of 10 decibels hearing level (dBHL), at 4-kHz frequency, than the group that had been exposed only to noise.3
Some reports showed that age, combined exposure to noise and vibration, cholesterol concentrations (low-density lipoprotein plasma), and the use of hypertensive medicines would be risk factors to NIHL, and these together explain 28% of NIHL variance between groups.4,6
In this study, the lack of an effective hearing loss preven-tion program could have contributed to the high prevalence of cases suggestive of NIHL in this population, independent of the level of noise. Therefore, the implementation of a hearing loss prevention program for forestry workers is recom-mended, aiming to promote hearing health of this occupa-tional segment that was, most of the time, forgotten by local authorities.
Collective actions aiming to reduce and control the expo-sure to noise produced by forestry machinery and equipment should be a priority at this sector. However, even nowadays, it is possible to observe noisy machinery and equipment with-out the appropriate maintenance. In addition, improper usage of hearing protectors or inappropriate protectors and the lack of breaks during working time could also contribute to the existence of occupational hearing loss. Other protector models with higher NRR are recommended for this population.
Hearing conservation programs may be effective in reduc-ing overall incidence of hearreduc-ing loss. In the absence of noise control at the source, however, highly exposed workers remain at unnecessary risk.9
Conclusion
The present study revealed that due the risk for NIHL, implementation of a hearing loss prevention program tai-lored to forestry workers is needed.
References
1 Bacha CJC, Barros ALM. Reflorestamento no Brasil: evolução
recente e perspectivas para o futuro. Scentia Florestalis 2004; 66:191–203
2 Cunha IA. Níveis de vibração e ruído gerados por motosserras e sua utilização na avaliação da exposição ocupacional do operador à vibração [dissertação]. Campinas, Brazil: Universidade Estadual de Campinas; 2000
3 Pyykkö I, Starck J, Färkkilä M, Hoikkala M, Korhonen O, Nurminen M. Hand-arm vibration in the aetiology of hearing loss in lumber-jacks. Br J Ind Med 1981;38(3):281–289
4 Pyykkö I, Pekkarinen J, Starck J. Sensory-neural hearing loss during combined noise and vibration exposure. An analysis of risk factors. Int Arch Occup Environ Health 1987;59(5):439–454
5 Starck J, Pekkarinen J, Pyykkö I. Impulse noise and hand-arm vibration in relation to sensory neural hearing loss. Scand J Work Environ Health 1988;14(4):265–271
6 Pyykkö I, Koskimies K, Starck J, Pekkarinen J, Färkkilä M, Inaba R. Risk factors in the genesis of sensorineural hearing loss in Finnish forestry workers. Br J Ind Med 1989;46(7):439–446
7 Pekkarinen J, Starck J. [A comparison of hearing losses in the workers of a shipyard and in loggers in relation to individual risk factors]. Gig Tr Prof Zabol 1990;(10):15–18
8 Pekkarinen J. Noise, impulse noise, and other physical factors: combined effects on hearing. Occup Med 1995;10(3):545–559 9 Solecki L. Preliminary evaluation of occupational hearing loss risk
among private farmers. Ann Agric Environ Med 2003;10(2):211–215
10 Davies H, Marion S, Teschke K. The impact of hearing conservation programs on incidence of noise-induced hearing loss in Canadian workers. Am J Ind Med 2008;51(12):923–931
11 Teixeira CF, Augusto LGS, Morata TC. Saúde auditiva de trabalha-dores expostos a ruído e inseticidas. Rev Saude Publica 2003; 37(4):417–423
12 Manjabosco CAW. Perfil audiométrico de trabalhadores agrícolas.
In: Morata TC, Zucki F, eds. Caminhos para a saúde auditiva: ambiental-ocupacional. São Paulo, Brazil: Plexus; 2005:53–66
13 Tak S, Calvert GM. Hearing difficulty attributable to employment by industry and occupation: an analysis of the National Health Interview Survey—United States, 1997 to 2003. J Occup Environ
Med 2008;50(1):46–56
14 Brasil. Norma Regulamentadora n.° 9—Programa de Prevenção de Riscos Ambientais. In: Segurança e Medicina do Trabalho. 56° ed. São Paulo, Brazil: Atlas; 2005
15 Brasil. Norma Regulamentadora n.° 7—Programa de Controle Médico de Saúde Ocupacional. In: Segurança e Medicina do Trabalho. 56° ed. São Paulo, Brazil: Atlas; 2005
16 Brasil. Norma Regulamentadora n.° 15—Atividades e Operações
Insalubres. In: Segurança e Medicina do Trabalho. 56° ed. São Paulo, Brazil: Atlas; 2005
17 American National Standards Institute 1999. Maximum permissi-ble environment noise levels for audiometric test rooms. ANSI S 3.1–1999, New York, NY: 1999
18 American National Standards Institute 1996. Determination of occupational noise exposure and estimation of noise-induced hearing impairment. ANSI S3.44, New York, NY: 1996
19 Couto HA. Temas de saúde ocupacional—coletânea dos cadernos
da Ergo. Belo Horizonte, Brazil: Editora Ergo; 1987
20 Minette LJ. Análise de fatores operacionais e ergonômicos na operação de corteflorestal com motosserra [tese]. Viçosa, Brazil: Universidade Federal de Viçosa; 1996
21 NIOSH—National Institute for Occupational Safety and Health.
Preventing occupational hearing loss—a practical guide. DHHS,
Pub. n.96–110; 1996
22 Neitzel R, Yost M. Task-based assessment on occupational vibration and noise exposures in forestry workers. The Internation Mountain Logging and 11th Pacific Northwest Skyline Synopsium2001:21–27
23 Pyykkö I, Koskimies K, Starck J, Pekkarinen J, Färkkilä M, Inaba R. Risk factors in the genesis of sensorineural hearing loss in Finnish forestry workers. Br J Ind Med 1989;46(7):439–46
24 Toppila E, Pyykkö I, Starck J. The use of hearing protectors among forest, shipyard and paper mill workers in Finland—a longitudinal
study. Noise Health 2005;7(26):3–9
25 Chung DY, Gannon RP, Mason K. Factors affecting the prevalence of tinnitus. Audiology 1984;23(5):441–452
26 Martins AL, Alvarenga KF, Bevilacqua MC, Costa-Filho OA. Perda Auditiva em motoristas e cobradores de ônibus. Rev. bras. otorri-nolaringol 2001;67(4, pt. 1):467–473, jul.-ago. 2001
27 Dias A, Cordeiro R, Corrente JE, Gonçalves CGO. Associação entre perda auditiva induzida pelo ruído e zumbidos. Cad Saude Publica 2006;22(1):63–68
28 Steinmetz LG, Zeigelboim BS, Lacerda AB, Morata TC, Marques JM. Evaluating tinnitus in industrial hearing loss prevention programs. Int Tinnitus J 2008;14(2):152–158
29 Sindhusake D, Golding M, Newall P, Rubin G, Jakobsen K, Mitchell P. Risk factors for tinnitus in a population of older adults: the blue mountains hearing study. Ear Hear 2003;24(6):501–507 30 Rabinowitz PM, Galusha D, Dixon-Ernst C, Slade MD, Cullen MR.
Do ambient noise exposure levels predict hearing loss in a modern industrial cohort? Occup Environ Med 2007;64(1):53–59 31 Kwitko A. Coletânea: PAIR, PAIRO, RUÍDO, EPI, EPC, PCA, CAT,
PERÍCIAS, REPARAÇÃO e outros tópicos sobre Audiologia Ocupa-cional. São Paulo, Brazil: Ed. LTR; 2001
32 Fonseca A. Hearing assessment of forest loggers. [Thesis]. Lousi-ana, EUA: Louisiana State University; 2009. Avaible in: http://etd. lsu.edu/docs/available/etd-08172009-160422/unrestricted/Fon-secaThesis.pdf
33 Iki M. Noise-induced deafness among forestry workers using vibrat-ing tolls (Part 1) Epidemiological study on the relationship between noise exposure and hearing loss. J Sci Labour 1984;60(5):203–213 34 Tunay M, Melemez K. Noise induced hearing loss of forest workers