Comparing audiological evaluation and screening: a study on
presbycusis
Abstract
Alessandra Giannella Samelli1, Camila Aparecida Negretti2, Kerli Saori Ueda3, Renata Rodrigues Moreira4,
Eliane Schochat5
1 PhD in Sciences - Medical School of the University of São Paulo -FMUSP, Professor - Department of Physical Therapy, Speech and Hearing Therapy and Occupaional Therapy -
FMUSP.
2 Speech and Hearing Therapist graduated from FMUSP. 3 Speech and Hearing Therapist graduated from FMUSP. 4 PhD in Sciences - FMUSP, Speech and Hearing Therapist - FMUSP.
5 Associate Professor - FMUSP, Associate Professor - Department of Physical Therapy, Speech and Hearing Therapy and Occupaional Therapy - FMUSP.
Curso de Fonoaudiologia - Departamento de Fisioterapia, Fonoaudiologia e Terapia Ocupacional da Faculdade de Medicina da Universidade de São Paulo (FMUSP) Send correspondence to: Alessandra Giannella Samelli - Centro de Docência e Pesquisa em Fisioterapia, Fonoaudiologia e Terapia Ocupacional - Rua Cipotânea 51 Cidade
Universi-tária São Paulo SP 05360-000.
Apoio inanceiro da FAPESP - Duas bolsas de Iniciação cieníica (Processos nº 2004/02334-4 e 2004/02335-0)
Paper submited to the BJORL-SGP (Publishing Management System – Brazilian Journal of Otorhinolaryngology) on February 09, 2010; and accepted on March 11, 2010. cod. 6926
G
iven the high prevalence of presbycusis and the damage it brings about, a screening test can be useful in the identification of hearing loss in primary care.Aim: To estimate the prevalence of hearing loss in a representative sample of elderly people living at Butantan using an audiological screening method (questionnaire) and a basic audiological evaluation; to compare the results of the two kinds of evaluations, checking the validity of this tool for hearing loss screening.
Design: Cross sectional descriptive study.
Materials and Methods: 200 individuals (above 60 years old, both genders) were randomly selected to undergo audiological screening (questionnaire). Another randomly selected group encompassed 100 individuals who were submitted to a set of audiological tests. Then, we compared the results from the two methods.
Results: There were no statistically significant associations between the questionnaire and the degree of hearing loss of the patients.
Conclusion: The prevalence of hearing loss in our sample was of 56% in the screening and of 95% when checked by the audiological evaluation. Therefore, screening was not proven valid to assess hearing when compared to audiological evaluation.
ORIGINAL ARTICLE Braz J Otorhinolaryngol.
2011;77(1):70-6.
BJORL
Keywords: audiometry, hearing, aged, hearing loss, presbycusis.
INTRODUCTION
Today, Brazil is going through a period of growth of its elderly population. According IBGE projections for 2028, we are expected to have 38 million people with
more than 60 years of age1, in other words, there will be
more than a double-fold increase in the current elderly population.
This populational growth will bring about an even greater demand for public health policies, especially in
terms of diagnosis and treatment2.
One of the implications of this boom in this po-pulation will be a likely increase in presbycusis, which is an aging-related type hearing loss. Its etiology may have consequences which stem from a number of insults inflicted throughout one’s life, including aging-related de-generation, noise exposure, ototoxic agents and otological agents, in general. Presbycusis can be considered whene-ver, in the absence of other etiologies, there is bilateral, symmetrical, insidious hearing loss, especially in the high frequencies, however it can affect all hearing frequencies, in a population older than 40 years. It is highly influenced by genetics, diet and systemic diseases, and it may affect 30 to 60% of the geriatric population, and prevalence will be
greater or lower in relation to socioeconomic variables3-8.
Hearing loss acquired during adulthood can impair quality of life and the person’s integration to society. Be-cause of the hearing loss, many individuals change their life structures, bringing about professional and affection losses, and it may also negatively impact relationships with
friends and families3,9,10. These psychological and social
issues stemming from hearing loss are called handicap or
disadvantage by the World Health Organization11,12.
The psychological impact stemming from the he-aring loss can be assessed by means of self-assessment questionnaires, which are useful tools used to quantify the emotional and social consequences perceived in function of the hearing loss. These instruments may be used in different clinical routines, such as screening and/or initial interviews, assessment of the sound amplification device and assessment of the auditory rehabilitation programs, providing the audiologist the means to understand the impact of this handicap in the elderly and the needs of
this population12-14.
Because of the high prevalence of presbycusis and the handicap it causes, a screening may be useful to identify the hearing loss in primary care. Although its importance is clear, especially in developing countries, the screening methods vary considerably in terms of strategies, techniques, application and effectiveness. Audiometry is the gold standard test to assess hearing loss; nonetheless, it can be difficult in some places because of problems associated with access, reference and reimbursement. For these reasons, many clinicians rely on self-deployed
questionnaires as means to screen for hearing loss, since
they are fast and inexpensive instruments15,16.
Thus, the goals of the present study were:
1) To estimate the hearing loss prevalence in the elderly who live in the Health District of Butantã using the audiological screening and basic audiologic evaluation;
2) To compare the audiological screening results and that of basic audiological evaluation, checking the validity of such instrument to be used as hearing scree-ning tool.
MATERIALS AND METHODS
The study was carried out within the standards re-quired by the Declaration of Helsinki and it was approved by the Ethics in Research Committee of our Institution (#1024). This institution is a reference hospital for those individuals who live in the geographic area covered by the Health District of Butantã, with an estimated population of about 400,000 people.
We carried out a cross-sectional cohort study, using the sample defined for the study: “A epidemiologia da demência e doença de Alzheimer em populações misci-genadas no Brasil e em Cuba”, also carried out by this institution.
For sample selection purposes, we selected the areas covered by the hospital - those belonging to the administrative districts of Butantã, Rio Pequeno and Raposo Tavares, broken down into two groups:
- Censused sectors which have slums, such as São Remo, São Domingos, Sapé, Vila Dalva and others. The Jardim São Remo slum started in an area which belonged to the University of São Paulo about 30 years ago. It has a relatively stable population, with well-defined streets and houses with numbers, it has been counted in recent censuses and they have electrical power and running wa-ter. The remaining is more recent and some are in risky areas. Besides socio-economic deprivations, the residents of these slums have high likelihood of having little or no formal education at all. They are mostly domestic migrants, who lived the beginning of their lives in poor areas of the country;
We randomly selected 200 individuals from both genders, at the age range starting from 60 years, among all the participants in the study: “A epidemiologia da demência e doença de Alzheimer em populações miscigenadas no Brasil e em Cuba”.
Of the 200 initially selected individuals, fifteen could not take part in the study. The causes for not participa-ting were: cognitive deficit which prevented them from understanding the questions (7 cases); refusal to answer the questionnaire (4 cases); impossibility of applying the entire questionnaire because of lack of contact with family member and/or caretakers, which should answer the last question (4 cases). Thus, the series was formed by 185 individuals who underwent the screening.
For the second stage of the present study, we selec-ted again 100 from the 200 previously selecselec-ted individuals, half from each gender. Of these 100, 10 previously selec-ted individuals could not undergo complete audiological evaluation. The causes were: unanswered questionnaire (2 cases); the individual did not feel well during the test (3 cases) and did not understand the orders given during the assessment (4 cases). Thus, in this stage, 91 individuals participated.
Only those individuals who agreed with participated in the study, and they signed the free and informed con-sent form (either the individual or a guardian signed it).
We then applied a questionnaire (audiological
scre-ening) with 15 questions, concerning the different day-to-day communication situations and hearing difficulties, as well as social isolation, which aimed at assessing the impact caused by the hearing loss to the elderly’s life. This ques-tionnaire is used in the hospital’s audiology department,
and it was created based on the Nursing Home Hearing
Handicap - NHHI17, Hearing Handicap Inventory for the Elderly18, and Hearing Handicap Inventory for Adults -
HHIA19 questionnaires. Based on the questionnaire, the
answers were scored as follows: 0 - Never; 1 - Occasionally; 2 - In half of the time; 3 - Always.
The questions were answered by the elderly him-self and only one question was asked to family members (the family member’s impression on the elderly’s hearing difficulties). The answers from each questionnaire were added up and we then we obtained the final score for each individual. Based on this result, the individuals were broken down into three groups. For each group we asso-ciated a handicap perception based on the performance analysis criterion of the individuals assessed by the scre-ening process according to:
- Group 1: 0 to 10 points (no handicap perception); - Group 2: 11 to 20 points (mild/moderate handicap perception);
- Group 3: 21 to 45 points (severe/significant han-dicap perception).
During audiological evaluation, we initially studied
the hearing thresholds obtained for frequencies 250 to 8,000 Hz through air conduction and, when these threshol-ds went beyond 20 dB HL, they were also determined by bone conduction in the frequencies of 500 to 4,000 Hz. The hearing thresholds were classified in degrees,
accor-ding with the Lloyd and Kaplan20criterion, which considers
thresholds up to 25 dBHL, hearing loss from 26 and 40 dBHL, moderate between 41 and 55 dBHL, moderately severe between 56 and 70 dBHL, severe between 71 and 90 dBHL and profound those thresholds higher than 90 dBHL.
Following that, we studied the speech detection threshold and we obtained the speech intelligibility curve. For these procedures we used the Madsen audiometer - model Midimate 622.
We also did tympanometry and ipsi and contra-lateral acoustic reflex studies, using the GSI middle ear analyzer - Tympstar model.
We used the chi-square tests for Independence and Anova, as well as the confidence interval approach. The significance level assigned was of 0.05 (5%).
RESULTS
For the 185 individuals who answered the question-naire (auditory screening), the groups were broken down according to the score obtained:
- Group 1 - 107 individuals (57.8%); - Group 2 - 43 individuals (23.2%); - Group 3 - 35 individuals (19%).
For the 91 individuals who also underwent audiolo-gic assessment, the groups were broken down according to the score obtained in the questionnaire, and they were distributed as follows:
- Group 1 - 40 individuals (43.95%); - Group 2 - 29 individuals (31.85%); - Group 3 - 22 individuals (24%).
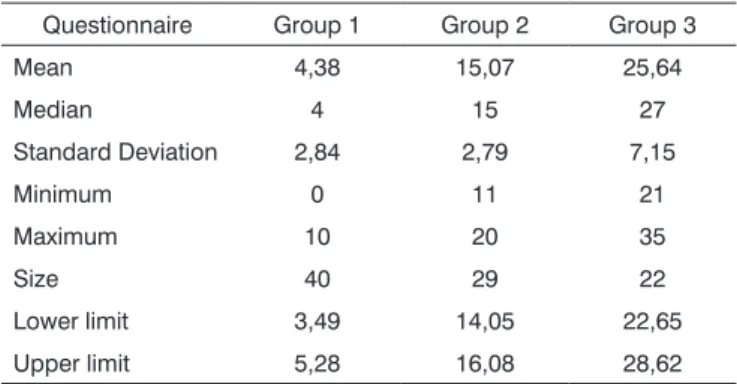
Table 1 shows a better characterization of the score obtained for the 3 groups, in the case of the 91 individuals.
For the audiological evaluation analysis, we consi-dered the degree of hearing loss according to the worst threshold presented and the results were presented and broken down by groups, according to the result from the questionnaire, for the 91 individuals who participated in this stage of the evaluation. The results are described on Table 2.
Through the results obtained from the audiological evaluation we can notice that in the three groups, most of the individuals had moderate hearing loss. The second largest occurrence in group 1 was the mild hearing loss and in groups 2 and 3 it was the severe hearing loss.
We can also notice that only 10 of the 182 ears did not have any degree of hearing loss, in other words, 5.5% of the ears.
hearing loss. The other hearing loss cases were of the sensorineural type (93.4%).
Based on the results presented on Table 3, we no-ticed that there were no statistically significant association between the complaint - collected from the questionnaire, and the hearing loss degree in the right and/or left ears. Nonetheless, we can say that there was a tendency towards
variable association for the right ear (p = 0.085).
Based on Table 4, we can say that for those individu-als who did not complain of the handicap (degree 1) in the questionnaire, the likelihood of that person having hearing loss was of 92.5%. Now, for individuals with significant
perception of the handicap (degree 3), the likelihood of
the person having hearing loss was of 100%.
We carried out a new comparison, associating the mean value of the score obtained from the questionnaires and the hearing thresholds. To do that, the individuals were grouped according to hearing thresholds in the worst ear, in other words, Group A (normal hearing thresholds), Group B (mild hearing loss), Group C (moderate hearing loss) and Group D (moderately severe to profound hea-ring loss). The results are depicted on Table 5 and they indicate statistical significance in regards of the mean value obtained from the questionnaire, since the auditory thresholds are worse.
DISCUSSION
In regards of the perception of the handicap, che-cked in the questionnaire, we noticed that the majority of individuals studied (approximately 56%) reported they perceived it, which is in agreement with those findings
from Pinzan-Faria and Iório12, who used the HHIE, and
found more than 75% of the series perceiving a mild to
severe handicap. Melo et al.10 and Nóbrega et al.21 used the
HHIE abridged version, and reported that only 21.27% and 23% of the elderly assessed felt social and/or emotional disadvantages arising from their hearing loss, respectively. One of the justifications for this difference between the results of this study is associated with the variability in perception of the hearing loss consequences and the life style the elderly has in his/her community, which directly reflects the diversity found in the scores from the
ques-tionnaires10,12, and they may also be influenced by the
different instruments used.
The prevalence of hearing loss, studied by the ba-sic audiological evaluation in this study was very high, in other words, around 95%, which is different from similar
studies, in which the prevalence was around 60 to 70%3,8,10.
Valete-Rosalino and Rozenfeld16 ran a literature review
about presbycusis, and found values varying between 2 and 83% in relation to the prevalence of hearing loss in numerous studies, which used different classification
cri-Table 1. Confidence Interval for the score obtained in the question-naire, considering the 91 individuals, broken down by group.
Questionnaire Group 1 Group 2 Group 3
Mean 4,38 15,07 25,64
Median 4 15 27
Standard Deviation 2,84 2,79 7,15
Minimum 0 11 21
Maximum 10 20 35
Size 40 29 22
Lower limit 3,49 14,05 22,65
Upper limit 5,28 16,08 28,62
Legend: Statistical confidence interval of 95%.
Table 2. Percentage of individuals per degree of hearing loss in the different groups.
Group 1 (n = 40)
Degree of hearing
loss RE involvement (%) LE Involvement (%)
No loss 0 15
Mild 22,5 25
Moderate 52,5 47,5
Mod. Severe 2,5 2,5
Severe 10 7,5
Profound 12,5 2,5
Total 100 100
Group 2 (n = 29)
Degree of loss RE involvement (%) LE Involvement (%)
No loss 3,5 7
Mild 20,6 13,7
Moderate 37,9 37,9
Mod. Severe 7 10,3
Severe 31 27,6
Profound 0 3,5
Total 100 100
Group 3 (n = 22)
Degree of loss RE involvement (%) LE Involvement (%)
No loss 0 4,5
Mild 9,1 18,2
Moderate 50 36,4
Mod. severe 9,1 9,1
Severe 22,7 22,7
Profound 9,1 9,1
teria. Thus, the use of lower intensities as a cutting point, including higher frequencies as well as the use of the worst ear to define hearing loss result in an increase in hearing
loss prevalence, which was the study at hand, because of these more encompassing criteria (lower intensity, high frequencies and classification by the worst ear).
In regards of the audiological profile of the po-pulation studied, we noticed the prevalence of bilateral sensorineural hearing loss, of descending shape. Such
findings have also been reported by Melo et al.10; Mattos
and Veras8; Baraldi et al.3.
As to the degree of hearing loss, we noticed a pre-dominance of moderate hearing loss, and the mild hearing loss type was the second largest occurrence in Group 1; severe hearing loss was the second highest occurrence in Groups 2 and 3. These results differ from those of other similar studies, since most report a higher prevalence of
mild hearing loss3,10,12. This fact has also been associated
with the use of more encompassing hearing loss
classifi-cation critiera16, as previously discussed.
In the analysis which compared the complaint stated in the questionnaire and the degree of hearing loss, there was no statistically significant association for the right and left ears. These data indicate that the individual with a hearing handicap may not show hearing loss necessa-rily, or not have such a severe hearing loss as stated in the questionnaire. The opposite is also possible, in other words, individuals who do not complain of hearing loss in the questionnaire, have hearing loss of different degrees.
These observations were also made by other authors12,14,21,
Table 3. Percentage of individuals distributed according to the groups and auditory thresholds for the right ear (RE) and left ear (LE). RE hearing thresholds Complaint reported in the questionnaire
Group 1 (%) Group 2 (%) Group 3 (%) Total (n) Total (%)
No loss 0% 3,5% 0% 1 1,09%
Mild 22,5% 20,6% 9,1% 17 18,6%
Moderate 52,5% 37,9% 50% 43 47,3%
Mod/Severe 2,5% 7% 9,1% 5 5,5%
Severe 10% 31% 22,7% 18 19,8%
Profound 12,5% 0% 9,1% 7 7,7%
Total 43,95% 31,85% 24 % 91 100%
LE hearing thresholds Complaint reported in the questionnaire
Group 1 (%) Group 2 (%) Group 3 (%) Total (n) Total (%)
No loss 6 15% 7% 4 % 9 10 %
Mild 10 25% 13,8% 18 % 18 19,8 %
Moderate 19 47,5% 37,9% 36,4% 38 41,8 %
Mod/Severe 1 2,5% 10,3% 10 % 6 6,6 %
Severe 3 7,5% 27,6% 22,7% 16 17,5 %
Profound 1 2,5% 3,5% 9 % 4 4,3 %
Total 40 43,95% 31,85% 24 % 91 100%
Legend: Chi-square test - p-value = 0.085# (since it is near the acceptance level, it is considered as tending towards significance) for the right ear and p-value = 0.355 for the left ear.
Table 4. Likelihood of hearing loss associated with the score obtai-ned from the questionnaire.
Normal hearing Hearing loss Hearing loss likelihood
Degree 1 3 37 92,50%
Degree 2 1 29 96,66%
Degree 3 0 21 100%
Total 4 87
--Table 5. Mean and standard deviation of the score obtained from the questionnaire per group, according to auditory thresholds.
Group Mean Standard
deviation n
A 4,8 6,3 4
B 7,1 9,9 11
C 12,2 9,3 45
D 17,4 8,2 31
p = 0,002*
indicating that there is no direct relationship between the degree of hearing loss and the handicap, since elderly patients with different degrees of hearing loss may have
the same handicap.
In order to check whether the questionnaire used was sensitive as an only method for auditory screening, we compared the likelihood of hearing loss with the degrees obtained through the handicap quantification done by the questionnaire. This analysis revealed a very high number of false-negative results, considering those patients who did
not perceive a handicap(degree 1). If we consider only
the elderly who had degrees 2 and 3 of hearing loss as per reported in the questionnaire, the instrument’s sensitivity proved to be higher than 96%. Nonetheless, in this study, as per previously mentioned, there was a very small number of individuals without hearing loss, and this has impaired more specific conclusions on this aspect. Notwithstanding, this instrument alone was not feasible for hearing screening because of a large number of false-positive, which matches
the findings from Pinzan-Faria and Iório12.
And finally, the last analysis made tried to study whether a worsening in auditory thresholds had any re-lation with the mean score obtained in the questionnaire. This relation proved positive, in other words, as the elderly got worse in their auditory sensitiveness, there was an increase in their self-perception of the handicap, proven by a worsening in the questionnaire scores, per group, and
this was also reported by Pinzan-Faria and Iório12, despite
the large individual variability in the questionnaire score, indicating that there is no direct relation between the de-gree of hearing loss and the handicap, as mentioned above. The growth in the number of elderly people in the population will increase even further the demand for pu-blic health policies, especially in regards of presbycusis. Thus, it is urgent to establish the guidelines to develop diagnostic programs, individual sound amplification de-vices and a specific program of auditory reeducation for the elderly with hearing loss, so as to prevent them from suffering the psychological and social losses stemming
from the hearing impairment2,14. Studies concerning hearing
loss prevalence and screening and/or diagnostic metho-ds, as well as methods to quantify the auditory handicap and to follow up the auditory rehabilitation process are fundamental.
The present study reported that the questionnaire utilized is not a method to be used alone in auditory screening; however, it indicates the degree of hearing loss for the elderly, which is highly variable, regardless of the hearing loss level, since it depends on social and psychological adaptation factors, as well as on factors
associated with age and physical health12-14. Thus, the use
of questionnaires is important, since it completes the data brought about by audiological evaluation, providing hints
on the elderly functional capacity and the psychosocial impact of the hearing loss for the elderly, which cannot be totally predicted from the audiogram.
CONCLUSION
1) The hearing loss prevalence found in this
popu-lation was approximately 56% according to the screening
and 95% according to basic audiological evaluation.
2) The screening (questionnaire) did not prove to
be a valid instrument to be used in auditory screening, when compared to basic audiological evaluation.
REFERENCES
1. IBGE. Projeção da População do Brasil por Sexo e Idade - 1980-2050 - Revisão 2008, v. 24. Rio de Janeiro: IBGE,2008.
2. Teixeira AR, Freitas CLR, Millão LF, Gonçalves AK, Becker Jr B, Vieira AF, et al. Relação entre Deficiência Auditiva, Idade, Gênero e Qualidade de Vida de Idosos. Intl Arch Otorhinola-ryngol.2008;12(1): 62-70.
3. Baraldi GS, Almeida LC, Borges ACC. Evolução da perda audi-tiva no decorrer do envelhecimento. Braz J Otorhinolaryngol. 2007;73(1):64-70.
4. Baraldi GS, Almeida LC, Borges ACC. Perda auditiva e hiperten-são: achados em um grupo de idosos. Rev Bras Otorrinolarin-gol.2004; 70(5):640-4.
5. Godinho R, Keogh I, Eavey R. Perda auditiva genética. Rev Bras Otorrinolaringol.2003; 69 (1):100-4.
6. Gratton MA, Vazquez AE. Age-related hearing loss: current rese-arch. Curr Opin Otolaryngol Head Neck Surg. 2003; 11:367-71. 7. Korn GP, Weckx LLM. Distúrbio da audição no idoso. Rev Bras
Med.2006;63(7):353-6.
8. Mattos LC, Veras RP. A prevalência da perda auditiva em uma população de idosos da cidade do Rio de Janeiro: um estudo seccional. Braz J Otorhinolaryngol.2007;73(5):654-9.
9. Amorim RMC, Almeida K. Estudo do benefício e da aclimatização em novos usuários de próteses auditivas. Pró-Fono. 2007; 19(1): 39-48.
10. Melo ADP, Castiquini EAT, Noronha-Souza AEL. Identificação de perda auditiva nos alunos que frequentam a Universidade Aberta à Terceira Idade. Salusvita.2004;23(2):279-90.
11. Freitas CD, Costa MJ. Processo de adaptação de próteses audi-tivas em usuários atendidos em uma instituição pública federal - parte II: resultados dos questionários de auto-avaliação. Braz J Otorhinolaryngol.2007;73(5):660-70.
12. Pinzan-Faria VM, Iório MCM. Sensibilidade auditiva e autoper-cepção do handicap: um estudo em idosos. Dist Comun. 2004; 16(3): 289-99.
13. Marques ACO, Kozlowski L, Marques JM. Reabilitação auditiva no idoso. Rev Bras Otorrinolaringol. 2004;70(6):806-11. 14. Veras RP, Mattos LC. Audiologia do envelhecimento: revisão
da literatura e perspectivas atuais. Braz J Otorhinolaryn-gol.2007;73(1):128-34.
15. Gates GA, Murphy M, Rees TS, Fraher A. Screening for handicap-ping hearing loss in the elderly. J Fam Pract.2003;52(Pt 1):56-62. 16. Valete-Rosalino CM, Rozenfeld S. Triagem auditiva em idosos:
comparação entre auto-relato e audiometria. Braz J Otorhinola-ryngol. 2005;71(2):193-200.
18. Ventry IM, Weinstein BE. Identification of elderly people with hearing problems. ASHA.1983;25(7):37-42.
19. Newman CW, Weinstein BE, Jacobson GP, Hug GA. The hea-ring handicap inventory for adults: psychometric adequacy and audiometric correlates. Ear Hear.1990;11(6):430-3.
20. Lloyd LL; Kaplan H. Audiometric interpretation: a manual of basic audiometry. Baltimore: University Park Press, 1978.