165 DOI: 10.1590/1982-0224-20140045
Phylogenetic signal and major ecological shifts in the ecomorphological
structure of stream fish in two river basins in Brazil
Camilo Andrés Roa-Fuentes
1, Lilian Casatti
1and Renato de Mei Romero
2We tested the contribution of the phylogenetic and specific components to the ecomorphological structure of stream fish from the upper Paraguai River and upper São Francisco River basins, and identified nodes in the phylogenetic tree at which major ecological shifts occurred. Fish were sampled between June and October of 2008 in 12 streams (six in each basin). In total, 22 species from the upper Paraguai River basin and 12 from the upper São Francisco River were analyzed. The ecomorphological patterns exhibited phylogenetic signal, indicating that the ecomorphological similarity among species is associated with the degree of relatedness. A strong habitat template is most likely to be the primary cause for a high
phylogenetic signal. A significant contribution from the specific component was also detected, supporting the idea that the phylogenetic signal occurs in some clades for some traits, but not in others. The major ecological shifts were observed in
the basal nodes, suggesting that ecological niche differences appear to accumulate early in the evolutionary history of major
clades. This finding reinforces the role of key traits in the diversification of Neotropical fishes. Ecological shifts in recent groups could be related to morphological modifications associated with habitat use.
Examinamos a contribuição dos componentes filogenético e específico para a estrutura ecomorfológica de peixes de riacho das bacias do alto rio Paraguai e do alto rio São Francisco, e identificamos os nós na árvore filogenética onde ocorreram as maiores mudanças ecológicas. Os peixes foram amostrados entre junho e outubro de 2008 em 12 riachos (seis em cada bacia). No total, 22 espécies do alto rio Paraguai foram analisadas e 12 do alto rio São Francisco. O padrão ecomorfológico exibiu sinal filogenético, indicando que a similaridade ecomorfológica entre as espécies está associada com o grau de
parentesco. Um forte ‘habitat template’ é provavelmente a maior causa para o forte sinal filogenético. Foi detectada uma
significativa contribuição do componente específico, apoiando a ideia de que o sinal filogenético ocorre em alguns clados para alguns traços, mas não em outros. As maiores mudanças ecológicas foram observadas nos nós basais sugerindo que as diferenças do nicho ecológico em peixes de riacho parecem acumular-se cedo na história evolutiva dos clados e reforça o papel de traços fundamentais na diversificação de peixes Neotropicais. Mudanças ecológicas em grupos recentes podem estar relacionadas com uma modificação morfológica associada ao uso do habitat.
Keywords: Morphological diversity, Niche conservatism, Ecophylogenetics, Paraguay basin, São Francisco basin.
1UNESP, Universidade Estadual Paulista, Laboratório de Ictiologia, Departamento de Zoologia e Botânica, IBILCE, rua Cristóvão Co-lombo, 2265, 15054-000 São José do Rio Preto-SP, Brazil. [email protected] (corrresponding author), [email protected] 2IFAL, Instituto Federal de Alagoas, Campus Marechal Deodoro, rua Lourival Alfredo, 176, 57160-000 Marechal Deodoro-AL, Brazil. [email protected]
Introduction
Phenotypic traits provide useful information about the
relationship between an organism and its environment (Ricklefs & Miles, 1994). Ecomorphology involves the
adaptive nature of a phenotype, in the sense that particular
phenotypes maximize fitness in particular environments
(Ricklefs & Miles, 1994). Because morphology integrates ecological relationships over large temporal and spatial
scales, ecomorphology assumes that such generalized patterns of correspondence between the phenotype and the
environment have evolutionary significance (Ricklefs &
Miles, 1994). An ecomorphological approach can therefore
be useful as a proxy for ecology and for making inferences
about ecological processes (Losos & Miles, 1994).
Due to the hierarchical nature of species relationships,
the interpretation of ecomorphological patterns is not always straightforward. For instance, species may exhibit a similar
ecomorphological pattern as a result of the phylogenetic
morphology and ecology (Ricklefs & Miles, 1994). Many studies assume that patterns revealed in ecomorphological
analysis reflect adaptation to prevailing selective pressures. However, such interpretations are problematic in the
absence of phylogenetic information (Losos & Miles, 1994) and could generate potentially misleading conclusions
(Harvey, 1996). Additionally, species cannot be viewed as
independent points in statistical analyses due to common ancestry (Felsenstein, 1985; Losos & Miles, 1994) and in the absence of phylogenetic information, the evolutionary rate and trend cannot be deduced (Felsenstein, 1985).
Some advantages of including phylogenetic information in ecomorphological studies are: (i) to test the correlated evolution of ecomorphological relationships; (ii) to evaluate
the limits of the expression of morphological variation in
design or function; and (iii) to resolve the statistical dilemma of the non-independence of species (Losos & Miles, 1994). Nonetheless, until recently, most studies did not account for
the influence of phylogeny on the ecological similarities among assemblages (Lauder, 1981; Strauss, 1987; Emerson & Gillespie, 2008), most likely because analytical methods were used that assumed the similarity in a given characteristic was
due to its independent appearance in each species (Dobson,
1985). Considerable advances in analytical techniques have
enabled phylogenetic information to be incorporated into such studies, making it possible to partition the variance
into at least two components: (i) the contribution of the
phylogenetic history of a species, measured by phylogenetic
signal (Losos, 2008); and (ii) the contribution that is unique to each species and reflects adaptation or modification in a structure (Diniz-Filho et al., 1998).
Quantifying phylogenetic signal (i.e., the ‘tendency for related species to resemble each other more than they resemble
species drawn at random from the tree’, sensu Blomberg &
Garland, 2002) indicates the relationship between the degree
of phylogenetic relatedness and the ecological similarity
(Losos, 2008). In the context of ecomorphological analysis, the distinction between phylogenetic constraint and local
adaptation may be a nonissue, because the phenotype of
a species limits the type of environment in which it can
survive regardless of its evolutionary conservatism (Ricklefs
& Miles, 1994). However, phylogenetic signal cannot be
assumed a priori. On the contrary, for some groups, there is
no general relationship between the phylogenetic similarity
and niche similarity (Knouft et al., 2006; Losos, 2008). Thus,
one should explicitly test whether the ecological similarity among species is associated with phylogenetic relatedness
(Losos, 2008).
Measuring phylogenetic signal may reveal the
relationship between ecology and ancestry, but not which
evolutionary events for more inclusive lineages contributed to the disparity in ecological traits among less inclusive
lineages or how these differences might affect present-day
community structure (Vitt et al., 2003). In the present study,
we assess the ecomorphological structure of stream fishes
in the upper Paraguai and upper São Francisco River basins
to: (i) determine the extent of phylogenetic signal in certain
ecological traits and (ii) identify nodes in the phylogenetic
tree at which major ecological shifts occurred.
Material and Methods
Study area. The headwaters of the Paraguai River are located
in the Chapada dos Parecis Mountains; from there, the River
crosses the central-western region of Brazil and flows into the Paraná River at the border with Argentina (Latrubesse
et al., 2005). The headwaters of the São Francisco River are located in the northeastern part of the Serra da Canastra
Mountains in southwest Minas Gerais, from where it runs northeast. The ichthyofauna of the Paraguai River basin is well known. The basin has approximately 333 species, approximately 116 (35%) of which are endemic (Carvalho & Albert, 2011). The São Francisco River basin has 208 native species, approximately 60 (29%) of which are endemic
(Alves et al., 2011). Historically, the Paraguai River basin
is more related to the southern tributary headwaters of the Amazon River basin (i.e., the Mamoré-Guaporé, Tapajós,
Xingu, and Tocantins Rivers; Montoya-Burgos, 2003;
Carvalho & Albert, 2011) than to the São Francisco River or
coastal basins. The São Francisco River basin, on the other
hand, drains solely into the Atlantic Ocean.
This study was conducted in 12 streams: six in the upper Paraguai River and six in the upper São Francisco River (Fig. 1). All selected streams were similar in size (first and second order streams, classified using the Strahler method
on a 1:50,000 scale), located in the same geomorphological
region of each basin. The streams had similar preservation
statuses, including no strong human impacts.
Sampling and habitat characterization. An 80 m-long
reach was sampled in each stream to represent the greatest
habitat variability possible. Each reach was sampled on three
occasions during the dry season between June and October
in 2008, composing a total of 18 samplings in the Paraguai
and 18 in the São Francisco River basins. Specimens were sampled after blocking the reaches upstream and downstream using block nets (5 mm mesh). For one hour, two collectors sampled fish with a seine (1.5 × 2 m, 2 mm mesh) and dip net (0.5 × 0.8 m, 2 mm mesh). After considering the great variety of microhabitats present, these two types of nets were chosen to maximize the sampling effort. Sampling was conducted towards the upstream end of each selected reach. Fish were fixed in 10% formalin, and then transferred to 70% ethanol three days later. All sampled species were identified using specialized literature (e. g., Vari & Harold, 2001; Britski et al., 2007); specialists were consulted to confirm
Ecomorphological structure. Species with a minimum abundance of five adult specimens in the stream samples were selected to measure the morphometrics to determine the ecomorphological structure of the assemblage. To avoid
an allometric effect on the analysis, only adult specimens of
similar size were chosen (Winemiller, 1991).
For each specimen, 18 morphometric measures
were obtained and subsequently used to calculate 14
ecomorphological attributes, related to functional
specializations of the fish to water flow, swimming ability, position in the water column, and prey size (Hora, 1930; Gosline, 1971; Webb, 1977; Gatz, 1979; Watson & Balon, Fig. 1. Study area with the sampling sites at the upper Paraguai and upper São Francisco River basins. BOD: Serra da Bodoquena National Park; CAN: Serra da Canastra National Park; MG: Minas Gerais State; MS: Mato Grosso do Sul
1984; Casatti & Castro, 2006). These 14 ecomorphological attributes were: compression index (CI), relative depth (RD),
relative caudal peduncle length (RCPL), caudal peduncle
compression index (CPCI), index of ventral flattening (IVF), relative area of the dorsal fin (RADF), relative area of the pectoral fin (RAPF), pectoral fin aspect ratio (PFAR), relative area of the caudal fin (RACF), relative head length (RHL), relative eye position (REP), relative mouth width (RMW), mouth orientation (MO) and fineness coefficient (FC). The attributes calculation and their respective ecological explanations are listed in Appendix 1.
To order species in the ecomorph space, a Principal
Components Analysis (PCA), based on the correlation
matrix of the morphological variables, was performed separately for each basin. This analysis used standardized ecomorphological attributes so that all would have a mean of 0 and a standard deviation equal to 1. The PCA allowed comparisons of the species distribution in the ecomorphological space between the two basins, as well as the identification of patterns in the covariation between morphological attributes and their ecological roles
(Winemiller et al., 1995). The choice of which principal
components to interpret was based on a broken-stick model, which constructs a null distribution of eigenvalues and compares it with observed ones (Legendre & Legendre, 1998). A principal component is interpretable if it exceeds
the eigenvalue randomly generated by the broken-stick model (Legendre & Legendre, 1998). For the selection of
significant components, the broken-stick model is one of the methods with the most consistent results in ecological studies (Jackson, 1993) and is widely used in studies of
ecomorphological structure (see: Casatti & Castro, 2006; Oliveira et al., 2010). Multivariate analyses were conducted using Primer v6 (Clarke & Gorley, 2006) and Statistica 7
(StatSoft Inc., 2004) software.
The phylogenetic hypothesis and the distance between species. We constructed a composite phylogenetic hypothesis
for the 33 stream fish species based on six different studies
(de Pinna, 1998; Montoya-Burgos, 2003; Armbruster, 2004; Mirande, 2010; Near et al., 2012; Sullivan et al., 2013).
The phylogeny was built by hand using Mesquite v.2.75
(Maddison & Maddison, 2011). Because there is no general
consensus on the timing of diversification among the major
actinopterygian and teleostean lineages (Near et al., 2012),
the phylogenetic distance between species was calculated using the ‘bladj’ utility in Phylocom software (Webb et al.,
2011). This utility takes a phylogeny, fixes the root node at a specified age given by the user and also fixes the root and
other nodes that user might have age estimates for (Webb et al., 2011). Thereafter, it sets all other branch lengths
by placing the nodes at even intervals between the dated nodes, which produces a pseudo-chronogram that can be
useful for estimating phylogenetic distance (in millions
of years) between taxa (Webb et al., 2011). Even if only a
few nodes are dated, the resulting phylogenetic distances
can be a marked improvement on simply using the number of intervening nodes as a phylogenetic distance (Webb et al., 2011). We fixed the ages of taxa for the following
taxonomic levels: Otophysi, Siluriformes, Characiformes
(see Near et al., 2012), Heptapteridae, Rhamdia sp., Pimelodella sp., Cetopsorhamdia sp. (see Sullivan et al., 2013), and Hypostomus spp. (see Montoya-Burgos, 2003,
Fig. 4). A patristic distance matrix was then extracted
from the composite phylogeny to use in further analysis.
The patristic distance was calculated using the ‘adephylo’ package (Jombart et al., 2010) in R statistical software (R
Core Team, 2012).
Phylogenetic signal and identification of major ecological shifts. The Phylogenetic Eigenvector Regression (PVR) method (Diniz-Filho et al., 1998) was used to test the effect
of phylogeny on the ecomorphological structure of the fish in the two basins. With this approach, the ecomorphological variation explained by the significant PCs is divided into two components: phylogenetic (P), which is the variation inherited from ancestors, and specific (S), which
represents the independent variations of each lineage and the independent evolution of each species after speciation
events; the correlation between P and S can be interpreted
as phylogenetic niche conservatism (Desdevises et al., 2003;
Diniz-Filho et al., 2009).
The PVR method first uses a Principal Coordinate
Analysis (PCoA, see Legendre & Legendre, 1998) to calculate eigenvectors from the species phylogenetic distance
matrix (Diniz-Filho et al., 1998). These eigenvectors can
be used as predictors in a multiple regression, in which the dependent variable is the species traits (Diniz-Filho et al., 1998). The first eigenvectors tend to describe variation
among deeper nodes of the phylogeny (Diniz-Filho et al., 2009). Hence, the response variable is tested as a function of the phylogenetic structure, according to the model: Y =
Xβ +
ε
, where X is the matrix containing the eigenvectors and β is the regression coefficient of each eigenvector on Y,with Y values estimated by the model so that Xβ corresponds to the phylogenetic component (P) and ε corresponds to
the specific component (S) (Diniz-Filho et al., 2009). The
adjusted coefficient of determination (R2) in these linear
models measures the amount of ecomorphological variation
explained by phylogeny (i.e., phylogenetic signal; Diniz-Filho et al., 1998, 2009).
The P component was then estimated using a multiple
regression analysis of the response variable against the
eigenvectors of the phylogenetic distance matrix
(Diniz-Filho et al., 2009). There are several criteria for establishing the number of eigenvectors that should be selected. Here,
we followed Diniz-Filho et al. (2009), in which the
al., 2007). Regression residuals were used to estimate the S component (Diniz-Filho et al., 2009). The PCoA was
performed using PCO software (Anderson, 2003). SAM v4.0 software (Rangel et al., 2010) was used to select the PCoA eigenvectors and the principal components of the
PCA to execute the multiple regression.
Finally, to identify nodes in the phylogenetic tree
at which major ecological shifts occurred, a Canonical
Phylogenetic Ordination (CPO) (Giannini, 2003)
was conducted. CPO is a modification of Canonical
Correspondence Analysis (CCA) and is a multivariate ordination procedure that directly associates variation in
one matrix (ecomorphological attributes) with variation in another (fish phylogeny) (Vitt & Pianka, 2005). The matrix (Y) contained standardized ecomorphological attributes measured across all fish species in the two basins; the independent variable consisted of a phylogeny matrix (X) that contained all clades of the fish phylogeny, each coded separately as a binary variable (see Giannini, 2003). Each variable was tested individually to obtain F and P values.
After each significant variable was included in the model, the subsequent variable that most reduced the variance was tested and included if statistically significant (P ≤ 0.002,
according to the Bonferroni correction). This procedure was followed until subsequent variables were no longer significant. The CPO was performed in CANOCO 4.5 (ter Braak & Smilauer, 2002), using the following parameters: symmetric scaling, biplot scaling, downweighting of rare
species, manual selection of environmental variables (monophyletic groups), 9,999 permutations, and unrestricted permutations.
Results
Fish fauna. Overall, 3,691 specimens were collected. Of these, 2,735 were captured in the upper Paraguai River basin and 956 were captured in the upper São Francisco River
basin. Fish species used in the ecomorphological analysis
are listed in Appendix 2.
Ecomorphological structure. In the upper Paraguai River basin, PC1 and PC2 had larger eigenvalues than predicted
by the broken-stick model; together, they explain 76.3% of ecomorphological variation in the fish assemblage. PC1 was influenced mainly by the compression index, relative
eye position, mouth orientation, relative area of the pectoral
fin, caudal peduncle compression index, relative area of the dorsal fin, relative caudal peduncle length, relative area of the caudal fin and relative depth (Table 1). Species with highly positive PC1 scores exhibited depressed and low bodies, dorsal eyes, ventral mouths, large pectoral fins, rounded and long caudal peduncles, large dorsal fins and large caudal fins (e.g., Ancistrus sp., Farlowella paraguayensis, Hypostomus boulengeri, H. cochliodon, Hypostomus sp., Rineloricaria lanceolata). Species with highly negative PC1 scores, on the other hand, presented compressed, high
bodies, terminal mouths, short pectoral fins, compressed caudal peduncles, small dorsal fins, short caudal peduncles and small caudal fins (e.g., Astyanax asuncionensis, A. lineatus, Astyanax sp., Hyphessobrycon luetkenii, Jupiaba acanthogaster, Moenkhausia sanctaefilomenae, M. bonita, Odontostilbe pequira, Piabarchus torrenticola, Serrapinnus calliurus, Fig. 2).
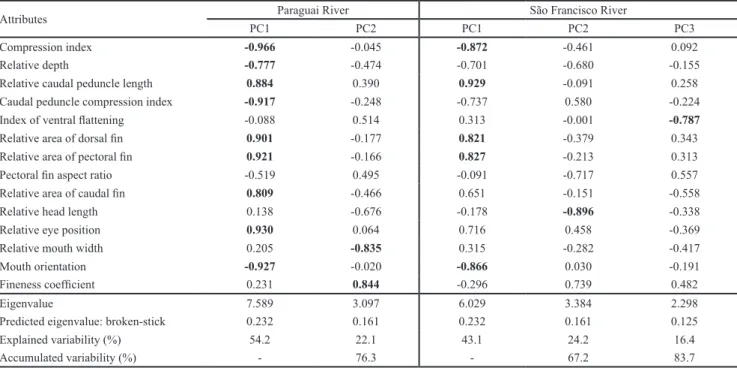
Table 1. Contribution of the 14 ecomorphological attributes for the significant principal component axes, calculated for fish species from the upper Paraguai and upper São Francisco River basins, Brazil. The most important eigenvectors for axes
interpretation are in bold.
Attributes Paraguai River São Francisco River
PC1 PC2 PC1 PC2 PC3
Compression index -0.966 -0.045 -0.872 -0.461 0.092
Relative depth -0.777 -0.474 -0.701 -0.680 -0.155
Relative caudal peduncle length 0.884 0.390 0.929 -0.091 0.258
Caudal peduncle compression index -0.917 -0.248 -0.737 0.580 -0.224
Index of ventral flattening -0.088 0.514 0.313 -0.001 -0.787
Relative area of dorsal fin 0.901 -0.177 0.821 -0.379 0.343
Relative area of pectoral fin 0.921 -0.166 0.827 -0.213 0.313
Pectoral fin aspect ratio -0.519 0.495 -0.091 -0.717 0.557
Relative area of caudal fin 0.809 -0.466 0.651 -0.151 -0.558
Relative head length 0.138 -0.676 -0.178 -0.896 -0.338
Relative eye position 0.930 0.064 0.716 0.458 -0.369
Relative mouth width 0.205 -0.835 0.315 -0.282 -0.417
Mouth orientation -0.927 -0.020 -0.866 0.030 -0.191
Fineness coefficient 0.231 0.844 -0.296 0.739 0.482
Eigenvalue 7.589 3.097 6.029 3.384 2.298
Predicted eigenvalue: broken-stick 0.232 0.161 0.232 0.161 0.125
Explained variability (%) 54.2 22.1 43.1 24.2 16.4
PC2 was mainly influenced by the relative mouth width and the fineness coefficient. Species with a relatively narrow mouth that were unable to perform active swimming (e.g., F. paraguayensis, R. lanceolata) presented highly positive
scores for PC2, whereas species with a relatively wide mouth and a body inefficient for active swimming (e.g., Ancistrus sp., Hypostomus sp.) had negative scores (Fig. 2).
Fig. 2. Projection of the first two PCA axes based on 14 ecomorphological attributes for the following fish species from the upper Paraguai River, Brazil: Ancsp, Ancistrus sp.; Astasu, Astyanax asuncionensis; Astlin, A. lineatus; Astsp, Astyanax sp.; Chafas, Characidium fasciatum; Chazeb, C. zebra; Cremer, Creagrutus meridionalis; Farpar, Farlowella paraguayensis; Hyplue, Hyphessobrycon luetkenii; Hypbou, Hypostomus boulengeri; Hypcoc, Hypostomus cochliodon; Hypsp, Hypostomus sp.; Jupaca, Jupiaba acanthogaster; Moebon, Moenkhausia bonita; Moesan, M.
sanctaefilomenae; Odopeq, Odontostilbe pequira; Parnas, Parodon nasus; Piator, Piabarchus torrenticola; Pimgra, Pimelodella gracilis; Rhaque, Rhamdia quelen; Rinlan, Rineloricaria lanceolata; and Sercal, Serrapinnus calliurus.
The figures in black indicate the most representative
ecomorphotypes.
In the upper São Francisco River basin, PC1, PC2, and PC3 had a larger eigenvalue than predicted by the
broken-stick model and together explained 83.7% of the ecomorphological variation in the fish assemblage. PC1 was mainly influenced by the relative caudal peduncle length, compression index, mouth orientation, relative area of the pectoral fin and relative area of the dorsal fin (Table 1). Species with highly positive scores for PC1 had long
caudal peduncles, depressed bodies, ventral mouths and
large pectoral and dorsal fins (e.g., Harttia cf. novalimensis, Microlepidogaster sp., Neoplecostomus franciscoensis) (Fig.
3). Species with highly negative scores for PC1 presented
short caudal peduncles, compressed bodies, terminal
mouths, small pectoral and dorsal fins (e.g., Astyanax rivularis, Creagrutus aff. varii, Piabina argentea; Fig. 3).
PC2 was mainly influenced by the relative head length. Species with positive scores for PC2 presented small heads
(e.g., Trichomycterus brasiliensis, T. reinhardti), whereas
species with highly negative scores presented large heads
(A. rivularis; Fig. 3). Finally, PC3 was mainly influenced by
the index of ventral flattening. Species with positive scores for PC3 were less ventrally flattened (e.g., Apareiodon ibitiensis) and species with highly negative scores were
more ventrally flattened (e.g., N. franciscoensis, Fig. 3).
Fig. 3. Projection of the first three PCA axes based on 14 ecomorphological attributes for the following fish species from the upper São Francisco River, Brazil:
Apaibi, Apareiodon ibitiensis; Astriv, Astyanax rivularis; Cetihe, Cetopsorhamdia iheringi; Chafas, Characidium fasciatum; Crevar, Creagrutus aff. varii; Harnov, Harttia cf. novalimensis; Micsp, Microlepidogaster sp.; Neofra, Neoplecostomus franciscoensis; Piaarg, Piabina argentea;
Tribra, Trichomycterus brasiliensis; Trirei, Trichomycterus reinhardti and Trivar, Trichomycterus variegatus.
The figures in black indicate the most representative
ecomorphotypes.
Phylogenetic signal and identification of major ecological shifts. In general, the ecomorphological patterns for the
PC1 and 72% (P < 0.001) in PC2, while 13% (P < 0.001)
and 28% (P < 0.001) of the accumulated variation in PC1
and PC2, respectively, were the product of independent variation in each lineage (Table 2).
For the upper São Francisco River basin, the regression
model was performed with four of the 11 phylogenetic eigenvectors (E); of these, E1 was significantly correlated with PC1, E2, with PC2, and E4 and E6 with PC3 (Table 2). Phylogeny explained 58% (P < 0.001) of the ecomorphological
variation accumulated in PC1, 52% (P < 0.001) in PC2 and
69% (P < 0.001) in PC3; 42% (P < 0.001), 48% (P < 0.001)
and 32% (P < 0.001) of the accumulated variation in PC1,
PC2, and PC3, respectively, were a product of independent variation within each lineage (Table 2).
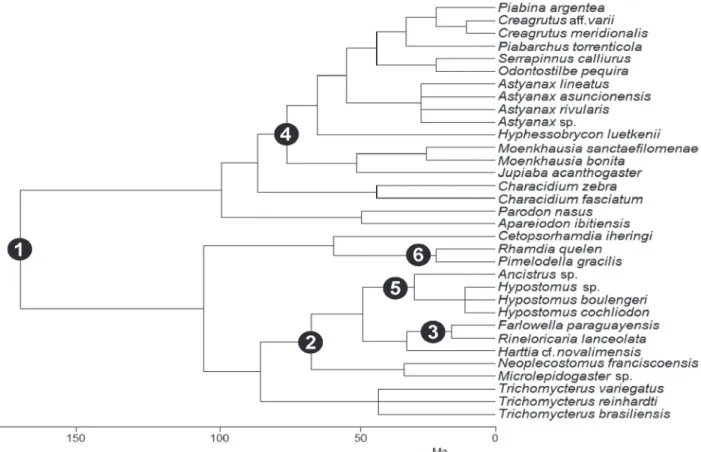
There were significant ecomorphological shifts at six major divergence points (Table 3, Fig. 4) reducing variation by 89% (only 11% of the variance was lost; Table 3). The six major divergence points were Siluriformes/
Characiformes, Loricariidae, Farlowella/Rineloricaria, Characidae, Hypostominae, and Pimelodella/Rhamdia. The
first and greatest variation in ecomorphological structure occurred in the Siluriformes/Characiformes clades (46%) with a consecutive reduction (respective of list order) until
reaching the Pimelodella/Rhamdia clades (4%) (Table 3).
Table 2. Multiple regression of the significant principal
components (PC) from the PCA based on 14 ecomorphological
attributes of fishes from the upper Paraguai and upper São Francisco River basins, Brazil, against the phylogenetic (E = significant phylogenetic eigenvectors) and specific
components of each PC, including the determination
coefficient (R2) and the P-value. The significant values (P ≤
0.05) are in bold.
PC Component R2 P
Upper Paraguai River
PC1
Phylogenetic (E1) 0.866 < 0.001
Specific 0.134 < 0.001
Unexplained < 0.001
PC2
Phylogenetic (E7) 0.722 < 0.001
Specific 0.278 < 0.001
Unexplained < 0.001 Upper São Francisco River
PC1
Phylogenetic (E1) 0.578 < 0.001
Specific 0.422 < 0.001
Unexplained < 0.001
PC2
Phylogenetic (E2) 0.518 <0.001
Specific 0.482 <0.001
Unexplained < 0.001
PC3
Phylogenetic (E4; E6) 0.685 < 0.001
Specific 0.315 < 0.001
Unexplained < 0.001
Table 3. Results of Monte Carlo permutations test on
individual groups (defined as in Fig. 4) for the Y matrix
of ecomorphological attributes. Percentage of the variation
explained (with respect to total unconstrained variation) and
F- and P-values for each group are given (9,999 permutations
were used). Only significant groups are presented P ≤ 0.002 (according to the Bonferroni correction).
Clade Variation Variation (%) Accumulated variation (%) F P Siluriformes/
Characiformes 0.041 45.56 - 21.23 0.0001 Loricariidae 0.013 14.44 60.00 8.51 0.0001
Farlowella/
Rineloricaria 0.011 12.22 72.22 9.53 0.0002
Characidae 0.006 6.67 78.89 5.51 0.0001 Hypostominae 0.005 5.56 78.89 5.25 0.0004
Pimelodella/
Rhamdia 0.004 4.44 88.89 4.52 0.0003
Total variation 0.090
Discussion
We found that the ecomorphological structure of stream
fish of Paraguai and São Francisco River basins showed a high phylogenetic signal. This signal indicates that the ecomorphological similarity among stream fish species is associated with the degree of relatedness (Losos, 2008); closely related species are expected to have greater niche similarity (Darwin, 1859; Webb et al., 2002). Although our
goal was not to note which ecomorphological attributes had
a higher phylogenetic signal than others, some structures
related to food acquisition and habitat use seem to be
phylogenetically conserved at the level of basal taxa (e.g.,
Loricarioidea, Characiformes). For example, the gain or
loss of certain plesiomorphic structures (e.g., muscle “C”, cartilaginous plugs, retractor palatini allowed two main
functional specializations in current species of Loricariidae:
algae scraping and the ability to attach to the substrate by using the oral sucker (Schaefer & Lauder, 1986). Similarly,
characteristics related to swimming and feeding habits in
Neotropical Characiformes (e.g., dorsal fin ratio, habitat preference, length of the digestive tract, tooth type) and
differences in body form also exhibited a significant
phylogenetic signal (Guisande et al., 2012).
In stream ecosystems, the heterogeneity of the physical
environmental widely influences the community structure (Poff & Ward, 1990). Particularly, patterns in stream fish
functional structure result from habitat associations based
on hydrological variability, where functional groups are specialized for specific habitats (a strong habitat template;
phylogenetic signal in the ecomorphological structure of the Paraguai and São Francisco River assemblages. Lineages included in this study are typically restricted to small
and upland streams, environments with characteristics such as strong current, well-oxygenated water, pH close to neutral, relatively coarse substrates, and low-diversity fish communities with specializations for rapid flow such as dorsoventral flattening (Crampton, 2011), structures to
attach to the bottom, and a good capacity for continuous
swimming.
Phylogenetic signal is often interpreted as providing information about the ecological and evolutionary process, evolutionary rate (Losos, 2008; but see Revell et al., 2008) or pattern (Wiens et al., 2010) that regulates community assembly. A strong phylogenetic signal is necessary, but not
sufficient, evidence for the existence of niche or evolutionary
conservatism (Losos, 2008; but see Revell et al., 2008).
Therefore, it is likely that a portion of the ecomorphological structure observed in our data would be an example of
‘phylogenetic niche conservatism’, given by the trend of species to retain ancestral ecological characteristics or aspects of their fundamental niche over time (Wiens et al.,
2010). For some Neotropical fish clades there is evidence for a pattern of niche conservatism. For example, the Piaractus, Colossoma and Mylossoma (Serrasalmidae) genera are
all highly specialized frugivores that occur in floodplain forests and make upriver migrations (Crampton, 2011). The existence of Miocene fossils of Colossoma demonstrates
that this clade has been associated with floodplains for a
long period of time, because there are no derived transitions to other habitats in this clade (Lundberg et al., 1988; Crampton, 2011), remained morphologically conservative for at least 15 million years (Lundberg et al., 1988).
In addition to the high phylogenetic signal of the
overall ecomorphological structure in the two basins, a significant contribution from the specific component was also detected. The specific, or ecological, component represents the ancestry-independent variation, which can
be attributed to the adaptation of each species to current
environmental conditions (Diniz-Filho et al., 2007).
Species or assemblages with high values for specific
components have different ancestral morphologies/
ecologies (Diniz-Filho et al., 2007). This finding supports the idea that phylogenetic signal occurs in some clades for
some traits, but not in others (Losos, 2008). This pattern
has been found in different studies (Freckleton et al.,
2002 and references therein) and it is in accordance with
the rationale that niches of species are not static, but can
expand, contract or shift, indicative of rapid niche changes
(Pearman et al., 2008).
Inferring which characteristics deviate from their
ancestral states on the basis of ecomorphological attributes
can be a difficult and complex task. Nevertheless, evidence of this deviation emerges from examples of the use of different microhabitats by species with a body shape
evidently determined by phylogeny. For instance, sympatric species of the genus Characidium (Crenuchidae) have been
associated with different water velocity classes, different depths, and some exhibit distinct habitat occupation with regard to substrate type (Leal et al., 2011). Similarly, species of Astyanax are associated with a largest number of microhabitat types (i.e., lateral surface, lateral column, hard substrate, channel center, marginal vegetation and
others), being generalists with regard to habitat use
(Romero & Casatti, 2012). The use of food resources by
sympatric species of the same genus may also provide
evidence of deviation from an ancestral niche. For example, sympatric fish species of Moenkhausia (M. dichroura and M. sanctaefilomenae; Characidae) display trophic segregation in terms of the proportion of items consumed
(Tófoli et al., 2010), as do sympatric species of Roeboides (R. descalvadensis (=paranensis), R. affinis (=prognathus), and R. microlepis; Characidae) (Novakowski et al., 2004).
We found that major shifts in ecomorphological
patterns occurred in the basal nodes. This is in accordance with previous studies, which suggest that in some groups,
the ecological niches evolve little around the time of a
speciation event (Vitt & Pianka, 2005). Stream fish niches
therefore appear to differentiate at the level of familial relationships or early in the evolutionary history of major
lineages; present-day assemblages may coexist largely because of ancient preexisting differences (Vitt & Pianka,
2005). Our data also support this notion because they demonstrate that (i) ecomorphological structure is related
with phylogenetic similarity (the high phylogenetic signal we measured), and (ii) consistency in the ecomorphological similarities are independent of the assemblages in which they occur (the similar pattern we observed in the Paraguai
River and São Francisco River stream assemblages) (Vitt & Pianka, 2005).
There has been little discussion regarding the role of key traits in the diversification of Neotropical fishes, but certain
changes (e.g., morphological changes in Loricariidae to
algae scraping) underlie the exceptional diversity of the most species-rich taxa (Schaefer & Lauder, 1996; Albert et al., 2011). In this study, the most important ecomorphological divergence (in Siluriformes/Characiformes) established a primary division in both habitat and the use of food resources
within the stream habitats. Siluriformes and Characiformes have a striking ecological and morphological differentiation in relation to each other. Siluriforms predominantly occupy
the bottom and are active at night, while characiforms utilize the water column and are active during daytime. This recurring pattern is observed distinctly in Neotropical watersheds. However, this observation does not imply
that particular trophic or habitat specialization evolved in
one clade only. For example, parodontids (Characiformes)
are similarly algivorous/periphytivorous to loricariids (Siluriformes) (Casatti & Castro, 2006).
Another important ecological shift occurred in the
Loricariidae family, which indicates a change mainly in
food resource use. For instance, the evolutionary success of loricariids at the continental scale may be largely due to the central role of algivory (Schaefer & Lauder, 1996; Albert et al., 2011). Algivory involves a highly derived set of
anatomical and physiological specializations, such as in the oral and pharyngeal jaws, digestive and respiratory organs,
and life-history and behavioral traits (Albert et al., 2011). Additionally, adaptations to streams (e.g., a ventral mouth
for attaching to the bottom, a dorsoventrally flattened body, and large pectoral fins) also may explain the expressive ecomorphological variation accumulated in this family. The
particular ecological variation in Farlowella/Rineloricaria (Loricariidae) could be related to a morphological
modification associated with habitat use, but the process
leading to this change remains to be tested. Specifically, F. paraguayensis and R. lanceolata are algivorous like other members of loricariids, but occur only in marginal areas
associated with roots, leaves and grasses that are in contact with water (Romero & Casatti, 2012). Thus, when compared with other members of the same family, the morphological
divergence in this lineage most likely leads to the use of
new spaces in the stream habitat.
Our results indicate that the ecomorphological structure
of stream fish assemblages from the upper Paraguai and upper São Francisco River basins exhibits high phylogenetic signal, but with also a significant contribution from the specific component. The ecomorphological structure observed in our data would be an example of niche conservatism, with the strong habitat template
being the probable major cause of phylogenetic signal. The contribution of the specific component could be related to
the occupation of different microhabitats and/or the use of
distinct food resources by closely related species. The shifts
in the ecomorphological pattern occurred mainly in the basal nodes (Characiformes and Siluriformes), indicating that differences in ecological niches appear to accumulate
early in the evolutionary history of major clades with little ecological shift afterward. When such shifts occur, they most likely lead to a use of new spaces within the stream
habitat. In a broad sense, this phylogenetic perspective
on the community ecology of Neotropical stream fish reinforces the idea that the relationship between phylogeny
and community structure is likely to involve both niche
stasis and differentiation along the ecological niche axes.
Acknowledgments
helpful comments and suggestions; Francisco Langeani for
fish identification; Thiago Gonçalves-Souza for help with the
PVR analysis; Gabriel L. Brejão for prepare the Fig. 1, and
Mônica C. Bastos for initial language revision. This study is part of two projects: “Fish as indicators of stream water quality in urban and tourist areas in Bodoquena Plateau, Mato Grosso do Sul” (CNPq/CT-Hidro 555096/2006-8) and “Fish fauna
of streams in areas of Cerrado: composition, structure and
conservation” (FAPESP 2007/05400-6). This paper is part of
a CARF master’s thesis from the Biologia Animal graduate
program (UNESP/IBILCE), supported by a fellowship from the PEC-PG program (CAPES/CNPq – IEL Nacional - Brasil). LC received a grant from CNPq (301755/2013-2). RMR received a grant from FAPESP (2007/05400-6) and currently receives a grant from PAPPE/IFAL.
References
Albert, J. S., H. L. Bart & R. E. Reis. 2011. Species richness and cladal diversity. Pp. 89-104. In: Albert, J. S. & R. E. Reis (Eds.). Historical Biogeography of Neotropical Freshwater Fishes. Los Angeles, California, University of California Press. Alves, C. B. M., F. Vieira & P. S. Pompeu. 2011. Ictiofauna da bacia
hidrográfica do rio São Francisco. Pp. 226-241. In: Ministério do Meio Ambiente (Org.). Diagnóstico do macrozoneamento ecológico-econômico da bacia hidrográfica do rio São Francisco. Brasil. Brasília: Ministério do Meio Ambiente. Anderson, M. J. 2003. PCO: a FORTRAN computer program
for principal coordinate analysis. Department of Statistics, University of Auckland, New Zealand.
Armbruster, J. W. 2004. Phylogenetic relationships of the suckermouth armoured catfishes (Loricariidae) with emphasis on the Hypostominae and the Ancistrinae. Zoological Journal of the Linnean Society, 141: 1-80.
Blake, R. W. 1983. Functional design and burst-and-coast swimming in fishes. Canadian Journal of Zoology, 61: 2491-2494.
Blomberg, S. P. & T. Garland. 2002. Tempo and mode in evolution: phylogenetic inertia, adaptation and comparative methods. Journal of Evolutionary Biology, 15: 899-910.
ter Braak, C. J. F. & P. Smilauer. 2002. CANOCO, reference manual and user’s guide to CANOCO for Windows: Software for canonical community ordination (Microcomputer Power, Ithaca, NY), Version 4.5.
Britski, H. A., K. Z. S. Silimon & B. S. Lopes. 2007. Peixes do Pantanal: manual de identificação. Brasília, Embrapa. Buckup, P. A., N. A. Menezes & M. S. Ghazzi. 2007. Catálogo das
Espécies de Peixes de Água Doce do Brasil. Rio de Janeiro, Museu Nacional, Universidade Federal do Rio de Janeiro. Série Livros 23.
Carvalho, T. P. & J. S. Albert. 2011. The Amazon-Paraguay divide. Pp. 193-202. In: Albert, J. S. & R. E. Reis (Eds.). Historical Biogeography of Neotropical Freshwater Fishes. Los Angeles, California, University of California Press.
Casatti, L. & R. M. C. Castro. 2006. Testing the ecomorphological hypothesis in a headwater riffles fish assemblage of the rio São Francisco, southeastern Brazil. Neotropical Ichthyology, 4: 203-214.
Clarke, K. R. & R. N. Gorley. 2006. PRIMER v6: User Manual/ Tutorial. PRIMER-E, Plymouth.
Crampton, W. G. R. 2011. An ecological perspective on diversity and distributions. Pp. 165-189. In: Albert, J. S. & R. E. Reis (Eds.). Historical Biogeography of Neotropical Freshwater Fishes. Los Angeles, California, University of California Press.
Darwin, C. 1859. On the Origin of Species. London, J. Murray. Desdevises, Y., P. Legendre, L. Azouzi & S. Morand. 2003.
Quantifying phylogenetically structured environmental variation. Evolution, 57: 2647-2652.
Diniz-Filho, J. A. F., C. E. R. Sant’Ana & L. M. Bini. 1998. An eigenvector method for estimating phylogenetic inertia. Evolution, 52: 1247-1262.
Diniz-Filho, J. A. F., L. M. Bini, M. A. Rodríguez, T. F. L. V. B. Rangel & B. A. Hawkins. 2007. Seeing the forest for the trees: partitioning ecological and phylogenetic components of Bergmann’s rule in European Carnivora. Ecography, 30: 598-608.
Diniz-Filho, J. A. F., M. A. Rodríguez, L. M. Bini, M. A. Olalla-Tarraga, M. Cardillo, J. C. Nabout, J. Hortal & B. A. Hawkins. 2009. Climate history, human impacts and global body size of Carnivora (Mammalia: Eutheria) at multiple evolutionary scales. Journal of Biogeography, 36: 2222-2236.
Dobson, F. S. 1985. The use of phylogeny in behavior and ecology. Evolution, 39: 1384-1388.
Emerson, B. C. & R. G. Gillespie. 2008. Phylogenetic analysis of community assembly and structure over space and time. Trends in Ecology and Evolution, 23: 619-630.
Felsenstein, J. 1985. Phylogenies and the comparative method. The American Naturalist, 125: 1-15.
Freckleton, R. P., P. H. Harvey & M. Pagel. 2002. Phylogenetic analysis and comparative data: a test and review of evidence. The American Naturalist, 160: 712-726.
Gatz Jr., A. J. 1979. Ecological morphology of freshwater stream fishes. Tulane Studies in Zoology and Botany, 21: 91-124. Giannini, N. P. 2003. Canonical phylogenetic ordination.
Systematic Biology, 52: 684-695.
Gosline, W. A. 1971. Functional Morphology and Classification of Teleostean Fishes. Honolulu, University Press of Hawaii. Guisande, C., P. Pelayo-Villamil, M. Vera, A.
Manjarrés-Hernández, M. R. Carvalho, R. P. Vari, L. F. Jiménez, C. Fernández, P. Martínez, E. Prieto-Piraquive, C. Granado-Lorencio & S. R. Duque. 2012. Ecological factors and diversification among Neotropical characiforms. International Journal of Ecology, 2012: Article ID 610419, 20 pages, DOI: 10.1155/2012/610419. Available from: http:// www.hindawi.com/journals/ijecol/2012/610419/ (26 June 2014)
Harvey, P. 1996. Phylogenies for ecologists. Journal of Animal Ecology, 65: 255-263.
Hora, S. L. 1930. Ecology, bionics, and evolution of the torrential fauna, with special reference to the organs of attachment. Philosophical Transactions of the Royal Society, Ser. B, 218: 171-282.
Jackson, D. A. 1993. Stopping rules in principal components analysis: a comparison of heuristical and statistical approaches. Ecology, 74: 2204-2214.
Jombart, T., F. Balloux & S. Dray. 2010. adephylo: new tools for investigating the phylogenetic signal in biological traits. Bioinformatics, 26: 1907-1909.
Latrubesse, E. M., J. C. Stevaux, M. L. Santos & M. L. Assine. 2005. Grandes sistemas fluviais: geologia, geomorfologia e paleohidrologia. Pp. 276-297. In: Souza, C. R. G., K. Suguio, A. M. S. Oliveira & P. E. Oliveira (Eds.). Quaternário no Brasil. Ribeirão Preto, Holos Editora.
Lauder, G. V. 1981. Form and function: structural analysis in functional morphology. Paleobiology, 7: 430-442.
Leal, C., N. Junqueira & P. Pompeu. 2011. Morphology and habitat use by fishes of the Rio das Velhas basin in southeastern Brazil. Environmental Biology of Fishes, 90: 143-157. Legendre, P. & L. Legendre. 1998. Numerical Ecology.
Amsterdam, Elsevier Science.
Losos, J. B. 2008. Phylogenetic niche conservatism, phylogenetic signal and the relationship between phylogenetic relatedness and ecological similarity among species. Ecology Letters, 11: 995-1007.
Losos, J. B. & D. B. Miles. 1994. Adaptation, constraint, and the comparative method: phylogenetic issues and methods. Pp. 60-98. In: Wainwright, P. C. & S. M. Reilly (Eds.). Ecological Morphology: Integrative Organismal Biology. Chicago, University of Chicago Press.
Lundberg, J. G, L. G. Marshall, J. Guerrero, B. Horton, M. C. S. L. Malabarba & F. Wesselingh. 1998. The stage for Neotropical fish diversification: a history of tropical South American rivers. Pp. 13-48. In: Malabarba, L. R., R. E. Reis, R. P. Vari, Z. M. Lucena & C. A. S. Lucena (Eds.). Phylogeny and Classification of Neotropical Fishes. Porto Alegre, Edipucrs. Maddison, W. P. & D. R. Maddison. 2011. Mesquite: a Modular
System for Evolutionary Analysis. Version 2.75. Available from: http://mesquiteproject.org.
Mirande, J. M. 2010. Phylogeny of the family Characidae (Teleostei: Characiformes): from characters to taxonomy. Neotropical Ichthyology, 8: 385-568.
Montoya-Burgos, J. I. 2003. Historical biogeography of the catfish genus Hypostomus (Siluriformes: Loricariidae), with
implications on the diversification of Neotropical ichthyofauna. Molecular Ecology, 12: 1855-1867.
Near, T. J., R. I. Eytan, A. Dornburg, K. L. Kuhn, J. A. Moore, M. P. Davis, P. C. Wainwright, M. Friedman & W. L. Smith. 2012. Resolution of ray-finned fish phylogeny and timing of diversification. Proceedings of the National Academy of Sciences, 109: 13698-13703.
Novakowski, G. C., R. Fugi, N. S. Hahn. 2004. Diet and dental development of three species of Roeboides (Characiformes: Characidae). Neotropical Ichthyology, 2: 157-162.
Oliveira, E. F., E. Goulart, L. Breda, C. V. Minte-Vera, L. R. S. Paiva & M. R. Vismara. 2010. Ecomorphological patterns of the fish assemblage in a tropical floodplain: effects of trophic, spatial and phylogenetic structures. Neotropical Ichthyology, 8: 569-586. Pearman, P. B., A. Guisan, O. Broennimann & C. F. Randin. 2008.
Niche dynamics in space and time. Trends in Ecology and Evolution, 23: 149-158.
de Pinna, M. C. C. 1998. Phylogenetic relationships of Neotropical Siluriformes (Teleostei: Ostariophysi): Historical overview and synthesis of hypotheses. Pp. 279-330. In: Malabarba, L. R., R. E. Reis, R. P. Vari, Z. M. S. Lucena & C. A. S. Lucena (Eds.). Phylogeny and Classification of Neotropical Fishes. Porto Alegre, Edipucrs.
Poff, N. L. & J. V. Ward. 1990. The physical habitat template of lotic systems: recovery in the context of historical pattern of spatio-temporal heterogeneity. Environmental Management, 14: 629-645.
R Core Team. 2012. R: a Language and Environment for Statistical Computing. Vienna, Austria, R Foundation for Statistical Computing.
Rangel, T. F. , J. A. F. Diniz-Filho & L. M. Bini. 2010. SAM: A comprehensive application for Spatial Analysis in Macroecology. Ecography, 33: 46-50.
Revell, L. J., L. J. Harmon & D. C. Collar. 2008. Phylogenetic signal, evolutionary process, and rate. Systematic Biology, 57: 591-601.
Ricklefs, R. E. & D. B. Miles. 1994. Ecological and evolutionary inferences from morphology: an ecological perspective. Pp. 13-41. In: Wainwright, P. C. & S. M. Reilly (Eds.). Ecological Morphology: Integrative Organismal Biology. Chicago, University of Chicago Press.
Romero, R. M. & L. Casatti. 2012. Identification of key microhabitats for fish assemblages in tropical Brazilian savanna streams. International Review of Hydrobiology, 97: 526-541.
Schaefer, S. A. & G. V. Lauder. 1986. Historical transformation of functional design: evolutionary morphology of feeding mechanisms in loricarioid catfishes. Systematic Zoology, 35: 489-508.
Schaefer, S. A. & G. V. Lauder. 1996. Testing historical hypotheses of morphological change: biomechanical decoupling in loricarioid catfishes. Evolution, 50: 1661-1675.
StatSoft Inc. 2004. STATISTICA (data analysis software system), version 7. Available from: www.statsoft.com
Strauss, R. E. 1987. The importance of phylogenetic constraints in comparisons of morphological structure among fish assemblages. Pp. 136-142. In: Matthews, W.J. & D. C. Heins (Eds.). Community and Evolutionary Ecology of North American Stream Fishes. Norman, University of Oklahoma Press.
Sullivan, J. P., J. Muriel-Cunha & J. G. Lundberg. 2013. Phylogenetic relationships and molecular dating of the major groups of catfishes of the Neotropical superfamily Pimelodoidea (Teleostei, Siluriformes). Proceedings of the Academy of Natural Sciences of Philadelphia, 162: 89-110. Tófoli, R. M., N. S. Hahn, G. H. Z. Alvez & G. C. Novakowski.
2010. Uso do alimento por duas espécies simpátricas de
Moenkhausia (Characiformes, Characidae) em um riacho da Região Centro-Oeste do Brasil. Iheringia, 100: 201-206. Vari, R. & A. Harold. 2001. Phylogenetic study of Neotropical
fish genera Creagrutus Günther and Piabina Reinhardt (Teleostei: Ostariophysi: Characiformes), with a revision of the cis-Andean species. Washington, D.C., Smithsonian Contributions to Zoology, number 613.
Vitt, L. J. & E. R. Pianka. 2005. Deep history impacts present-day ecology and biodiversity. Proceedings of the National Academy of Sciences, 102: 7877-7881.
Vitt, L. J., E. R. Pianka, W. E. Cooper & K. Schwenk. 2003. History and the global ecology of squamate reptiles. The American Naturalist, 161: 44-60.
Watson, D. J. & E. K. Balon. 1984. Ecomorphological analysis of fish taxocenes in rainforest streams of northern Borneo. Journal of Fish Biology, 25: 371-384.
Webb, P. W. 1977. Effects of median-fin amputation on fast-start performance of rainbown trout (Salmo gairdneri). Journal of
Experimental Biology, 68: 123-135.
Webb, C. O., D. Ackerly & S. Kembel. 2011. Phylocom: software for the analysis of phylogenetic community structure and character evolution. User’s manual, version 4.2.
Wiens, J. J., D. D. Ackerly, A. P. Allen, B. L. Anacker, L. B. Buckley, H. V. Cornell, E. I. Damschen, T. J. Davies, J. Grytnes, S. P. Harrison, B. A. Hawkins, R. D. Holt, C. M. McCain & P. R. Stephens. 2010. Niche conservatism as an emerging principle in ecology and conservation biology. Ecology Letters, 13: 1310-1324.
Winemiller, K. O. 1991. Ecomorphological diversification in lowland freshwater fish assemblages from five biotic regions. Ecological Monographs, 61: 343-365.
Winemiller, K. O., L. C. Kelso-Winemiller & A. L. Brenkert. 1995. Ecomorphological diversification and convergence in fluvial cichlid fishes. Environmental Biology of Fishes, 44: 235-261.
Appendix 1. Description of the ecomorphological attributes and their ecological interpretations.
Attribute Code Formula Interpretation
1. Compression index CI MBD
MBW
High values may indicate a laterally compressed fish, inhabiting lentic habitats (Watson & Balon, 1984).
2. Relative depth RD MBD
SL
Lower values would indicate fishes inhabiting fast waters (Gatz, 1979).
3. Relative caudal peduncle length RCPL CPL
SL
Long peduncles indicate fishes inhabiting turbulent waters and with a good capacity for continuous swimming (Watson & Balon, 1984).
4. Caudal peduncle compression index CPCI CPD
CPW
High values indicate compressed peduncles, which are typical of less active swimmers (Gatz, 1979).
5. Index of ventral flattening IVF MMD
MBD
Low values indicate fishes inhabiting environments with high hydrodynamism, able to maintain their spatial position even when stationary (Hora, 1930).
6. Relative area of dorsal fin RADF DFA
BA
The dorsal fin is mainly a stabilizing plane, functioning also as a rudder (Gosline, 1971). In armored catfishes (Loricariidae), a group which has dorsal fins with a relatively large area, it provides equilibrium in the deflections (E. F. Oliveira, pers. comm.).
7. Relative area of pectoral fin RAPF PFA
BA
High values indicate slow swimmers which use pectoral fins to perform maneuvers and breaking, or fishes inhabiting fast waters which use them as airfoils to deflect the water current upwards and thereby maintain firm attachment to the substrate (Watson & Balon, 1984).
8. Pectoral fin aspect ratio PFAR LPF
WPF
High values indicate long fins, typical of fishes that swim for long distances (Watson & Balon, 1984), or pelagic fishes that swim constantly (Casatti & Castro, 2006).
9. Relative area of caudal fin RACF CFA
BA
High values indicate caudal fins able to produce great and rapid thrusts, necessary for the typical swimming mode of many benthic fishes (Webb, 1977).
10. Relative head length RHL HL
SL
High values may indicate fishes able to feed on relatively larger prey (Gatz, 1979).
11. Relative eye position REP DEM
HD
Position of eyes is assumed to be related to vertical habitat preference (Gatz, 1979); high values indicate dorsally located eyes, typical of benthic fishes (Watson & Balon, 1984).
12. Relative mouth width RMW MW
SL
High values indicate fishes able to feed on relatively large prey (Gatz, 1979).
13. Mouth orientation MO ∠
Mouth orientation indicates in which part of the habitat the fish gets its food. For example, fish with ventral mouths feed on prey attached to the bottom (Gatz, 1979). It was characterized as follows: inferior = between 10° and 80°; terminal = 90°; superior = between 100° and 170°; ventral= 0°. Degree values were converted to radians (unit of plane angle), to allow comparison with attributes with units of another nature, but with the same dimension.
14. Fineness coefficient FC SL
√MBD x MBW
Assesses the influence of body shape on the ability to swim (Blake, 1983).
Values between two and six indicate low drag; the optimum ratio for swimming efficiency is 4.5 (Blake, 1983).
Appendix 2. Fish species used in the ecomorphological analysis in the upper Paraguai and upper São Francisco River
basins, Brazil. Taxonomic classification follows Buckup et al. (2007). *Probably it is a new species in process of description (F. R. Carvalho, pers. com.).
Taxa Upper Paraguai River Upper São Francisco River DZSJRP
Characiformes Parodontidae
Apareiodon ibitiensis Amaral Campos, 1944 X 11575
Parodon nasus Kner, 1859 X 12057
Crenuchidae
Characidium fasciatum Reinhardt, 1867 X X 13717/13829
Characidium zebra Eigenmann, 1909 X 13738
Characidae
Odontostilbe pequira (Steindachner, 1882) X 12049
Serrapinnus calliurus (Boulenger, 1900) X 12167
Astyanax asuncionensis Géry, 1972 X 11998
Astyanax lineatus (Perugia, 1891) X 12106
Astyanax rivularis (Lütken, 1875) X 11520
Astyanax sp. X 12102
Creagrutus meridionalis Vari & Harold, 2001 X 12145
Creagrutus aff. varii Ribeiro, Benine & Figueiredo, 2004* X 11449
Hyphessobrycon luetkenii (Boulenger, 1887) X 11969
Jupiaba acanthogaster (Eigenmann, 1911) X 12071
Moenkhausia bonita Benine, Castro & Sabino, 2004 X 12025
Moenkhausia sanctaefilomenae (Steindachner, 1907) X 12139
Piabarchus torrenticola Mahnert & Géry, 1988 X 12130
Piabina argentea Reinhardt, 1867 X 11495
Siluriformes Trichomycteridae
Trichomycterus brasiliensis Lütken, 1874 X 11531
Trichomycterus reinhardti (Eigenmann, 1917) X 11641
Trichomycterus variegatus Costa, 1992 X 11505
Loricariidae
Neoplecostomus franciscoensis Langeani, 1990 X 11494
Microlepidogaster sp. X 11645
Farlowella paraguayensis Retzer & Page, 1997 X 12146
Harttia cf. novalimensis Oyakawa, 1993 X 11568
Rineloricaria lanceolata (Günther, 1868) X 12206
Hypostomus boulengeri (Eigenmann & Kennedy, 1903) X 11947
Hypostomus cochliodon Kner, 1854 X 12160
Hypostomus sp. X 12161
Ancistrus sp. X 12021
Heptapteridae
Cetopsorhamdia iheringi Schubart & Gomes, 1959 X 11596
Pimelodella gracilis (Valenciennes, 1835) X 12002