www.ann-geophys.net/31/145/2013/ doi:10.5194/angeo-31-145-2013
© Author(s) 2013. CC Attribution 3.0 License.
Annales
Geophysicae
Geoscientiic
Geoscientiic
Geoscientiic
Geoscientiic
Comment on
“Storming the Bastille: the effect of electric fields on the ionospheric
F-layer” by Rishbeth et al. (2010)
B. T. Tsurutani1, A. J. Mannuccci1, O. P. Verkhoglyadova1, and G. S. Lakhina2 1Jet Propulsion Laboratory, California Institute of Technology, Pasadena, CA 91109, USA 2Indian Institute of Geomagnetism, Navi Mumbai, India
Correspondence to:B. T. Tsurutani ([email protected])
Received: 22 April 2012 – Revised: 15 November 2012 – Accepted: 9 January 2013 – Published: 1 February 2013
1 Introduction
In our estimation, Rishbeth et al. (2010) have made several fundamentally incorrect statements. We have great admira-tion for the past works of the now deceased first author, but we feel that corrections need to be made to set the scien-tific record straight. Rishbeth et al. have stated “Mannucci et al. (2005) have shown that, in response to these (merid-ionalE×B) drifts, storm TEC enhancements occur across the dayside ionosphere at low and middle latitudes.” “The work of Mannucci et al. (2005) shows quiet-day TEC at the equator near 50 units with middle latitude values near 30 units of 1016m−2. Even if the entire plasma content at the equator were transported without loss to middle latitudes, it is not possible to account for TEC enhancements to 200 and sometimes 300 units.” “Thus TEC enhancements at latitudes beyond 25 degrees cannot generally be attributed to transport from the equator”. Later they say “Whenever plasma trans-port is invoked to explain an ionospheric phenomenon, one must ask: Can the plasma travel far enough in its lifetime to produce the observed effect? Detailed modeling is needed to settle this question, but in some cases the time required is so long that changes in local time and in the imposed elec-tric field pattern become the dominant consideration. With these considerations, a longitudinally confined, latitudinally extended, TEC enhancement at middle latitudes, such as is observed during superstorm events, would require a similar configuration in the electric field. Evidence for this feature, how it is formed and how it evolves during a storm epoch also represent some key challenges to our understanding.”
It is the purpose of this short note to explain (1) how the “TEC enhancements to 200 and sometimes 300 units”
oc-curs by meridionalE×B drifts and photoionization alone, (2) how “TEC enhancements beyond 25◦can be caused by this same process” and (3) why “the time required is so long that changes in local time and the imposed electric field pat-tern becomes the dominant consideration” is not a real con-cern.
2 What is the source of the near-equatorial and mid-latitude TEC enhancement?
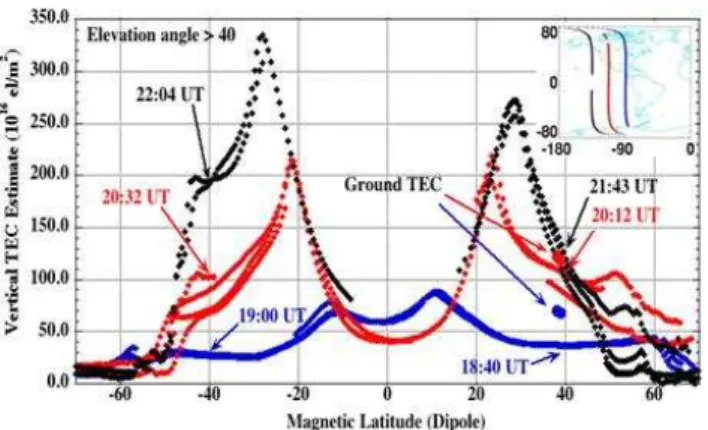
Fig. 1.Three passes of the CHAMP satellite through the dayside ionosphere at∼12:30 to 13:30 MLT. CHAMP was at an altitude of ∼400 km. The blue curve was taken prior to the 30 October 2003 magnetic storm. The red curve was taken at the beginning of the storm, and the black near the end of the storm. The figure is taken from Mannucci et al. (2005), Fig. 3.
(EIAs: Namba and Maeda, 1939; Appleton, 1946) are present at ∼ ±10◦. The next two curves in red and black corre-spond to the TEC above CHAMP after the magnetic storm had started and was in progression. In the 20:12 to 20:32 UT pass (in red), the EIAs are now located at∼ ±22◦ MLAT with peak TEC values of∼210 units. It is also noted that the equatorial region,|MLAT|<10◦, the TEC values are less than that noted during the quiet interval. Some of the plasma in this equatorial region has presumably been swept up and convected to higher altitudes and latitudes by the convection electric field.
The third pass is the most dramatic of all. The black curve with the 21:43 UT and 22:04 UT time indicators shows that the ionospheric anomalies have moved to higher magnetic latitudes and are even more intense. The peaks are now at
∼ ±30◦ and have values of ∼270 TEC units in the North-ern Hemisphere and∼330 TEC units in the Southern Hemi-sphere. The southern hemispheric peak may be higher due to either the fact that the spacecraft passed through the south peak later in time or that this is possibly a seasonal effect.
Another feature present in Fig. 1, but not discussed in Mannucci et al. (2005), is that there are TEC enhancements above quiet time values at magnetic latitudes beyond the ionization peaks. In the two passes during the storm main phase (the red and black curves), there are enhancements up to∼ ±50◦MLAT. In Tsurutani et al. (2004), ground-based TEC data were used to show similar enhancements at these high latitudes. The latter results were for an intense magnetic storm that occurred on 5–6 November 2001.
The main point we wish to make about this figure is that the CHAMP data show that the EIAs become displaced from their normal location (∼ ±10◦) poleward with increasing time. This can only be caused by the prompt penetrating elec-tric field, not by the disturbance winds originating in the
au-winds also be contributing to the intensity of the ionization peaks? This question cannot be answered using spacecraft data alone, but could be answered by computer simulations.
3 Computer modeling of the 30 October 2003 super-storm: SAMI2
The NRL SAMI2 model is a low-latitude ionospheric model that describes the dynamics and chemical evolution of seven ion and seven neutral species (Huba et al., 2000, 2002). Col-lisions between electrons, ions and neutrals are taken into ac-count. SAMI2 solves collisional two-fluid equations for elec-trons and ions along the Earth’s dipole magnetic field lines, taking into account photoionization of neutrals, recombina-tion of ions and electrons, and chemical reacrecombina-tions. Drift of magnetic flux tubes defines the ionospheric plasma transport in a perpendicular direction to the magnetic field lines. The
E×B vertical drift is caused by the eastward polarization electric field superimposed on the Earth’s background mag-netic field. Verkhoglyadova et al. (2006, 2008) have modified SAMI2 to insert a prompt penetration electric field (PPEF). The PPEF is specified along the Equator and mapped to higher latitudes along the magnetic field equipotentials. We do not consider a meridional electric field distribution that is not represented by this mapping.
The PPEF for 30 October 2003 was calculated follow-ing the Rostogi and Klobuchar technique. The Kyoto Uni-versity ionospheric model was used to obtain the conduc-tivity values. The equatorial electrojet was assumed to be centered at an altitude of ∼105 km, where a Cowling con-ductivity of 1.9×10⁻²S m−1was calculated for local noon. The magnetic perturbation at the CHAMP was measured, a ground reflectance of∼11 % and an infinite line current as-sumed in order to derive the electric field intensity. A value of
∼4 mV m−1was obtained. We direct the reader to the orig-inal articles (Verkhoglyadova et al., 2006, 2008) for further details.
The TEC modeling of the 30 October 2003 magnetic storm has been previously shown by Verkhoglyadova et al. (2006, 2008). In Fig. 2, we show the oxygen ions associated with the storm. The top left-hand panel shows the ionosphere prior to the magnetic storm. The northern hemispheric iono-spheric anomaly is at the normal location,∼ +10◦ MLAT. The Southern Hemisphere anomaly is more diffuse and the peak is located at∼ −20◦to−25◦MLAT. This hemispheric difference may be due to seasonal effects.
Fig. 2.Oxygen ion features of the 30 October 2003 magnetic storm modeled by SAMI2. The top-left panel shows the quiet time ionosphere, the top-right the ionosphere after the storm-time electric field has been applied for∼2 h, the bottom-left with the electric field on for∼2 h but with the sun turned off, and the bottom-right, after the magnetic storm had finished for∼2 h. Taken from Tsurutani et al. (2008), Fig. 6.
800 km and at latitudes of∼18◦to 30◦in the north and from
∼ −28◦ to<−35◦ in the south. There are TEC enhance-ments at latitudes above the EIA peaks as well.
Ionospheric electrons were also examined for the same PPEF conditions. The peak locations of the EIAs and the electron densities closely match those of the oxygen ions. For interested readers, we refer them to Verkhoglyadova et al. (2006).
The lower left-hand panel is the same as for the upper right-hand panel, but with the solar photoionization turned off. There are two primary differences between the results of these two cases. With the sun off, the EIA peaks are essen-tially at the same height and latitude location. The peak TEC intensities are lower. The second important feature is that the ions (and electrons) are removed in the near-equatorial range,
±20◦ MLAT. There is a void there. This panel partially answers another question posed by Rishbeth et al. (2010) “. . . one must ask the question Can the plasma travel far enough in its lifetime to produce the observed effect?” It can be concluded from this modeling study that significant TEC enhancements at middle latitudes are possible due to trans-port, not solely by production. Plasma originally from lat-itudes lower than where the “displaced” TEC peaks are ob-served has been transported to the peaks and elsewhere. From
the greater intensity of the displaced EIA peaks in the upper right-hand panel, it can be concluded that solar production of ionization leads to the enhanced densities of the displaced peaks (relative to the nonsolar case).
Finally, we look at the ionosphere∼2 h after the storm has subsided. This is shown in the bottom right-hand panel. The EIA in the Northern Hemisphere is now more intense than that during the storm. The altitude is lower and the latitude is higher. The northern peak is now from∼300 to 550 km at a latitude of∼ +20◦to>30◦ MLAT. The southern hemi-spheric peak is less intense, at an altitude of∼300 to 400 km and a latitude of∼ −30◦MLAT.
Fig. 3. The SAMI2-derived TEC at altitudes above 400 km at ∼13:00 LT and at 25◦ MLAT. The starred values are for a quiet time interval with a peak diurnal electric field of 0.53 mV m−1at 07:00 LT. The open triangles represent the TEC for the case of an electric field of 4 mV m−1for a 2 h duration. In the storm case, the TEC increases until a peak value of∼270 TEC units is reached. This closely matches the peak EIA observed by CHAMP during the third CHAMP pass shown in Fig. 2.
measurements are quite plausible. The storm-time electric field magnitude is a factor of∼8 times the diurnal variation (assumed to be a peak value of 0.53 mV m−1at 07:00 LT in the model).
From the use of the SAMI2 model, which has no distur-bance winds included, it is shown that the features of the peaks in the anomalies can be explained by the PPEF (and photoionization) alone. Most if not all of the peak TEC in-tensities are caused by the PPEFs during the first 2 h of the intense magnetic storm.
4 Where do all the dayside TEC electrons come from?
One question that Rishbeth et al. (2010) posed is where can all these electrons in the Mannucci et al. (2005) observations come from? If one sweeps up all of the near-equatorial elec-trons (and ions), we agree, there is not enough to create peaks with 200 or 300 TEC units at middle latitudes. The answer can be shown graphically in Fig. 4.
Figure 4 shows a scenario for increasing the dayside TEC during a magnetic storm. The top panel shows a quiet time ionospheric density profile as a function of height. When the eastward directed PPEF impinges on the dayside near equa-torial ionosphere, the ionosphere is convected upward, as in-dicated in the bottom panel. In actuality, the ionosphere is convected both upward and towards the magnetic poles, as was shown in Figs. 1 and 2. The ionospheric electron–ion re-combination rate is much slower at higher altitudes
(Tsuru-Fig. 4. A schematic showing the effect of uplifting the F-region ionosphere. The top panel shows the quiet time dayside configura-tion. The bottom panel shows how a new ionosphere is created after the old ionosphere is convected to higher heights during a storm-time PPEF event. Taken from Tsurutani et al. (2004), Fig. 12.
tani et al., 2005), so the “old” ionospheric densities are more or less stable. Meanwhile, the near-equatorial region has be-come out of equilibrium and is subjected to ionization in-crease/replenishment by solar photoionization. Thus, there is a net gain of dayside TEC due to this uplift (and convection to higher latitude) process. We call this overall process the “dayside ionospheric superfountain”.
5 TEC peak locations
2008, 2009). Rishbeth et al. (2010) did their calculations for the Bastille Day storm. The peak Dst value for that storm was−301 nT. The peak Dst for the 30 October 2003 mag-netic storm was−390 nT, a∼25 % increase in intensity. Be-cause the storm convection electric fields and the storm in-tensity are closely related (Gonzalez et al., 1994), one can assume that the 30 October 2003 storm had stronger PPEFs than did the Bastille Day event. A second, related feature is that with stronger PPEFs convecting the plasma to greater heights, the downfalling plasma will go to higher latitudes (shown in Fig. 2).
The 1–2 September 1859 Carrington storm has recently been modeled using the SAMI2 code (Tsurutani et al., 2012). The storm intensity was the highest in recorded history, Dst
∼ −1760 nT. The storm-time electric field has been esti-mated at∼20 mV m−1(Tsurutani et al., 2003). Similar fea-tures to the 30 October 2003 storm were found, but all effects were even more severe. The EIAs were found to be located at∼500 to 900 km altitude with broad peaks located∼ ±25◦ to 40◦MLAT.
6 Final comments
We hope we have answered most of the Rishbeth et al. (2010) comments and questions pertaining to the daytime iono-spheric super-fountain. It has been shown that the convection due to the dayside PPEF and photoionization can cause the displaced EIAs observed by Mannucci et al. (2005) without regard to disturbance dynamo effects. During superstorms, main phases often last only∼2 h (Gonzalez et al., 1994), and “the imposed electric field pattern” is not a major concern. What is still unclear is what is the contribution to enhanced TEC at magnetic latitudes beyond±30◦during superstorms? It is possibly a combination of both PPEFs and the distur-bance winds with expanded convection electric field (Heelis et al., 2009). However, it is clear from this comment paper that transport from lower latitudes and increased production at both middle and lower latitudes may be able to explain all of the Mannucci et al. (2005) observations.
Acknowledgements. Portions of this research were performed at the
Jet Propulsion Laboratory, California Institute of Technology un-der contract with NASA. GSL thanks the Indian National Science Academy, New Delhi, for support under the Senior Science Scheme. Topical Editor K. Kauristie thanks N. Aponte and one anony-mous referee for their help in evaluating this paper.
References
Appleton, E. V.: Two anomalies in the ionosphere, Nature, 157, 691, 1946.
Blanc, M. and Richmond, A. D.: The ionospheric disturbance dy-namo, J. Geophys. Res., 86, 1669–1686, 1980.
Echer, E., Gonzalez, W. D., and Tsurutani, B. T.: Interplane-tary conditions leading to superintense geomagnetic storms (Dst
<−250 nT) during solar cycle 23, Geophys. Res. Lett., 35, L06S03, doi:10.1029/2007GL031755, 2008.
Fuller-Rowell, T. M., Codrescu, M. V., Roble, R. G., and Richmond, A. D.: How does the thermosphere and ionosphere react to a geo-magnetic storm?, in: Magnetic Storm, AGU Geophys. Mon. Ser., 98, edited by: Tsurutani, B. T., Kamide, Y., Gonzalez, W. D., and Arballo, J. K., 203, AGU, Wash. D.C., 1997.
Gonzalez, W. D., Joselyn, J. A., Kamide, Y., Kroehl, H. W., Ros-toker, G., Tsurutani, B. T., and Vasyliunas, V. M.: What is a geo-magnetic storm?, J. Geophys. Res., 99, 5771–5792, 1994. Heelis, A., Sojka, J. J., David, M., and Schunk, R. W.: Storm time
density enhancements in the middle-latitude dayside ionosphere, J. Geophys. Res., 114, A03315, doi:10.1029/2008JA013690, 2009.
Huba, J. D., Joyce, G., and Fedder, J. A.: Sami2 is another model of the ionosphere (SAMI2): a new low-latitude ionosphere model, J. Geophys. Res., 105, 23035–23053, 2000.
Huba, J. D., Dymond, K. F., Joyce, G., Budzien, S. A., Thonnard, S. E., Fedder, J. A., and McCoy, R. P.: Comparison of O+density from ARGOS LORAAS data analysis and SAMI2 model results, Geophys. Res. Lett., 29, 1102, doi:10.1029/2001GL013089, 2002.
Mannucci, A. J., Tsurutani, B. T., Iijima, B. A., Komjathy, A., Saito, A., Gonzalez, W. D., Guarnieri, F. L., Kozyra, J. U., and Skoug, R.: Dayside global ionospheric response to the major interplan-etary events of October 29-30, 2003 “Halloween storms”, Geo-phys. Res. Lett., 32, L12S02, doi:10.1029/2004GL021467, 2005. Mannucci, A. J., Tsurutani, B. T., Abdu, M. A., Gonzalez, W. D., Komjathy, A., Echer, E., Iijima, B. A., Crowley, G., and Ander-son, D.: Superposed epoch analysis of the dayside ionospheric response to four intense geomagnetic storms, J. Geophys. Res., 113, A00A02, doi:10.1029/2007JA012732, 2008.
Mannucci, A. J., Tsurutani, B. T., Kelley, M. C., Iijima, B. A., and Komjathy, A.: Local time dependence of the prompt ionospheric response to the 7, 9, and 10 November 2004 superstorms, J. Geo-phys. Res., 114, A10308, doi:10.1029/2009JA014043, 2009. Namba, S. and Maeda, K.-I.: Radio Wave Propagation, 86 pp.,
Corona, Tokyo, 1939.
Rishbeth, H., Heelis, R. A., Makela, J. J., and Basu, S.: Storming the Bastille: the effect of electric fields on the ionospheric F-layer, Ann. Geophys., 28, 977–981, doi:10.5194/angeo-28-977-2010, 2010.
Tsurutani, B. T., Gonzalez, W. D., Tang, F., and Lee, Y. T.: Great magnetic storms, Geophys. Res. Lett., 19, 73–76, 1992. Tsurutani, B. T., Gonzalez, W. D., Lakhina, G. S., and Alex, S.:
The extreme magnetic storm of 1–2 September 1859, J. Geophys. Res., 108, A7, doi:10.1029/2002JA009504, 2003.
Tsurutani, B. T., Mannucci, A. J., Iijima, B., Abdu, M. A., So-bral, J. H. A., Gonzalez, W. D., Guarnieri, F., Tsuda, T., Saito, A., Yumoto, K., Fejer, B., Fuller-Rowell, T. J., Kozyra, J., Foster, J. C., Coster, A., and Vasyliunas, V. M.: Global day-side ionospheric uplift and enhancement associated with in-terplanetary electric fields, J. Geophys. Res., 109, A08302, doi:10.1029/2003JA010342, 2004.
resultant extreme ionospheric effects: Comparison to other Hal-loween events and the Bastille Day event, Geophys. Res. Lett., 32, L03S09, doi:10.1029/2004GL021475, 2005.
Tsurutani, B. T., Verkhoglyadova, O. P., Mannucci, A. J., Saito, A., Araki, T., Yumoto, K., Tsuda, T., Abdu, M. A., So-bral, J. H. A., Gonzalez, W. D., McCreadie, H., Lakina, G. S., and Vasyliunas, V. M.: Prompt penetration electric fields (PPEFs) and their ionospheric effects during the great magnetic storm of 30–31 October 2003, J. Geophys. Res., 113, A05311, doi:10.1029/2007JA012879, 2008.
Tsurutani, B. T., Verkhoglyadova, O. P., Mannucci, A. J., Lakhina, G. S., and Huba, J. D.: Extreme changes in the dayside iono-sphere during a Carrington-type magnetic storm, Space Weather and Space Climate, 2, A05, doi:10.1051/swsc/2012004, 2012.
event, edited by: Bhardwaj, A. and Duldig, M., Adv. Geosci., 112, 69–77, 2006,
http://www.adv-geosci.net/112/69/2006/.