in Romania with Gini/ Struck Coefficients
of Concentration
Author∗: Daniela ANTONESCU
bstract. A key objective of regional development policy is to reduce disparities between regions and to ensure a relatively balanced level of development. To achieve this goal studies and social and economic analysis based on certain techniques and methods of evaluation are necessary.
In scientific literature, there are plenty of models that can be applied to assess regional disparities. One of the methods commonly used in practice is related to the calculation and analysis of the degree of concentration/diversification of activities within a region.
The increase or decrease in the degree of concentration of certain activities or areas of activity in a region provides information on:
− the level of overall economic development;
− economic development and growth rate;
− the specific features of the region, the potential, local traditions, etc. The expert analysis indicate that, in a high level of overall development or a sustained economic growth rate, there are favorable conditions for economic activities to locate in any region, so they are relatively uniformly distributed throughout the country.
∗ Daniela Antonescu, Ph.D., Scientific Researcher II, Institute of National Economy, e-mail:
Knowing the degree of concentration and also the influence factors are useful in making decisions and setting regional policy measures.
This article proposes a synthetic analysis of the development level of regions in Romania with the concentration/diversification model (Gini/Struck coefficients), based on the existing key statistical indicators.
Key words: regional disparities, concentration/diversification, regional analysis
JEL classification: R1, R12, R15
1. Introduction
Lately, an increased interest, in regional research area, presents the concentration analysis, with which we can illustrate the intensity of certain phenomena on economic and social categories, the dominant areas, the territorial distribution of some phenomena, etc. In addition, the concentration analysis allows for comparability of data between identical or different phenomena, starting from the same or different number of units, for the same year or different years, etc.
Given the above considerations, this article proposes an assessment of the degree of concentration/diversification in the developing regions of Romania, through a method commonly used by experts in the field: analysis of regional concentration/diversification degree. This method of analysis is also known as the Gini/Struck coefficients method1.
To achieve the analysis, we used statistical indicators that exist at regional level, grouped by main areas, so that the whole range of economic and social activities of scientific interest can be covered: demography (total population, urban, rural), workforce (employees), economic potential, health, telecommunications, urban infrastructure, investment, regional GDP.
To interpret the results of this analysis we took into account the fact that a higher value of the concentration/diversification coefficients involves an increase in disparities at territorial level, while a lower value may reflect a balanced
1 The Gini coefficient is the measure of statistical dispersion used, in particular, to represent
distribution of some general or specific activities/phenomena. Also, the interpretation of results implies that the Region 8 Bucharest-Ilfov is a major urban area, which may significantly affect the obtained results.
2. Theoretical and methodological issues concerning the analysis of concentration/ diversification at regional level
The methodology proposed in this article is based on the analysis of regional disparities in relation to the coefficients of concentration/diversification (also known as indices of geographic distribution).
The interpretation of concentration coefficients shows, in case they are close to zero level, the state of “equity”, balance or proportion between the different analyzed elements.
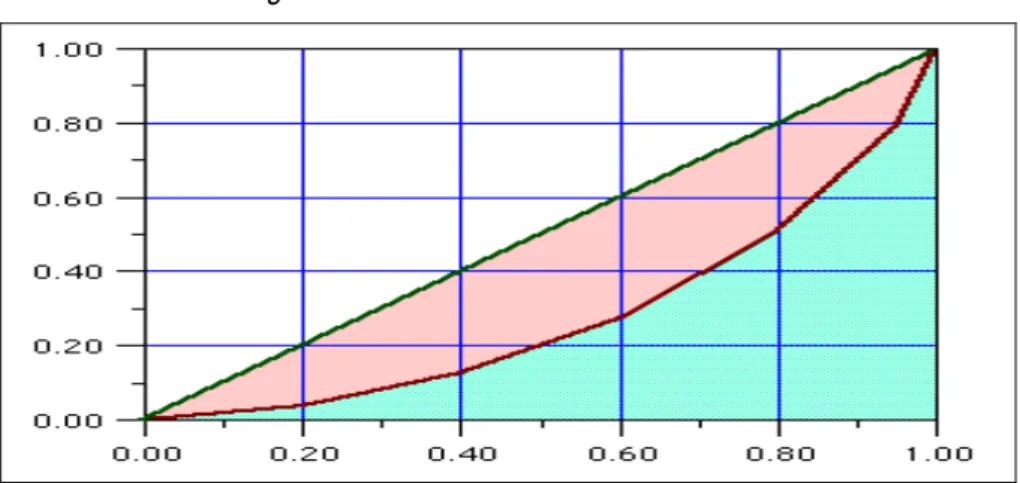
Measuring the concentration degree of an activity in a region is based the Lorentz curve and the Gini/Struck coefficient1 (Figure 1).
The concentration curve (Lorentz-Gini) is a graphical representation of a q variable according to p, the values of the two variables being defined by the following relations:
pi = Ni/Σni (1)
qi = Li/ Σxini (2)
1 There are also other indicators related to this coefficient, which may provide an insight into
the level of concentration/diversification of a regional series, as follows:
The Onicescu informational energy – calculated as a sum of the squares of weights of all parts of a collectivity; it has the disadvantage of variability of the minimum possible value, depending on the number of categories/groups and the corrected informational energy, which eliminates the inconvenience of the indicator;
The index of qualitative variation, its value ranging between 0-1; the more it approaches 0, the more it increases the degree of uniformity (reduced variation);
where: pi represents the relative flocks cumulated till the i level of the clustering feature and qi represents the global values cumulated till the i level.
The Lorentz curve gives the intensity picture of the analyzed process or phenomenon, and also the ability to quantify its level of concentration. Thus, as the concentration curve deviates more from the square diagonal, the disparities are larger and the concentration is stronger.
The Gini concentration coefficient is defined as a ratio of the concentration surface to the square area, but the square’s area being equal to 1 or 100%, the index value is dimensionless, that is independent of the measure units of the studied variable.
Figure 1: Lorentz-Gini concentration curve
The formula used to calculate the Gini coefficient (GC) is the following (with values on the interval [1/n0,5; 1] and n = number of observations):
For normalization is also used the corrected GC (CGC), by the next formula:
∑
= = n i
i p C G
1 2
n n CG CGC
1 1
/ 1
CGC takes values in the interval [0; 1]; for a better use of the CGC interval, it amounts to square.
The Struck concentration coefficient represents the corrected form of the Gini coefficient; the values may be in the interval [0; 1]; the minimum possible value (zero) is independent of the number of considered categories, which allows comparison with other structures. The Struck concentration coefficient is calculated as:
The analysis of indicators on the concentration/diversification can indicate how far we are in comparison with the state of uniform and balanced distribution of economic results registered at the regional level.
Next, to identify the regional disparities in Romania in 2008 and compare with 2000, we will use the Gini/Struck concentration/diversification coefficients method.
3. The assessment of regional disparities
In 2008, at regional level, the concentration analysis was based on the two coefficients presented above (Gini/Struck), taking into account 10 groups of indicators.
If the value of the coefficients exceeded 0.3, there is a relative concentration that can be mentioned and taken into account, and if the value was close to 0.5, then we can speak of a high concentration.
The calculations were made at regional level, taking into account the inherent limitations related to available statistical databases.
3.1. Population at regional level
The regional concentration analysis was based on the following statistical indicators: total population, population in urban and rural areas.
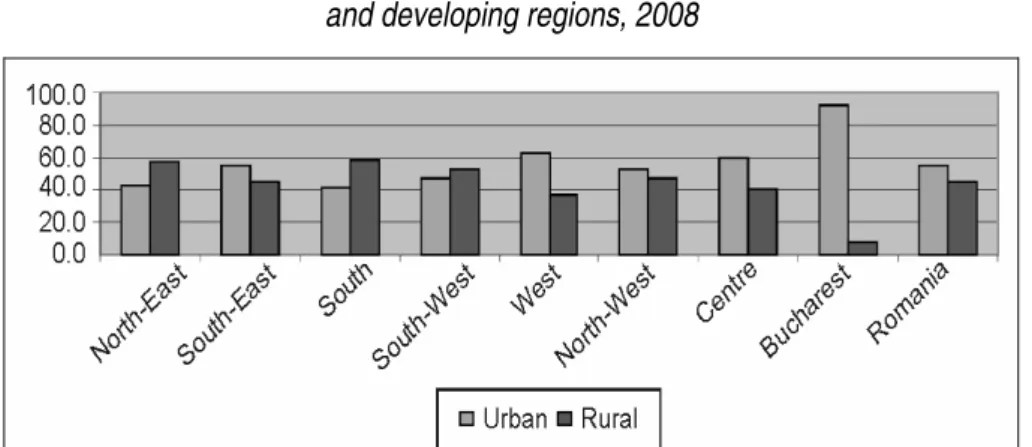
The analysis of existing data shows that, in 2008, nationally, there was a predominantly urban population (55.04%), while at regional level, five of the eight
1
2
−
∑
=
nn giregions held a majority urban population (South-East, West, North-West, Centre and Bucharest – Figure 2).
Figure 2: Structure of total population in urban/rural and developing regions, 2008
Source: Data based on the Romanian Statistical Yearbook 2009, NIS, Bucharest.
As concerns the concentration of total population and in urban and rural areas, the coefficient value is below 0.15, which means that, in the year 2008 (July 1), there was no significant concentration of the total population in the eight development regions. Also, the urban population does not show an important concentration at regional level (Gini coefficient is below 0.1).
The regional allocation of the population is relatively balanced, the exception being the allocation of rural population at regional level, where, because the Bucharest-Ilfov region is highly urbanized, there is a greater concentration of rural population in the other regions (the Gini coefficient is 0.244) (Figure 3).
Compared with the year 20001, it is found that there was no increase in the concentration of total population, but there was a slight increase in the concentration of rural population (the Gini coefficient was 0.233 in 2000, while in 2008 it reached 0.244).
1 See: Daniela Antonescu – Regional Development in Romania – concept, mechanisms,
Figure 3: Regional concentration of population, year 2008
Source: Data based on the Romanian Statistical Yearbook 2009, NIS, Bucharest.
3.2. Workforce
The analysis of the concentration of workforce was based on the following indicators: employment in major economic sectors, number of employees and the number of unemployed.
The level of Gini/Struck coefficients reveals that there is a low concentration of the employed population in the eight development regions, the value of the Gini coefficient being around 0.114 and the value of the Struck coefficient being only 0.083. Compared with 2000, there is an increase in the degree of concentration of employed population (the Gini coefficient was 0.095 and the Struck coefficient was 0.069).
There is a relative concentration of employed population in agriculture and forestry, the Gini coefficient being over 0.3 (the Gini coefficient is 0.341 and the Struck coefficient is 0.259), largely due to the importance of the Bucharest-Ilfov urban region.
relatively high concentration in the two major categories of services: commercial (Gini coefficient is 0.343) and social (Gini coefficient is 0.335) (Figure 4).
Compared with 2000, there was a significant increase in the concentration of employed population in the service sector (in 2000, the Gini coefficient was 0.128 in commercial services and 0.008 in social services).
Figure 4: Regional concentration of workforce, 2008
0,000 0,050 0,100 0,150 0,200 0,250 0,300 0,350 0,400
Gini Coefficient Struck Coefficient
Emlopyed population by economic activity, of which: Agriculture&Forestry Industry&Constructions Services Commercial services Social services
Source: Data based on the Romanian Statistical Yearbook 2009, NIS, Bucharest.
Figure 5: Regional concentration of the number of employees and unemployed, 2008
Source: Data based on the Romanian Statistical Yearbook 2009, NIS, Bucharest
3.3. Economic potential
To assess the concentration of the economic potential at regional level we used the following indicators: the number of active firms at regional level, grouped by size and the number of employees.
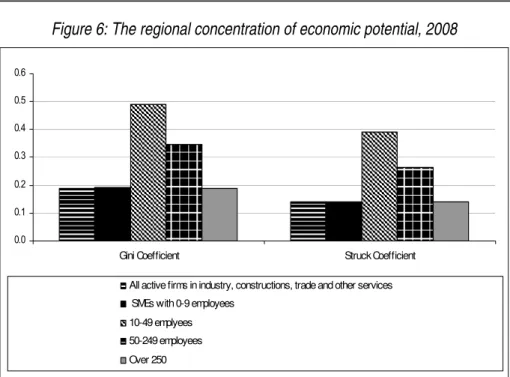
According to the Gini/Struck coefficients, there are, at regional level, the following situations (Figure 6):
9 Relatively low concentration of the total number of firms (the Gini coefficient is 0.189 and the Struck coefficient is 0.139);
9 Relatively low concentration of small firms (0-9 employees) and large companies (over 250 employees); the calculated coefficients record values below 0.20;
9 Relatively high concentration of companies with 50-249 employees (the Gini coefficient is 0.346);
9 Strong concentration of firms with 10-49 employees (the Gini coefficient is 0.49);
Figure 6: The regional concentration of economic potential, 2008
0.0 0.1 0.2 0.3 0.4 0.5 0.6
Gini Coefficient Struck Coefficient
All active firms in industry, constructions, trade and other services SMEs with 0-9 employees
10-49 emplyees 50-249 employees Over 250
Source: Data based on the Romanian Statistical Yearbook 2009, NIS, Bucharest.
3.4. The economic and financial results
The analysis of the economic results has been achieved in terms of total turnover, the turnover considered for manufacturing industry and also to the one obtained by the business services sector.
As shown in Figure 7, there is a significant concentration of the total turnover (the Gini coefficient is 0.360 and the Struck coefficient is 0.275). The greatest concentration is recorded in the turnover of commercial/business services, which has a Gini coefficient of about 0.428. The concentration is especially visible in the Bucharest-Ilfov region, which owns 41% of the total turnover of the business sector.
Figure 7: Regional concentration of economic and financial results, 2008
0 0.05 0.1 0.15 0.2 0.25 0.3 0.35 0.4 0.45
Gini Coefficient Struck Coefficient
Turnover of commercial services
Turnover of processing industry
Turnover of active firms in industry, constructions, trade and other services
Source: Data based on the Romanian Statistical Yearbook 2009, NIS, Bucharest.
3.5. Health infrastructure
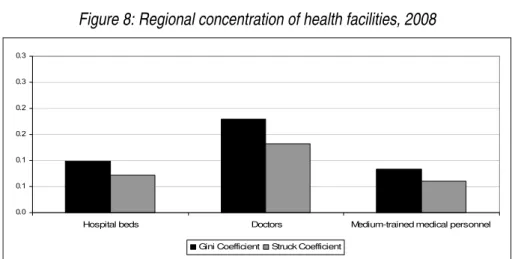
The analysis of the concentration in this sector was based on the following specific indicators: the number of doctors in the region, the number of existing beds and the number of average staff working in the sector.
As shown in Figure 8, there is no significant regional concentration (the values of the two coefficients are below 0.3).
Figure 8: Regional concentration of health facilities, 2008
0.0 0.1 0.1 0.2 0.2 0.3 0.3
Hospital beds Doctors Medium-trained medical personnel
Gini Coefficient Struck Coefficient
Source: Data based on the Romanian Statistical Yearbook 2009, NIS, Bucharest.
3.6. Urban infrastructure
Given the importance and complexity of this area, but also the existence of an increased volume of specific data, for the calculation of the degree of concentration/diversification of the sector on development regions several key indicators were used:
9 The simple length of gas distribution pipelines; 9 The localities where thermal energy is distributed; 9 Railway lines;
9 The length of public roads.
As shown in Figure 9, the regional infrastructure has a relatively high concentration, with Gini coefficients values over 0.22 for indicators such as simple length of gas distribution pipelines and localities where thermal energy is distributed, especially in the Center region (it holds about 0.25% of the total length of pipelines) and the South region (with 19% of all localities in which heat is distributed).
Slightly lower values are recorded for the other two indicators (railway lines and public roads), the Gini coefficient value being under 0.20. In this case, the regions that have high weights are: the West region, which owns 18% of the total railway lines, and the North-East region, which owns 17% of all urban public roads.
Figure 9: Regional concentration of urban infrastructure, 2008
0 0.05 0.1 0.15 0.2 0.25
Simple lenght of gas distribution pipelines
Localities where heat is distributed
Railways Lenght of public public roads (km)
Gini Coefficient Struck Coefficient
Source: Data based on the Romanian Statistical Yearbook 2009, NIS, Bucharest.
3.7. The investments
The analysis of regional concentration of investments was based on the following indicator: gross investments of active local units.
Thus, as shown in Figure 10, both Gini and Struck coefficients indicate that, at regional level, there is a significant concentration of gross investments, implying that, some regions (especially the Bucharest-Ilfov region) attracted a bigger number of investors. We can talk about an important concentration of investments at regional level, the values of the two coefficients being over 0.3 (the Gini coefficient is 0.396).
Compared with 2000, this concentration increased visibly and some regions were more attractive in terms of local investors (the Gini coefficient increased from 0.3 to about 0.4 in that period).
Figure 10: Regional concentration of investments, 2008
0 0.05 0.1 0.15 0.2 0.25 0.3 0.35 0.4 0.45
Gini Coefficient Struck Coefficient
Struck CoefficientGross investments made by active local companies
As concerns the concentration of active companies in the economic sectors, we may also find that some regions are more attractive than others and the concentration is stronger.
Thus, in 2008, there was a greater concentration in the real estate transactions field (the Gini coefficient was 0.403). Far behinol, there were other areas with a relative concentration: education (the Gini coefficient was 0.255), health (the Gini coefficient was 0.219), construction (the Gini coefficient was 0.194). The lowest regional concentration is represented by the hotels and restaurants sector (the Gini coefficient was 0.102), showing a relatively uniform distribution at regional level leading to a relatively balanced and sustainable development (Figure 11).
Figure 11: Regional concentration of active companies in economic sectors and regions, 2008
0.0 0.1 0.1 0.2 0.2 0.3 0.3 0.4 0.4 0.5 A ll a c tiv e lo c a l c om p ani es in in d u stry E x tra c tiv e in d u s try P roc es s ing indus tr y E lec tr ic and the rm al po w e r, gas a nd wat e r Cons tr uc tions W ho le s al e and re ta il tra d e Hot e s & Res taur ant s Tr ans por t& s tor age Real es ta te tr ans ac tions Educ at ion Heat h O ther ac tiv iti es Gini Coefficient
Source: Data based on the Romanian Statistical Yearbook 2009, NIS, Bucharest.
3.8. Education and research
Thus, in 2008, in this area, most indicators that have been analyzed have recorded significant concentrations at regional level, excepting the indicator number of universities/faculties, whose coefficient was below 0.3 (Gini coefficient was 0.260).
The most important concentration was recorded by the indicator “number of researchers”, whose Gini coefficient reached the value of 0.494, followed closely by the indicators: number of students (Gini coefficient was 0.471) and total research expenditures (Gini coefficient was 0.464) (Figure 12).
Figure 12: Regional concentration in education and research field, 2008
0.0 0.1 0.2 0.3 0.4 0.5 0.6
Higher education institutions
Faculties Enrolled students
Female students Professors Researchers Total expenditure from RD activity
(million lei, current prices)
Gini Coefficient
Source: Data based on the Romanian Statistical Yearbook 2009, NIS, Bucharest.
3.9. Local budget
Figure 13: Regional concentration of local budgets, 2008
0.00 0.02 0.04 0.06 0.08 0.10 0.12 0.14
Local budget revenues Local budget expenditures
Gini Coefficient Struck Coefficient
Source: Data based on the Romanian Statistical Yearbook 2009, NIS, Bucharest.
3.10. Regional concentration of GDP
The evolution of total GDP indicator concentration was calculated for the period 1995-2007.
In 1995, regional GDP concentration was very low, the Gini coefficient being 0.066. The difference between the highest and lowest values of the regional GDP occurred between the South and South-West regions, including West (22%).
In 2000, there was a first clear trend of increasing concentration, the Gini coefficient reaching 0.142.
Calculated for 20071, the Gini coefficient recorded a value of 0.172, which means a relatively low concentration of total regional GDP (Figure 14).
1 Although there are national GDP data on 2008 at regional level, this indicator stops in 2007
Figure 14: Concentration of regional GDP, 1995-2007
0.0 0.0 0.0 0.1 0.1 0.1 0.1 0.1 0.2 0.2 0.2
1995 1996 1997 1998 2000 2001 2002 2003 2004 2005 2006 2007
Gini Coefficient Coeficientul Struck
Source: Data based on the Romanian Statistical Yearbook 2009, NIS, Bucharest.
Figure 15: The evolution of regional GDP, 1995-2007
0 50000 100000 150000 200000 250000 300000 350000
North-East South-East South South-West
West North-West Center Bucharest
RGDP-1995 RGDP-1996 RGDP-1997 RGDP-1998 RGDP- 2000 RGDP-2001 RGDP-2002 RGDP-2003 RGDP-2004 RGDP-2005 RGDP-2006 RGDP-2007
Source: Data based on the Romanian Statistical Yearbook 2009, NIS, Bucharest.
4. Regional concentration of EU financed proj ects
assessment was also made on how the implementation of Regional Operational Programme 2007-2013 was carried on until the year 2008 (December 31)1.
According to this programming document, the allocation of funds to regions was made in order to achieve the established strategic goal: the balanced development of all regions in Romania, giving priority to the regions and areas that are less developed to prevent increasing social and economic disparities between regions.
Programming the allocation of funds by regions was done differently, in inverse proportion to their level of development2. Thus, regions with a low GDP per capita will receive a higher share of total program funds, while the share of financial allocations will be smaller for regions with a higher GDP per capita3.
Figure 16: Financial allocation by development regions of the Regional Operational Programme (2007-2013)
Source: Data based on the Romanian Statistical Yearbook 2009, NIS, Bucharest.
From the analysis of Gini coefficients can be seen that, at regional level, there is a not significant concentration of projects (the Gini coefficient is under 0.3). We can notice that it is a relative concentration of rejected projects (the Gini
1 The status of implementation of ROP 2007-2013 an 31st December 2008 was as follows:
about 1337 projects were submitted, relating to 11 major intervention areas (ROP 14 areas in total), totaling 3.46 billion Euros; ERDF funding was 2.1 billion Euros. There have been contracted 40 projects (representing 3% of submitted projects) totaling 352 million Euros (10.1% of the total sum of submitted projects), of which ERDF funding was 251.7 million Euros. In 2008, payments were not made.
2 Measured by the GDP per capita, adjusted by a coefficient of population density.
3 The financial allocations to regions range between the minimum of 8.86%, in Bucharest-Ilfov
coefficient is 0.19 and Struck Coefficient is lower) (Figure 17). At regional level, there is a uniform distribution of projects submitted. For rejected projects we may notice an increase of Gini Coefficient comparatively with submitted projects (80.9%).
Figure 17: Comparative analysis – submitted, rejected and contracted projects (30 October 2010)
Regional concetration of projects under FEDR (submitted, rejected, contracted)
0.107
0.193
0.158
0.077
0.142
0.116
0.0 0.1 0.1 0.2 0.2 0.3
Submitted Rejected Contracted
Gini Coefficient Struck Coefficient
Source: Authors' computations.
First place in the rejected projects (value) is held by the Centre region, with 21.08%, followed by the South region (14.91%) and North West region (13.81%). The last place was held by North East region, with 8.61% of the rejected projects (Figure 18).
Figure 18: Share of submitted, contracted and rejected projects value in total (%) – 30 October 2010
Share of submitted, contracted and rejected projects value in total (%)
0.0 5.0 10.0 15.0 20.0 25.0
Submitted Contracted Rejected
Submitted 15.53 10.17 14.06 12.93 12.70 12.01 13.50 9.09 Contracted 23.27 11.12 14.28 15.30 9.24 12.21 11.01 3.58 Rejected 8.61 9.35 14.91 10.81 11.48 13.81 21.08 9.96
North-East South-East South South-West West North-West Center Bucharest-Ilfov
Source: Authors' computations on basis Annex 1 and Annex 2.
In terms of absorption capacity, Regional Operational Programme takes the first place from this point of view. At the end of October 2010, maximum absorption capacity is for ROP (27.76% = payments contribution UE/Allocation UE 2007-2013). The minim value of absorption capacity is for Operational Programme Transport (1.85% = payments contribution UE/Allocation UE 2007-20131) (Annex 3).
5. Conclusions
By this article we have sought an analysis of the main types of regional disparities, in 2008 and also in comparison with 2000, based on the Gini/Struck coefficient method and the existing statistical data in the Romanian Statistical Yearbook – 2009. The results obtained after applying the concentration coefficients are the following:
1. Most coefficients have values placed in the interval [0-0.3]; this shows a relatively uniform distribution, without too much concentration in those areas;
2. There are, however, some sectors that have a high degree of concentration (coefficients over 0.35: population from urban/rural, the SME sector [10-49 and 50-249 employees], total turnover and trade, employment in some sectors [trade], gross investments, active local units in the real estate transactions sector, institutions of higher education, research;
3. Also, there were high levels of Gini coefficients for the submission and contracting of projects financed by the Structural Funds, which shows a greater concentration of the capacity to absorb funds at regional level;
4. The analysis of the evolution of Gini/Struck coefficients shows a clear trend of increasing the concentration of regional disparities in Romania, after the year 2000.
As regards the Structural Funds absorption indicators, it appears that there is a higher concentration compared to other analyzed indicators (population, number of employees, employment). The degree of submission and contracting of projects, financed from the Structural Funds, is determined, on the one hand, by the capacity of a region to propose viable projects, and on the other hand, by the local power to co-finance. Although the proposed financial allocation through the Regional Operational Programme, for the current programming period, took into account the regional development level, it appears that the poorer regions (e.g.: North-East), although they had a large number of projects, they have not yet been contracted. The most contracted projects, under implementation, have been submitted for the South-West, North-West and Centre.
The explanation of this phenomenon results from the following aspects:
9 The access to finance: “freezing” the banking sector, with direct effects on the access to credits, which seriously affects the capacity to co-finance the recipients of ROP (both local authorities and the sector);
9 The availability of public resources: deteriorating the situation of public finances, which leads to a higher public deficit, which pressures on the capacity of the Ministry of Finance to ensure co-financing;
9 Maintaining the relevance of some targets that do not fit anymore the current context: create jobs – 15000 new jobs;
9 Adapting the Romanian legislation, on a regular basis, to the requirements of the process of accessing and absorbing Structural Funds;
9 Frequent change of the Applicant Procedures and Guidebooks;
9 Demobilization of the applicants because of bureaucracy, in many cases “overwhelming”, in terms of endorsement and approval of submitted documentation and reports related to the stage of fulfilment of commitments (internal and external);
9 Other macroeconomic factors: the decrease of foreign investments, elimination of a large number of companies, etc,
Finally, one can say that the regional disparities level, in terms of economic and social development, is in a process of growth across all country, without being able to identify one or another model of development. Also, it is clear that the Bucharest-Ilfov region, the most developed region of the country, determines an increase in the concentration of certain areas, In parallel, we can observe a slight increase, which is concentrated in the regions from the west of the country (North-West, Centre and West) and less in the eastern regions (North-East, South-East, South and South-West), although the real growth could be better assessed at the sub-regional level1, where are very obvious the signs of
economic decoupling of some marginal areas located on the periphery or face specific development problems,
As a final remark, we underline the necessity to take measures and to create the mechanism to actually promote convergence; taking into account the circumstances created so far, according to, the relatively developed regions are those that access far more Structural Funds than those underdeveloped, which in no case is likely to reduce regional disparities.
1 To better highlight the current regional situation, we propose, in a future article, a further
Annex 1: Implementation Stage of Operational Programme for Regional Development at 30 October 2010
Submitted Rejected Contracted Region
Allocation (FEDR + State Budget)
Mil.lei
No. Value No. Value No. Value
North-East 2,915.4 1176 5140,4 342 612,3 180 2038,6
South-East 2,366.9 961 3366,9 249 665,6 112 974,0
South 2,542.0 960 4653,4 177 1060,7 91 1251,5
South-West 2,502.7 833 4279,4 239 769,5 122 1340,1
West 1,846.8 715 4204,2 163 816,6 105 809,5
North-West 2,159.7 1165 3974,1 353 982,7 125 1069,8
Center 1,947.2 1084 4468,4 480 1499,8 138 964,5
Bucharest-Ilfov 1,582.7 614 3006,6 187 708,7 49 313,8
TOTAL 17,863.4 7508 33093,5 2190 7115,9 922 8761,8
Source: data of www.Inforegio.ro – Implementation Stage of Operational Programme for Regional Development at 30 October 2010.
Annex 2: Payments of Operational Programme for Regional Development at 30 October 2010
Total payments 18.10.2010 Effective Payments in 2010 Payments
lei euro lei euro Prefinancing
Prefinancing from FEDR 1,354,030,766 322,388,278 679,390,866 161,759,730 Reimbursements
FEDR 480,447,125 114,392,173 383,245,465 91,248,920
Cofinancing 89,438,604 21,294,906 71,223,981 16,958,091
Total Reimbursements 569,885,729 135,687,078 454,469,445 108,207,011
TOTAL Payments 1,923,916,495 458,075,356 1,133,860,311 269,966,741
% Payments contribution UE/Allocation
UE 2007-2013 27,761
Source: www.Inforegio.ro.
Annex 3: Absorption rate of Operational Programme – 30 October 2010
Operational Programme % Absorption Rate
1 Regional 27,76
2 Human Resources 23,3
3 Competitiveness 15,92
Operational Programme % Absorption Rate
4 Environment 11,63
5 Technical Assistance 8,29
6 Administrative Capacity 5,92
7 Transport 1,83
Sources: http://www.fonduri-ue.ro/upload/Anexa%201%2030%20noiembrie%202010.pdf (prefinancing + FEDR allocation)
References
1. Antonescu D, – „Regional development in Romania – concept, mechanisms, institutions”
Oscar Print Publishing (B+ category), ISBN 973-668-011-8, 238 pages, 2004 (www,bookfinder,com);
2. Nicolae V, Daniela-Luminita Constantin, Basis of regional and urban economy, Oscar Print
Publishing, Bucuresti, 1998;
3. Paelinck J, Klaassen H., 1979, Spatial Econometrics, Saxon House;
4. Pecican E, S, 2007, Econometric for the economists, Economic Publishing, Bucharest;
5. Michael E, Porter (2005), Business Competitiveness Index, in: World Economic Forum, The
Global Competitiveness Report 2005/06;
6. Michael E, Porter (1990), The Competitive Advantage of Nations, Free Press;
7. Michael E, Porter (2003), The Economic Performance of Regions, Regional Studies, Volume
37, Numbers 6-7 / August-October 2003;
8. Săvoiu Gh, Crăciuneanu V, Ţaicu M, A new method for concentration analysis and market
diversification, Romanian Statistic Review no, 2/2010;
9. Quah D,, 1996, Twin peaks: Growth and convergence in models of distribution dynamics,
Economic Journal, 106;
10. Waterson M, 1984, Economic Theory of the Industry, Cambridge Univ, Press;
11. Zaman, Gheorghe & Georgescu, George, 2009, "Structural Fund Absorption: A New
Challenge For Romania?," Journal for Economic Forecasting, Institute for Economic Forecasting, vol, 6(1), pages 136-154, March;
12. Zaman, Gheorghe & Daniela-Luminita Constantin& Zizi Goschin, 2008, "EU Cohesion Policy
Needs Differentiated Policy Mix Adequate To Specifics Of Economic Regions," Romanian Journal of Economics, Institute of National Economy, vol, 26(1(35)), pages 33-63, June;
13. ESPON Monitoring Committee (2007), ESPON project 4,1,3 – Feasibility study on monitoring
territorial development based on ESPON key indicators;
14. National Development Plan 2007-2013, Bucharest: Romanian Government;
15. Lisbon European Council (2000), Presidency Conclusions, Document DOC/00/8;
16. Regional Operational Programme 2007-2013, Government of Romania, Ministry
Development, Public Works and Housing,
17. Watterson M, 1984, Economic Theory of the Industry, Cambridge University Press;
18. *** 2003, Statistics Dictionary, Economic Publishing, Bucharest;
19. *** 1979, Mathematic Dictionary: Scientific Publishing, Bucharest;
20. ***Romanian Statistical Yearbook 2009, NSI, Bucharest;
21. ***Annual Report of Implementation of ROP 2007-2013 – ACIS (www.acis.ro);
22. World Economic Forum (2005), The Global Competitiveness Report 2005/06, Palgrave