Impact of the Preoperative Controlling
Nutritional Status (CONUT) Score on the
Survival after Curative Surgery for Colorectal
Cancer
Yasuhito Iseki, Masatsune Shibutani*, Kiyoshi Maeda, Hisashi Nagahara, Hiroshi Ohtani, Kenji Sugano, Tetsuro Ikeya, Kazuya Muguruma, Hiroaki Tanaka, Takahiro Toyokawa, Katsunobu Sakurai, Kosei Hirakawa
Department of Surgical Oncology, Osaka City University Graduate School of Medicine, Osaka, Japan
*fbxbj429@ybb.ne.jp
Abstract
Background
Recently, the preoperative immune-nutritional status has been reported to correlate with the survival rate in patients with colorectal cancer (CRC). However, there have been no reports on the relationship between the controlling nutritional status (CONUT) score and the clinical outcome after curative surgery for CRC. We herein evaluated the prognostic significance of the CONUT score in patients with CRC, and then compared the accuracy of the CONUT score and the prognostic nutritional index (PNI) as a predictor of survival.
Methods
We retrospectively reviewed a database of 204 patients who underwent curative surgery for Stage II/III CRC. Patients were divided into two groups according to the CONUT score and the PNI.
Results
The five-year cancer-specific survival (CSS) rate was significantly higher at 92.7% in the low CONUT group, compared to a rate of 81.0% in the high CONUT group (p=0.0016). The five-year CSS was 71.2% in the low PNI group and 92.3% in the high PNI group, which showed a significant difference (p=0.0155). A multivariate analysis showed that lymph node metastasis and the CONUT score were independent risk factors for CSS.
Conclusion
This study suggested that the CONUT score is a strong independent predictor of the survival among CRC patients.
a11111
OPEN ACCESS
Citation:Iseki Y, Shibutani M, Maeda K, Nagahara H, Ohtani H, Sugano K, et al. (2015) Impact of the Preoperative Controlling Nutritional Status (CONUT) Score on the Survival after Curative Surgery for Colorectal Cancer. PLoS ONE 10(7): e0132488. doi:10.1371/journal.pone.0132488
Editor:Pei-Yi Chu, School of Medicine, Fu Jen Catholic University, TAIWAN
Received:December 18, 2014
Accepted:June 15, 2015
Published:July 6, 2015
Copyright:© 2015 Iseki et al. This is an open access article distributed under the terms of the Creative Commons Attribution License, which permits unrestricted use, distribution, and reproduction in any medium, provided the original author and source are credited.
Data Availability Statement:All relevant data are within the paper.
Funding:The authors have no support or funding to report.
Introduction
Colorectal cancer (CRC) is the third most common cancer in the world [1].
Although the surgical procedures and chemotherapy for CRC have improved, the clinical outcome of CRC is still poor, as one-third of the patients who undergo curative resection die within five years after surgery [2]. Therefore, it is necessary to identify biomarkers that can pre-dict the prognosis and individualize the therapy based on the stratification of risks. Many stud-ies about the potential prognostic factors for CRC have been carried out, and the preoperative immune-nutritional status has been reported to correlate with the survival for CRC [3–7].
Recently, the prognostic nutritional index (PNI), which was calculated from the serum albu-min concentration and the total peripheral lymphocyte count, has been used to predict the risk of postoperative complications [8], and it has also been reported to correlate with the survival in CRC patients [3,9]. Regarding the PNI, we consider that the serum albumin concentration tends to be excessively emphasized. However, the serum albumin concentration has been reported to be easily influenced by not only the nutritional status, but also by changes in the body fluid volume, such as those due to the dehydration/fluid retention status and inflamma-tion caused by chronic disease [10,11]. Therefore, this study focused on evaluating the Con-trolling Nutritional Status (CONUT) score [10].
The CONUT score is an index calculated from the following factors; the serum albumin concentration, the total peripheral lymphocyte count and total cholesterol concentration. Total cholesterol concentration has also been reported to correlate with the progression of cancer [11]. A more accurate evaluation can be obtain by reducing the importance of the serum albu-min concentration and adding the total cholesterol concentration to the evaluation criteria [12]. Although the prognostic significance of the PNI has been reported in numerous previous reports, there have been no reports on the relationship between the CONUT score and the clin-ical outcome after curative surgery for CRC.
The aim of this retrospective study is to determine whether the preoperative CONUT score could be a useful predictor of the survival in patients with CRC, and to compare the accuracy of the CONUT score and the PNI as a predictor of the survival rate of such patients.
Patients and Methods
Patients
We retrospectively reviewed a database of 204 patients who underwent curative surgery for Stage II/III CRC at the Department of Surgical Oncology, Osaka City University, Japan between April 2004 and December 2009. We performed a retrospective review of 204 patients with Stage II or III CRC. We obtained written informed consent from the patients for partici-pation and the study protocol was approved by the ethics committee of Osaka City University. Our investigation was conducted according to the principles expressed in the Declaration of Helsinki. The resected specimens were assessed using The International Union Against Cancer (UICC) staging classification of colorectal cancer [13]. All patients were followed up until April 2012 or until their deaths.
The indications for undergoing adjuvant chemotherapy included patients with Stage III or risk Stage II disease. T4 tumors, lymphatic vessel invasion, blood vessel invasion, high-grade histology, presentation with obstruction/perforation and inadequate lymph node sam-pling were defined as high-risk Stage II disease. The decision of whether or not the patients should undergo adjuvant chemotherapy was determined by the surgeons with the patients’
There were no patients treated with neoadjuvant chemotherapy in this study.
Methods
The preoperative blood samples were obtained within two weeks before the operation. The CONUT score was calculated using the serum albumin concentration, peripheral lymphocyte count and the total cholesterol concentration, as described inTable 1[12].
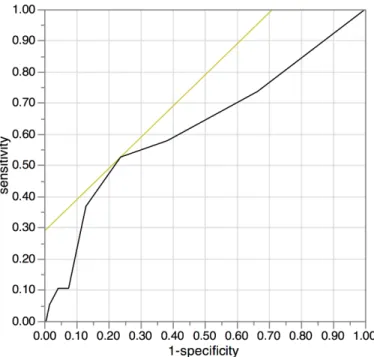
We used the continuous variable Controlling Nutritional Status (CONUT) as the test vari-able and cancer-specific survival as the state varivari-able. An investigation of the cut-off value for the CONUT score using the receiver operating characteristic (ROC) curve showed the most appropriate cut-off value for the CONUT score to be 3 (AUC; 0.624, 95%CI: 0.476–0.771, p = 0.076, the sensitivity was 0.5263 and the specificity was 0.7622.). We indicated the ROC curve onFig 1. Therefore, we set 3 as the cut-off value for the CONUT score in this study and classified the patients into high CONUT (3) and low CONUT (2) groups.
The following formula was used to calculate PNI: 10 × serum albumin concentration (g/dL) + 0.005 × total peripheral lymphocyte count (per mm3) [8]. As with previous reports in which a low PNI (<40) was reported to be a prognostic factor for CRC [3], we also set 40 as the
cut-off value of the PNI in the present study. The patients were divided into two groups; a low PNI (<40) group and a high PNI (40) group.
Regarding the relapse-free survival, relapse was noted as cancer relapse and deaths of all causes was treated as relapse. The survival times were measured from the date of the operation to the date of being lost to follow-up, the date of relapse, the date of death of all causes or April 30, 2012, whichever occurred first.
As to cancer-specific survival, deaths noted to be caused by colorectal cancer were treated as deaths, and other deaths were regarded as censored events. The survival times were measured from the date of operation to the date of being lost to follow-up, the date of death or April 30, 2012, whichever occurred first.
Differences between the groups were analyzed using theχ2test and the Wilcoxon signed rank test. The duration of survival was calculated according to the Kaplan-Mayer method. Dif-ferences in the survival curves were assessed with the log-rank test. A multivariate analysis of the clinicopathological factors for survival was performed using a Cox proportional hazard model. Statistical significance was set at a value of p<0.05. The JMP 11 software program (SAS
Institute, Cary, NC, USA) was used to analyze the data. Table 1. Assessment of the nutritional status using the CONUT score.
None Light Moderate Severe
Serum albumin (g/dL) 3.50 3.00–3.49 2.50–2.99 <2.50
Score 0 2 4 6
Total lymphocyte count (/mm3) 1600 1200
–1599 800–1199 <800
Score 0 1 2 3
Total cholesterol (mg/dL) 180 140–179 100–139 <100
Score 0 1 2 3
Add scores 2 Low CONUT group
3High CONUT group
CONUT: controlling nutritional status; PNI: prognostic nutritional index; SD: Standard deviation de Ulibarri Perez JI, et al. (2005) Nutr Hosp.[10]
Results
Clinical characteristics
The patient characteristics are shown inTable 2. Fifty-four patients were classified into the high CONUT group and one hundred and fifty patients were classified into the low CONUT group, based on the cut-off value of 3. One hundred and seventy-seven patients were classified into the high PNI group and twenty-seven patients were classified into the low PNI group, based on the cut-off value of 40. All patients with a low PNI were included in the high CONUT group (Table 3).
There were no operation-related deaths or hospitalization deaths in this study. Regarding complications, the number of cases with more than Clavien-Dindo classification 2 complica-tions was 40 (19.6%). Specifically, 10 patients had anastomotic leakage, 23 patients had infec-tious complications and 19 patients had other complications.
Ninety-seven of 160 patients (60.8%) received adjuvant chemotherapy. As a result, 93 patients were given the 5-fluolouracil (FU) regimen and four patients were given the 5-FU+-Oxaliplatin regimen.
The primary tumor was resected in all patients. In cases of recurrent disease, some tumors were removed surgically, and one patient chose chemotherapy. A total of 24 patients (51.1%) received resection for recurrent tumors out of 47 patients with recurrent disease.
Fig 1. The receiver operating characteristic (ROC) curve for the controlling nutritional status (CONUT).We used the continuous variable Controlling Nutritional Status (CONUT) as the test variable and 5-year cancer-specific survival as the state variable. An investigation of the cut-off value for the CONUT score using the receiver operating characteristic (ROC) curve showed the most appropriate cut-off value for the CONUT score to be 3 (AUC; 0.624, 95%CI: 0.476–0.771, p = 0.076, the sensitivity was 0.5263 and the
specificity was 0.7622.). We indicated the ROC curve on Fig 1. Therefore, we set 3 as the cut-off value for the CONUT score in this study and classified the patients into high CONUT (3) and low CONUT (2) groups.
The correlations between the CONUT/PNI and the clinicopathological
factors
The CONUT score had a significant relationship with the age (p = 0.0016) and tumor location (p = 0.0168). The PNI had significant relationship with the age (p = 0.0001), tumor location (p = 0.0224), and adjuvant chemotherapy (p = 0.0030) (Table 2).
Table 2. The relationships between the CONUT score and PNI and the clinical background of the patients.
The CONUT score PNI
High (N = 54) Low(N = 150) p-value 40 (N = 177) <40 (N = 27) p-value
Sex
Male 27 85 0.7110 101 11 0.1131
Female 27 65 76 16
Age (years)
mean±SD 66.09±9.23 71.13±11.57 0.0001 66.37±9.99 74.33±8.15 0.0001
Tumor location
Colon 41 87 0.0169 106 22 0.0224
Rectum 13 63 71 5
Tumor size (cm)
mean±SD 5.05±0.26 4.38±0.15 0.1068 4.47±1.80 5.09±2.35 0.2611
Depth of tumor invasion
T1,2,3 32 105 0.1539 120 17 0.6213
T4 22 45 57 10
Lymph node metastasis
Negative 30 89 0.6298 104 15 0.7539
Positive 24 61 73 12
Lymphatic vessel invasion
Negative 14 40 0.9266 46 8 0.6834
Positive 38 105 125 18
Venous invasion
Negative 44 116 0.4573 138 22 0.6267
Positive 8 29 33 4
Adjuvant chemotherapy
No 31 66 0.0907 77 20 0.0030
Yes 23 84 100 7
Complications
No 44 120 0.8141 145 19 0.1591
Yes 10 30 32 8
CONUT: controlling nutritional status; PNI: prognostic nutritional index; SD: Standard deviation
doi:10.1371/journal.pone.0132488.t002
Table 3. The distribution according to the CONUT score/PNI and the five-year survival rate.
The CONUT score
Low High
PNI Low 0 27 (71.2%)
High 150 (92.7%) 27 (89.1%)
Number (five-year cancer-specific survival rate, %), (p<0.0001) CONUT: controlling nutritional status; PNI: prognostic nutritional index
Survival analysis according to the CONUT and PNI
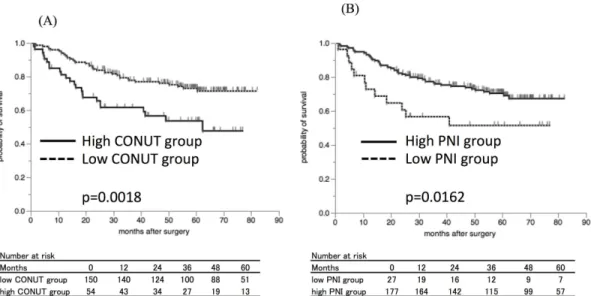
The five-year relapse-free survival (RFS) rate was 73.0% in the low CONUT group and 53.6% in the high CONUT group (Fig 2), with a significant difference between the groups
(p = 0.0018). In addition, the five-year RFS was significantly lower at 51.5% in the low PNI group compared to 70.4% in the high PNI group (Fig 2, p = 0.0162).
The five-year cancer-specific survival (CSS) was 92.7% in the low CONUT group and 81.0% in the high CONUT group (Fig 3), and there was a significant difference between the low and Fig 2. The Kaplan-Mayer survival curves for the relapse-free survival (RFS).A) The survival curves according to the CONUT score. The relapse-free survival rates were significantly worse in the high CONUT group compared to the low CONUT group (p = 0.0018). B) The survival curves according to the PNI. The relapse-free survival rates were significantly worse in the low PNI group compared to the high PNI group (p = 0.0162).
doi:10.1371/journal.pone.0132488.g002
Fig 3. The Kaplan-Mayer survival curves for the cancer-specific survival (CSS).A) The survival curves according to the controlling nutritional status (CONUT) score. The cancer-specific survival rates were significantly worse in the high CONUT group compared to the low CONUT group (p = 0.0016). B) The survival curves according to the prognostic nutritional index (PNI). The cancer-specific survival rates were significantly worse in the low PNI group compared to the high PNI group (p = 0.0155).
high CONUT groups (p = 0.0016). Moreover, the five-year CSS was significantly lower at 71.2% in the low PNI group compared to 92.7% in the high PNI group (Fig 3, p = 0.0155).
Prognostic factors influencing the RFS and the CSS
The correlations between the RFS and clinicopathological factors are shown inTable 4. The patient sex, age, lymphatic vessel invasion, vessel invasion, lymph node metastasis, preopera-tive carbohydrate antigen 19–9 (CA19-9 level), CONUT score and PNI were significantly asso-ciated with the RFS. When a multivariate analysis was performed, T4 tumor, preoperative carcinoembryonic antigen (CEA) level and adjuvant chemotherapy, which are known as prog-nostic factors well [3,9], were added as covariates. A multivariate analysis showed that sex (Odds ratio (OR) = 2.135, 95% confidence interval(CI); 1.177–4.036, p = 0.0121), age (OR = 1.864, 95%CI; 1.009–3.482, p = 0.0469), venous invasion(OR = 2.069, 95%CI; 1.051–
3.955, p = 0.0359) and the preoperative CA19-9 level (OR = 2.816, 95%CI; 1.252–5.997, p = 0.0134) were independently associated with the RFS (Table 4).
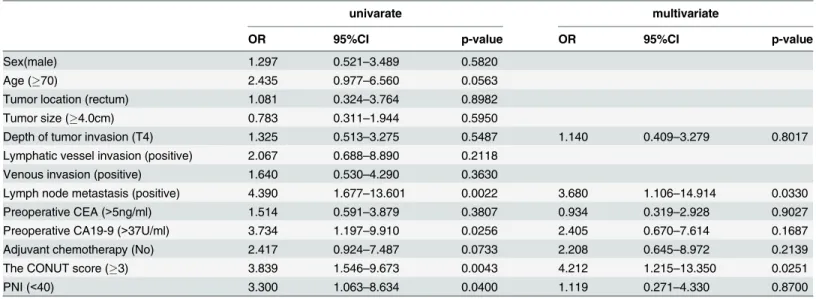
The correlations between the CSS and the clinicopathological factors are shown inTable 5. A univariate analysis indicated that lymph node metastasis, the preoperative CA19-9 level, the CONUT score and the PNI were significantly associated with the CSS. When a multivariate analysis was performed, T4 tumor, preoperative carcinoembryonic antigen (CEA) level and adjuvant chemotherapy were added as covariates. A multivariate analysis showed that only lymph node metastasis (OR = 3.680, 95%CI; 1.106–14.914, p = 0.0330) and the CONUT score (OR = 4.212, 95%CI; 1.215–13.350, p = 0.0251) were independently associated with the CSS (Table 5).
The comparison between the CONUT score and factors that comprise
the CONUT score
The influence of the factors that comprise the CONUT score (albumin level, the total choles-terol level and the total peripheral lymphocyte count) on survival was examined.
Table 4. The results of the univariate and multivariate analyses of the prognostic factors for the relapse-free survival (RFS).
Univariate Multivariate
OR 95%CI p-value OR 95%CI p-value
Sex (male) 1.718 1.027–3.960 0.0391 2.135 1.177–4.036 0.0121
Age (70) 2.193 1.326–3.689 0.0022 1.864 1.009–3.482 0.0469
Tumor locatiom (rectum) 1.778 0.851–3.963 0.1280
Tumor size (4.0cm) 1.019 0.600–1.692 0.9415
Depth of tumor invasion (T4) 1.479 0.885–2.440 0.1335 1.548 0.812–3.020 0.1861
Lymphatic vessel invasion (positive) 2.085 1.102–4.369 0.0225 1.838 0.832–4.643 0.1379
Venous invasion (positive) 2.332 1.320–3.974 0.0043 2.069 1.051–3.955 0.0359
Lymph node metastasis (positive) 2.167 1.313–3.623 0.0025 1.783 0.929–3.470 0.0822
Preoperative CEA (>5ng/ml) 1.268 0.762–2.097 0.3576 1.137 0.628–2.117 0.6750
PreoperativeCA19-9 (>37U/ml) 3.080 1.554–5.645 0.0021 2.816 1.252–5.997 0.0134
Adjuvant chemotherapy (No) 1.277 0.774–2.137 0.3394 1.002 0.508–2.013 0.9952
The CONUT score (3) 2.210 1.307–3.662 0.0036 1.836 0.844–3.713 0.1206
PNI (<40) 2.130 1.082–3.867 0.0301 1.011 0.384–2.600 0.9825
OR: odds ratio; CI: confidence interval; CEA: carcinoembryonic antigen; CA19-9: carbohydrate antigen 19–9; CONUT: controlling Nutritional status; PNI:
prognostic nutritional index
The cut-off values for each of the factors were determined by their respective ROC curves on cancer-specific survival. The cut-off value for the albumin level was 3.5 g/dL, that for the total cholesterol level was 168 mg/dL and that for the total peripheral lymphocyte counts was 1170/ mm3. In the univariate analysis for RFS, the albumin level (p = 0.025) and the total cholesterol level (p = 0.032) were found to be predictive factors (Table 6). In the univariate analysis for CSS, the albumin level and the total peripheral lymphocyte level were found to be predictive factors.
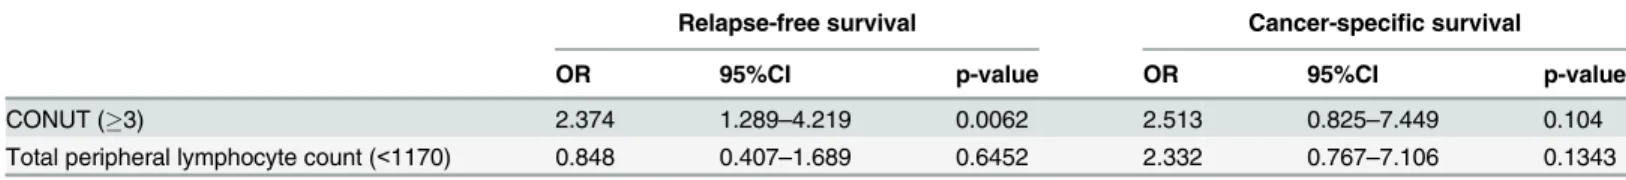
The multivariate analysis for RFS indicated the CONUT score to be a more useful factor than the total cholesterol level and total peripheral lymphocyte counts (Tables7,8and9). The Table 5. The results of the univariate and multivariate analyses of the prognostic factors for the cancer-specific survival (CSS).
univarate multivariate
OR 95%CI p-value OR 95%CI p-value
Sex(male) 1.297 0.521–3.489 0.5820
Age (70) 2.435 0.977–6.560 0.0563
Tumor location (rectum) 1.081 0.324–3.764 0.8982
Tumor size (4.0cm) 0.783 0.311–1.944 0.5950
Depth of tumor invasion (T4) 1.325 0.513–3.275 0.5487 1.140 0.409–3.279 0.8017
Lymphatic vessel invasion (positive) 2.067 0.688–8.890 0.2118
Venous invasion (positive) 1.640 0.530–4.290 0.3630
Lymph node metastasis (positive) 4.390 1.677–13.601 0.0022 3.680 1.106–14.914 0.0330
Preoperative CEA (>5ng/ml) 1.514 0.591–3.879 0.3807 0.934 0.319–2.928 0.9027
Preoperative CA19-9 (>37U/ml) 3.734 1.197–9.910 0.0256 2.405 0.670–7.614 0.1687
Adjuvant chemotherapy (No) 2.417 0.924–7.487 0.0733 2.208 0.645–8.972 0.2139
The CONUT score (3) 3.839 1.546–9.673 0.0043 4.212 1.215–13.350 0.0251
PNI (<40) 3.300 1.063–8.634 0.0400 1.119 0.271–4.330 0.8700
OR: odds ratio; CI: confidence interval; CEA: carcinoembryonic antigen; CA19-9: carbohydrate antigen 19–9; CONUT: controlling Nutritional Status; PNI:
prognostic nutritional index
doi:10.1371/journal.pone.0132488.t005
Table 6. The results of univariate analysis of the albmin, total cholesterol level and total peripheral lymphocytes count for the survival.
Relapse free survival Cancer specific survival
OR 95%CI p-value OR 95%CI p-value
Albumin (<3.5g/dL) 2.013 1.105–3.481 0.0235 2.889 1.013–7.300 0.0475
Total cholesterol level (<168mg/dL) 1.783 1.049–2.963 0.0332 2.339 0.903–5.798 0.0784
Total peripheral lymphocyte count (<1170mm3) 1.431 0.744
–2.558 0.2681 4.003 1.548–9.905 0.0054
OR: odds ratio; CI: confidence interval; CONUT: controlling Nutritional Status
doi:10.1371/journal.pone.0132488.t006
Table 7. The results of the multivariate analysis of the association between the CONUT score and the albumin level with relapse-free survival and cancer-specific survival.
Relapse-free survival Cancer-specific survival
OR 95%CI p-value OR 95%CI p-value
CONUT (3) 2.04 0.962–3.989 0.0621 3.637 1.071–10.915 0.0393
Albumin (<3.5) 1.141 0.524–2.555 0.741 1.102 0.322–3.945 0.8764
OR: odds ratio; CI: Confidence interval.
multivariate analysis showed the CONUT score to be superior to the serum albumin level and the total cholesterol score for predicting CSS. This study suggested that the CONUT score is a more useful factor for predicting survival than the individual factors that comprise the CONUT score (Tables7,8and9).
Discussion
Various methods to evaluate the immune-nutritional status have been advocated, and recently the PNI has been reported to be associated with the postoperative survival in CRC patients [3–
7,14,15]. Besides the indicating the nutritional status of a patient [16], the subjective global assessment (SGA) was also reported to be associated with the survival for CRC patients [4]. However, the SGA includes many subjective factors which require expert knowledge to accu-rately measure them [4], thereby limiting its clinical application.
The CONUT score, which was reported to correlate with the SGA, was developed to evalu-ate the nutritional status more easily and more objectively [12]. However, there have been no previous reports on the relationship between the preoperative immune-nutritional status and the survival after curative surgery for CRC using the CONUT score. This is therefore the first report to evaluate the prognostic significance of the CONUT score in patients with CRC.
The serum albumin concentration is influenced by not only the nutritional status [11], but also by many other factors, such as damage to hepatocytes, infection, inflammation, dehydra-tion or fluid retendehydra-tion status, etc. [10,17]. The lower albumin level in some patients may due to the production of cytokines and CRP, which modulate the production of albumin [11,18]. It was shown that a systemic and chronic inflammatory response to CRC was associated with a reduction in the survival of CRC patients [19,20]. It was also reported that as the inflammation due to cancer increased, the serum albumin concentration of the patients decreased. The poorer prognosis of the CRC patients with lower albumin concentration was associated with the presence of chronic and systemic inflammation [9].
The total peripheral lymphocyte count is one of the indicators of the immunological status [21]. T-lymphocytes play an important role in the immune response to cancer [22,23]. Menges Table 8. The results of the multivariate analysis of the association between the CONUT score and the total cholesterol level with relapse-free sur-vival and cancer-specific sursur-vival.
Relapse-free survival Cancer-specific survival
OR 95%CI p-value OR 95%CI p-value
CONUT (3) 1.966 1.127–3.363 0.0178 3.327 1.242–8.952 0.8017
Total cholesterol level (<168mg/dL) 1.440 0.821–2.474 0.1996 1.488 0.539–3.977 0.4340
OR: odds ratio; CI: confidence interval: CONUT: controlling nutritional status.
doi:10.1371/journal.pone.0132488.t008
Table 9. The results of the multivariate analysis of the association between the CONUT score and the total peripheral lymphocyte count with relapse-free survival and the cancer-specific survival.
Relapse-free survival Cancer-specific survival
OR 95%CI p-value OR 95%CI p-value
CONUT (3) 2.374 1.289–4.219 0.0062 2.513 0.825–7.449 0.104
Total peripheral lymphocyte count (<1170) 0.848 0.407–1.689 0.6452 2.332 0.767–7.106 0.1343
OR: odds ratio; CI: confidence interval; CONUT: controlling nutritional status
et al. revealed that lymphopenia caused by the systemic inflammatory response is characterized by significant depression of the innate cellular immunity, indicated by a marked decrease in T-4 helper lymphocytes and natural killer cells [2T-4]. A decrease in T-lymphocytes was reported to correlate with a poor prognosis because of the inadequate immune response to cancer [22, 23]. As above, a decrease in the peripheral lymphocyte count is a poor prognostic factor in CRC patients [25].
Low serum cholesterol levels were reported to be associated with a poorer prognosis in patients with various cancers [11,26,27]. Although it remains unclear why a low serum choles-terol level is associated with a poor prognosis, hypocholescholes-terolemia is not considered to be a cause of cancer, but to be induced by cancer [11]. There is increased expression of LDL recep-tor mRNA in tumor tissue than in normal tissue. The expression of LDL receprecep-tors on tumor cells makes them take up many LDLs [28], which decreases the serum cholesterol level [28]. In addition, the LDL cholesterol taken up into tumor cells increases tumor growth [29–31]. This hypothetical mechanism is supported by the reports that the serum cholesterol level increased after tumor resection [28]. A decrease in the serum cholesterol level means not only a lack of caloric intake, but also a loss of cholesterol from the cell membrane [10]. Hypocholesterolemia influences the cell membrane fluidity, which affects the mobility of cell surface receptors and their ability to transmit transmembrane signals [32]. Therefore, even if there are a sufficient number of immunocompetent cells present, they are unable to exert their immunological func-tion against cancer cells due to the changes in their membranes [32,33]. It has been hypothe-sized that this is why hypocholesterolemia is associated with a poor prognosis.
The PNI, which is the immune-nutritional index calculated using the serum albumin level and the peripheral lymphocyte count, has previously been reported to be associated with the survival in CRC patients [3,9].
In the present report, the CONUT score more accurately predicted the survival in CRC patients than the PNI. Although the CONUT score and the PNI have common factors, they led to different results. Therefore, we examined the reasons why the CONUT score was superior to the PNI in predicting the prognosis. We found that all of the patients with a low PNI were included in the high CONUT group (Table 3). Because the CONUT score could detect the patients who were expected to have a poor prognosis, including some who were not detected by the PNI, the CONUT score was a more accurate prognostic indicator than the PNI. The patients with a high CONUT score who were not included in the low-PNI group had a low peripheral lymphocyte count and/or hypocholesterolemia. This is due to the fact that there is a higher emphasis placed on the peripheral lymphocyte count in the CONUT score. In addition, total cholesterol concentration which is not included in the PNI is an additional factor evalu-ated in the CONUT score. This is why the CONUT score is considered to be able to detect the patients who will have a poor prognosis more sensitively than the PNI.
Based on the results of the present study, it is thought that the use of the preoperative CONUT score could enable the stratification of risk for poor survival and help to individualize treatments. In clinical practice, patients with a higher risk of death from colorectal cancer can be selected based on the preoperative immune-nutritional status. The administration of more effective adjuvant chemotherapy to reduce the risk of recurrence and shorten the follow-up interval in order to diagnose early recurrence can improve the prognosis.
to the PNI in this study, this result is based on an analysis of only 27 patients with the high CONUT/high PNI. Therefore, it may be difficult to draw any final conclusions based on such a small sample size. Fourth, there are many countries in which there are large gaps in income among individuals. Income is associated with the nutritional status and medical treatment. Under the Japanese Social Security system, the entire population is guaranteed the right to a minimum standard of living and affordable medical treatment. Therefore, there are fewer problems of malnutrition and poor medical care due to poverty in Japan. Likewise, chemother-apy is widely available and is appropriately used to treat patients. There are no significant gaps in income between the rich and poor in Japan. On the other hand, it might be necessary to con-sider this situation in other countries.
Conclusion
The results of this study suggest that the CONUT score is a strong independent predictor of survival among CRC patients. Furthermore, the CONUT score might be a more sensitive prog-nostic factor than the PNI.
Acknowledgments
We thank Brian Quinn who provided medical writing services on behalf of JMC, Ltd.
Author Contributions
Conceived and designed the experiments: YI MS K. Maeda. Performed the experiments: YI. Analyzed the data: YI. Contributed reagents/materials/analysis tools: YI MS K. Sugano TI. Wrote the paper: YI. Manuscript review and validation: MS K. Maeda HO HN K. Muguruma HT TT K. Sakurai KH.
References
1. Ferlay J, Soerjomataram I, Ervik M, Dikshit R, Eser S, Mathers C, et al. GLOBOCAN 2012 v1.0, Cancer Incidence and Mortality Worldwide: IARC CancerBase No. 11 [Internet]. Lyon, France: International Agency for Research on Cancer; 2013.[cited in 2014 Aug 6] Available:http://globocan.iarc.fr.
2. Mcardle CS, Hole DJ. (2002) Outcome following surgery for colorectal cancer: analysis by hospital after adjustment for case-mix and deprivation. Br J Cancer. Feb 1; 86(3):331–5. PMID:11875693
3. Nozoe T, Kohno M, Iguchi T, Mori E, Maeda T, Matsukuma A, et al. (2012) The prognostic nutritional index can be a prognostic indicator in colorectal carcinoma. Surg Today. 42:532–535. doi:10.1007/
s00595-011-0061-0PMID:22139087
4. Gupta D, Lammerfeld CA, Vashi PG, Burrows J, Lis CG, Grutsch JF. (2005) Prognostic significance of Subjective Global Assessment (SGA) in advanced colorectal cancer. Eur J Clin Nutr. Jan; 59(1):35–40.
PMID:15252422
5. Silvia Fernandes Mauricio M, da Silva JB. Tatiana BM, Correia MI. (2013) Relationship between nutri-tional status and the Glasgow Prognostic Score in patient with colorectal cancer. Nutrition Apr; 29(4): 625–9. doi:10.1016/j.nut.2012.09.016PMID:23298973
6. Maeda K, Shibutani M, Otani H, Nagahara H, Sugano K, Ikeya T, et al. (2014) Low nutritional prognos-tic index correlates with poor survival in patients with StageIV colorectal cancer following palliative resection of primary tumor. World J Surg. 38:1217–1222. doi:10.1007/s00268-013-2386-xPMID:
24305937
7. Ikeya T, Shibutani M, Maeda K, Sugano K, Nagahara H, Ohtani H, et al. (2014) Maintenance of the nutritional prognostic index predicts survival in patients with unresectable metastatic colorectal cancer. J Cancer Res Clin Oncol. Aug 15 [Epub ahead of print]
8. Onodera T, Goseki N, Kosaki G. (1982) Prognostic Nutritional Index in gastrointestinal surgery of mal-nourished cancer patients.Nippon Geka Gakkai Zasshi. 85:1001–5. Japanese.
9. Mohri Y, Inoue Y, Tanaka K, Hiro J, Uchida K, Kusunoki M. (2013) Prognostic nutritional index predicts postoperative outcome in colorectal cancer. World J Surg. Nov; 37(11):2688–92. doi:
10. de Ulibarri Perez JI, Fernandez G, Rodriguez Salvanes F, Diaz Lopez AM. (2014) Nutritional screening; control of clinical undernutrition with analytical parameters. Nutr Hosp. Jan 13; 29(4):797–811. doi:10.
3305/nh.2014.29.4.7275PMID:24679020
11. Cengiz O, Kocer B, Sürmeli S, Santicky MJ, Soran A. (2006) Are pretreatment serum albumin and cho-lesterol levels prognostic tools in patients with colorectal carcinoma? Med Sci Monit. Jun; 12(6): CR240–7. PMID:16733481
12. de Ulibarri JI, Gonzalez-Madrono A, de Villar NG, Gonzalez P, Gonzalez B, Mancha A, et al. (2005) CONUT: A tool for Controlling Nutritional Status. First validation in a hospital population. Nutr Hosp. Jan-Feb; 20(1):38–45 PMID:15762418
13. Sobin L, Gospodarowicz M, Wittekind C, International Union Against Cancer (2009) In: TNM classifica-tion of malignant tumors, 7th edn. Wiley, New York, p73–77
14. Boonpipattanapong T, Chewatanakornkul. (2006) Preoperative carcinoembryonic antigen and albumin in predicting survival in patients with colon and rectal carcinomas. J Clin Gastroenterol. Aug; 40(7): 592–5. PMID:16917399
15. Delmore G. (1997) Assessment of nutritional status in cancer patients:widely neglected? Support care cancer. Sep; 5(5):376–80. PMID:9322349
16. Gonzalez-Madrono A, Mancha A, Rodriguez FJ, Culebras J, de Ulibarri JI. (2012) Confirming the valid-ity of the CONUT system for early detection and monitoring of clinical undernutrition; comparison with two logistic regression models developed using SGA as the gold standard. Nutr Hosp. Mar-Apr; 27(2): 564–71. doi:10.1590/S0212-16112012000200033PMID:22732985
17. Yeun JY, Kaysen GA. (1998) Factors influencing serum albumin in dialysis patients. Am J Kidney Dis. 32(Suppl.4):S118–S125.
18. Heys SD, Walkaer LG, Deehan DI, Eremin OE. (1998) Serum albumin: a prognostic indicator in patients with colorectal cancer. J R Coll Surg Edinb. Jun; 43(3):163–8. PMID:9654876
19. Koike Y, Miki C, Okugawa Y, Yokoe T, Toiyama Y, Tanaka K, et al. (2008) Preoperative C-reactive pro-tein as a prognostic and therapeutic marker for colorectal cancer. J Surg Oncol. Dec 1; 98(7):540–544.
doi:10.1002/jso.21154PMID:18937231
20. McMillan DC, Canna K, McArdle CS. Systemic inflammatory response predicts survival following cura-tive resection of colorectal cancer. (2003) Br J Surg. Feb; 90(2): 215–9. PMID:12555298
21. Walsh SR, Cook EJ, Goulder F, Justin TA, Keeling NJ. (2005) Neutrophil-lymphocyte ratio as a prog-nostic factor in colorectal cancer. J Surg Oncol. Sep 1; 91(3):181–4. PMID:16118772
22. Ropponen KM, Eskelinen MJ, Lipponen PK, Alhava E, Kosma VM. (1997) Prognostic value of tumour-infiltrating lymphocytes (TILs) in colorectal cancer. J Pathol. Jul; 182(3):318–24. PMID:9349235
23. Dolcetti R, Viel A, Doglioni C, Russo A, Guidoboni M, Capozzi E, et al. (1999) High prevalence of activated intraepithelial cytotoxic T lymphocytes and increased neoplastic cell apoptosis in colorectal carcinomas with microsatellite instability. Am J Pathol. Jun; 154(6):1805–13. PMID:
10362805
24. Menges T, Engel J, Welters I, Wagner RM, Little S, Ruwoldt R, et al. (1999) Changes in blood lympho-cyte populations after multiple trauma: Association with posttraumatic complications. Crit Care Med. Apr; 27(4):733–40. PMID:10321662
25. Ali AA, McMillan DC, Matalka II, McNicol AM, McArdle CS. (2004) Tumour T-lymphocyte subset infiltra-tion and tumour recurrence following curative resecinfiltra-tion for colorectal cancer. Eur J Surg Oncol. Apr; 30(3):292–5. PMID:15028311
26. Ko K, Park YH, Lee JW, Ku JH, Kwak C, Kim HH. (2013) Influence of nutritional deficiency on prognosis of renal cell carcinoma (RCC). BJU Int. Oct; 112(6):775–80. doi:10.1111/bju.12275PMID:24028765
27. Cubiella J, Castells A, Fondevila C, Sans M, Sabater L,Navarro S, et al. (1999) Prognostic factors in nonresectable pancreatic adenocarcinoma: a rationale to design therapeutic trials. Am J Gastroenterol. May; 94(5):1271–8. PMID:10235206
28. Niendorf A, Nagele H, Gerding D, Mayer-Pannwitt U, Gebhardt A. (1995) Increased LDL receptor mRNA expression in colon cancer is correlated with a rise in plasma cholesterol levels after curative surgery. Int J Cancer. May 16; 61(4):461–4. PMID:7759150
29. Notarnicola M, Altomare DF, Correale M, Ruggieri E, D'Attoma B, Mastrosimini A, et al. (2005) Serum lipid profile in colorectal cancer patients with and without synchronous distant metastases. Oncology. 68(4–6):371–4. PMID:16020965
31. Vitols S, Gahrton G, Bjorknoln M, Peterson C. (1985) Hypocholesterolemia in malignancy due to ele-vated low-density-lipoprotein receptor activity in tumor cells: Evidence from studies in patients with leu-kemia. Lancet. Nov 23; 2(8465):1150–4. PMID:2865616
32. Oliver MF. (1981) Serum cholesterol–the knave of hearts and joker. Lancet. Nov 14; 2(8255): 1090–5.
PMID:6118533