USE OF MATERNAL
AND CHILD
HEALTH
SERVICES AND
IMMUNIZATION
COVERAGE
IN PANAMA’
Carlos M. Huez~,~ Richard S. Monteith,3
Humberto
Naar,’ and
Leo Morris5
Panama is the first Latin Amenkan county where immunization data were collected during a national farnib planning and maternal-child health suroey. This article presents some of the maternal-child health and immunization re- sults that demonstrate the uyfulness of the information obtained.
Introduction
In 1979 a family planning and maternal- child health (FP/MCH) survey was conducted in Panama by the Population Studies Office of Panama’s Ministry of Health, with technical assistance from the Family Planning Evalua- tion Division of the U.S. Centers for Disease Control (1). This type of survey, conducted in several Latin American countries, has been useful in providing demographic and program data for the evaluation of family planning pro- grams (2). In addition to other types of infor- mation, the Panama survey also collected data on the immunization status of all children under six years of age-making Panama the only country in the Americas besides the United States that is known to have conducted a national immunization survey.
This article presents results of the Panama survey regarding mothers’ use of maternal
‘Also appearing in Spanish in the Boletin de lo Oficino
Sanitaria Panameficnna 93(3), 1982.
ZGuest Researcher, Program Evaluation Branch, Family Planning Evaluation Division, Center for Health Promotion and Education, United States Centers for Disease Control, Atlanta, Georgia; work supported by a grant from the Rockefeller Foundation and the CD& International Training Program in Family Planning Evaluation and Epidemiology.
3Program Analyst, Program Evaluation Branch, Fam- ily Planning Evaluation Division, Center for Health Pro- motion and Education, CDC.
&Chief, Maternal and Child Health and Family Planning Division. Ministrv of Health of Panama.
SChie?, Program Evaluation Branch, Family Planning Evaluation Division, Center for Health Promotion and Education, CDC.
and child health services and their children’s
immunization status. On the average, the
questionnaire used in the aforementioned Lat-
in American FP/MCH surveys has required
25 minutes of interview time to complete. The addition of an immunization module to the standard household form in the Panama sur- vey increased the total interview time by three to four minutes. A principal aim of the present article is to demonstrate the usefulness of the various kinds of information collected as part of this national household survey.
In Panama, as in many Latin American countries, health services are provided by the Ministry of Health, the Social Security Insti- tute, and private institutions. The overall ma- ternal and child care program is considered to include care of women during pregnancy, medical care during delivery, a postpartum
checkup, and well-baby care. Besides the
foregoing institutional care, some measure of health care is provided by traditional mid- wives who lack formal academic preparation.
Panama’s immunization program functions
as a routine service, with no mass campaigns.
The vaccines commonly recommended for
children under six years of age are tuberculo- sis (BCG); diphtheria, pertussis, and tetanus (DPT); poliomyelitis, and measles vaccines. The official recommendations on vaccination are contained in an immunization manual de- veloped jointly by the Ministry of Health and the Social Security Institute. The last revised edition was published in 1980 (3). Table 1
summarizes the immunization schedule rec-
ommended in this manual, which is similar to
330 PAHO BULLETIN l vol. 16, no. 4, 1982
Table 1. Panama’s scheme of immunization, as indicated in the 1980 immunization manual (3).
Vaccine Primary immunization
No. of doses Age at first dose Interval First booster
BCG 1 Newborn When child enters school
Polio 3 2 months Every 2 mos. 1 yr. after first dose
DPT 3 2 months Every 2 mos. 1 yr. after first dose
Measles 1 9 months At 15 mos. of agea
aRecommended if vaccine was given during the first year of life.
that recommended by the World Health Or- ganization (4).
Methodology
The survey design included two strata, ur- ban and rural. A total of 1,636 and 1,478 households, respectively, were included in these strata, bringing the total number of households in the survey sample to 3,114. The 1976 World Fertility Survey was used as the sampling frame with appropriate updating of household listings (5). Although fertility data were collected on all women 15-44 years of age living in the sample households, the main body of the questionnaire was administered to one woman selected with equal probability from all women 15-44 living in each house- hold. In addition, the household form of the
questionnaire included questions on immu-
nization, which were asked about all children under six years of age living in the sample households. Interviews were completed with 2,348 women (93 per cent of the total number of possible respondents). Information was also collected on the immunization status of 2,399 children under six years of age.
Results
Maternal and Child Health Services
All women in the sample, whether married or living in consensual union, who had had at least one live birth, were asked about the use of MCH services during their last pregnancy. Many said they received prenatal care during
their last pregnancy (80 per cent), delivered in a medical facility (84 per cent), received a postpartum checkup during the first month after delivery (67 per cent), and obtained well- baby care for their newborn children (89 per cent) (Table 2). The figure for postpartum checkups may be artificially low compared to the others, because women who had checkups after the first month of puerperium were not included.
Health ministry hospitals, health centers, and health posts were the main sources of MCH care. As Table 3 shows, the percent- ages of rural women using these health minis- try facilities for prenatal care (8 1 per cent) and well-baby care (89 per cent) were far higher than the percentages of urban women using these facilities (45 and 57 per cent, respective- ly). Conversely, far more urban women were using facilities of the Social Security Institute and private clinics.
Hue20 et al. l MCH SERVICES IN PANAMA 331
Table 2. Survey mothers’ use of medical facilities for various types of MCH care during their last pregnancy. The group studied included 1,413 women 15-44 years old,
married or living in consensual union at the time of the survey, who had had at least one live birth.
Use of medical
facilitiesa Prenatal
% receiving indicated type of MCH care
Childbirth postpmumb Well-babv
Yes 80.2 84.2 66.6 88.8
No 19.4 14.8 33.0 10.6
unknown 0.4 1.0 0.3 0.6
Total 100.0 100.0 100.0 100.0
%&ding health ministry, social security, and private facilities. bO”Iy during the fmt month after delivery.
Table 3. Sources of prenatal, childbirth, and well-baby care used by urban and rural survey mothersa 15-44 years old.
7% receiving indicated type of MCH care
Source of service Prenatal Childbirth Well-baby Urban R”Eil Urban Rl”-al Urban Rural mothers mothers mothers mothers mothers mothers
Health ministry hospital Health ministry center/post
(Health ministry subtotal)
Private physician or clinic Social Security Institute Midwife
Other Unknown
Total
No. of cases (unweighted)
6.3 14.6 61.9 38.9 66.5
(45.2) (81.1) (646:;)
30.4 7.3 13.1 22.4 9.4 14.6
- 3.2
1.9 0.2 2.2 0.1 2.2 0.2
100.0 100.0 100.0
(674) (484) (763) (650) (719) C-551) 59.1
9.9 (69.0)
1.4 5.0 20.4 2.3 1.8
100.0
9.6 20.6 47.4 68.2 (57.0) (88.8)
21.9 2.8 19.6 7.5
1.5
100.0
1.0
100.0
aWomen married or living in consensual union at the time of the survey who had had at least one live birth
At the same time, even though urban wom- it did record the month of pregnancy in which en were more likely than rural women to use the women received their first prenatal care. the social security and private institutions, Most women (73 per cent) started receiving many urban women who went to these institu- prenatal care during the first trimester of tions for prenatal care went to health ministry pregnancy, and an even higher share (83 per hospitals for delivery. This was probably due cent) of those attending private and social se- to economic considerations (because delivery curity facilities started receiving care in the care is more expensive than prenatal care) or first trimester (Table 4). Only 2 per cent of the to lack of social security or private delivery women received their first prenatal care dur-
facilities at some urban locations. ing the third trimester of pregnancy.
332 PAHO BULLETIN . vol. 16, no. 4, 1982
Table 4. Trimester when prenatal care began, by source of care, for the 1,158 survey mothers 15-44 years old who reported receiving prenatal care during their last pregnancy (see Table 3).
Months of gestation at time of first prenatal care
All mothers receiving prenatal care Health ministry hospa
Sources of prenatal care
Health Private Social ministry physician Security
center/post or ClinlC Institute Other
5 3 months 4 - 6 months 7 - 9 months Doesn’t remember
Total
No. of cases (unweighted)
72.7 70.5 66.7 83.1 82.9 61.5
23.8 26.3 29.3 13.8 15.8 23.1
2.2 0.8 2.9 2.4 0.8 0.0
1.4 2.3 1.1 0.8 0.6 15.4
100.0 100.0 100.0 100.0 100.0 100.0
(1,158) (110) (58-T (231) (205) (27)
natal, postpartum, and well-baby care) (Table 5); only 7 per cent did not receive any of these services. The percentages using the three ser- vices were higher for urban women, for wom- en with higher levels of education and income, for women currently working, and for those who had their last delivery of a live infant at a medical facility, especially a private hospital or clinic.
Besides those using all three services or no services, a third of the women surveyed used one or two of the three MCH outpatient ser- vices. These women had visited a medical fa- cility at least once in connection with their last pregnancy, and there had been an opportuni- ty at that time to make them more aware of the importance of using all three MCH ser- vices.
It was also found that the tendency to use all three outpatient services was higher in the middle age groups (25-29 years and 30-34 years), and lower in both the younger and older age groups (Figure 1). Mothers with one or two living children were most apt to have used all three MCH services (Figure 2). Ac-
cording to these data, Panamanian women
who are multiparous or whose age places them at one extreme or the other of reproductive life are less likely than others to use all three MCH services, even though such women run a higher risk that their pregnancy will have an adverse outcome.
Sixty-one per cent of the sample’s married
Table 5. Percentages of 1,413 survey mothers 15-44 years old (married or living in consensual union) who
used no MCH services or all three types of MCH services (postpartum, childbirth, and well-baby
care) during their last pregnancy, by selected characteristics.
Selected characteristics of survey mothers
% of mothers % of mothers using all not using three services any service
Area of residence: Urban RUl-al
Education:
<Primary complete Primary complete
> Primary complete Monthly family income:
First quartile Second quartile Third quartile Fourth quartile Employment status
Currently working Not working Source of care at last live
delivery:
Private hospital or clinic Social Security Institute
facility
Health Ministry hospital or center
Other Midwife
Total (N = 1,413)
68.4 2.8
52.5 9.0
47.3 11.9
54.3 6.7
75.0 0.8
45.6 11.6
62.2 2.5
67.1 4.2
74.5 2.9
73.2 3.4
55.5 6.9
83.0 1.0
70.7 0.8
63.8 2.3
43.9 23.8 22.9 30.2
59.8 6.8
women 15 to 44 years of age were using a con- traceptive method at the time of the survey.
(1). Women who received MCH care during
Huezo et al. l MCH SERVICES IN PANAMA 333
Figure I. Women using all three types of MCH
services, by age group. The survey sample
included all women 15-44 years old who were married or living in a consensual union at the time of the 1979 survey,
and who had had at least one live birth.
1 I I I ! 1
15-19 20.24 25-29 30.34 35-39 40.44 AGE GROUP (IN YEARS)
Figure 2. Women using all three types of MCH services, by number of living children. The
survey sample included all women 15-44 years old who were married or living in
a consensual union at the time of the survey, and who had had at least
one live birth.
7Or
TI:
40 -
I+
NUMBER OF LIVING CHILDREN
use a contraceptive method, and this was
especially true of those who received all three outpatient services. In all, 75 per cent of those who received all three services were using a contraceptive method, as compared to 23 per cent of those who received no services (Table 6). This implies that factors affecting the use of MCH services may also affect the use of family planning services.
Table 6. The percentages of survey mothers married
or living in consensual union who were practicing
contraception at the time of the survey, by type of MCH care received during the last pregnancy.
(The 936 respondents were 15-44 years old
and had had at least one live birth.)
Types of MCH
services received
No. of % currently
women
(unweighted)
using
contraception
None Prenatal only Postpartum only Well-baby only Prenatal + postpartum
OdY
Postpartum + well-baby OdY
Prenatal + well-baby OdY
All services
4.5 22.9
21 -a
3 -a
45 44.2
10 -a
41 52.2
123 55.8
648 74.7
aNo percentage is given because the total number of women was less than 25.
The survey revealed that almost all children who had received primary immunization were vaccinated by age two (Figure 3). As Table 7 indicates, most children one to five years of
age had received complete primary immu-
nization with BCG, poliomyelitis, DPT, and measles vaccines. The percentages were high- er for urban than for rural children. They also
Figure 3. Percentages of survey children under six years of age receiving complete primary
BCG, poliomyelitis, DPT, and measles immunizations.
80
r
BCG-
334 PAHO BULLETIN . vol. 16, no. 4, 1982
Table 7. Percentages of 1,931 survey children l-5 years of age receiving BCG, complete poliomyelitis, complete DPT, and measles immunization, by area of residence
and monthly family income.
Immunization Total
Area of residence
Urban Rural
Monthly family income, by quartiles
First Second Third Fourth quartile quartile quartile quartile
BCG 55.3 62.1 50.8 53.6 56.7 64.5 63.0
Poliomyelitis 62.8 66.8 60.0 57.9 65.5 70.7 65.2
DPT 61.0 66.9 57.1 57.0 60.5 72.0 65.1
Measles 67.3 72.6 64.0 63.8 70.4 76.3 69.8
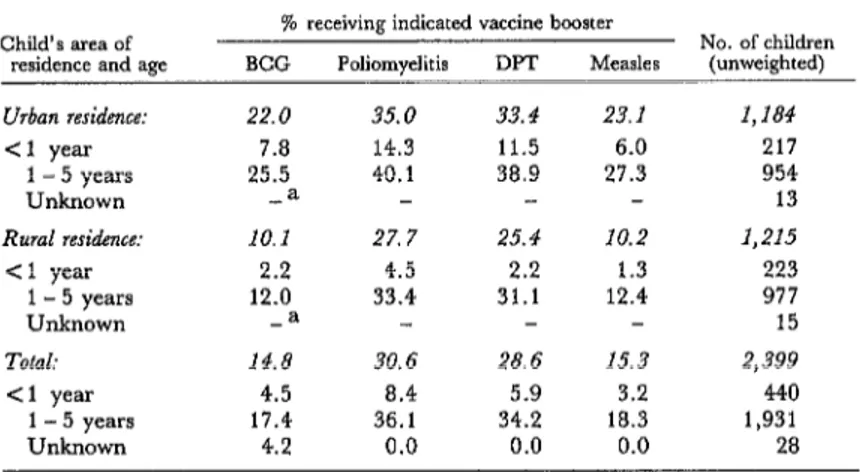
Table 8. Percentages of survey children receiving booster doses of BCG, poliomyelitis, DPT, and measles vaccines, by age and area of residence.
Child’s area of residence and age
Urban residence: <1 year
1 - 5 years
Unknown
Rural residence: <l year
1 - 5 years Unknown
Total:
Cl year
1 - 5 years
Unknown
% receiving indicated vaccine booster
No. of children BCG Poliomyelitis DPT Mea&s (unweighted)
22.0 35.0 33.4 23.1 1,184
7.8 14.3 11.5 6.0 217
25.5 40.1 38.9 27.3 954
-a 13
10.1 27. 7 25.4 10.2 1,215
2.2 4.5 2.2 1.3 223
12.0 33.4 31.1 12.4 977
-a 15
14.8 30.6 28.6 15.3 2,399
4.5 a.4 5.9 3.2 440
17.4 36.1 34.2 18.3 1,931
4.2 0.0 0.0 0.0 28
aNo percentage given because foe few (less than 25) children were in the indicated category.
increased as the monthly income of the child’s family rose, but these percentage increases were only observed up to the third income quartile of the sample.
Ordinarily, one would not expect a child under one year of age to receive booster doses of any of the vaccines, but the survey data show that a small percentage of children under one year of age were said to have received booster shots (Tables 8 and 9). These children tended to live in urban areas and to come from higher-income families. For example, 11.5 per cent of the urban children under one year of age were said to have received booster doses of DPT vaccine, while only 2.2 per cent of the rural children were said to have done so. Likewise, 12.7 per cent of the children from families in the highest income quartile re-
portedly received a DPT booster before age one, while only 2.5 per cent of those in the lowest income quartile were said to have done so. The survey did not collect data about the place of vaccination, but we can assume that the source of vaccination would frequently be the same as that of well-baby care. Children under one year of age who received well-baby care in private medical facilities were more likely to have received booster shots than those who received their well-baby care in public facilities (Table 10).
Discussion
MCH Services
Huezo et al. l MCH SERVICES IN PANAMA 335
Table 9. Percentages of survey children receiving booster doses of BCG, poliomyelitis, DPT, and measles vaccines, by age and family income.
Child’s age and family’s monthly income
% receiving indicated vaccine booster
No. of children BCG Poliomyelitis DPT Measles (unweighted)
First quartile: 14.6 < 1 years 1.2
1 - 5 years 17.6
Unknown -a
24.4 25.4 14.8
2.5 2.5 1.2
29.4 30.6 17.9
482 87 392 3
Second quartile: 14.4 31.1 29.4 16.0 532
Cl year 5.0 6.8 6.8 3.6 89
1 - 5 years 16.6 36.6 34.5 18.8 436
Unknown -= 7
Third quartile: 17.1 38.3 33.7 18.0 386
< 1 year 2.6 11.2 5.3 1.3 66
I-5years 20.6 44.9 40.5 21.9 314
Unknown -= 6
Fourth quartile: 21.2 35.9 34.4 21.9 403
Cl year 9.2 16.7 12.7 5.8 81
1 - 5 years 24.6 41.3 40.5 26.4 317
Unknown -= 5
=No percentages given because too few (less than 25) children were in the indicated category.
Table 10. Percentages of survey children less than one year of age receiving booster doses of BCG, poliomyelitis, DPT, and measles vaccines,
by source of well-baby care.
Source of well-baby care
No well-baby care Health Ministry hospital Health Ministry center
or post
Social Security Institute facility
Private facility
% receiving indicated vaccine booster
No. of children BCG Poliomyelitis DPT Measles (umveighted)
2.9 4.3 3.6 1.4 110
1.8 8.7 6.1 4.3 43
4.4 8.2 5.8 2.2 196
2.7 11.6 4.5 4.5 49
17.8 20.3 17.8 12.7 38
ma, thereby providing an index of good pro- tection for the mother and child. The survey data also reveal trends in the use of MCH ser- vices according to various sociodemographic characteristics of the mother-such as area of residence (urban or rural), family income, education, work status, age, and number of living children. This knowledge can prove useful in orienting programs, assigning re- sources, and defining goals. For example, although the survey found good coverage of the general population, it also showed a need
to achieve more penetration of rural and low- income populations.
The relatively low use of MCH services by women whose age or parity places them at higher risk during pregnancy clearly shows that the program should promote more fre- quent use of those services as well as family planning services by these high-risk groups.
336 PAHO BULLETIN l vol. 16, no. 4, 1982
service for cultural, geographic, and economic reasons, it is important that health institutions maintain close contact with them and provide them with training, with equipment, and with knowledge of facilities where they can refer patients.
The widespread use of contraceptive meth- ods among users of MCH services is believed to arise from the fact that MCH and family planning services are closely related. Both ser- vices have the same basic objective-to pro- vide better health conditions for the child and mother with the aim of obtaining social bene- fits. It is also true that a woman can learn about MCH services in a family planning clinic and can learn about family planning ser- vices during MCH visits.
Immunization Coverage
The survey data also indicate that Pana-
ma’s immunization program has been pro-
viding good coverage. Table 11 compares the immunization status of the Panamanian sur- vey children one through five years of age with survey data obtained from the United States (6). This comparison indicates that the levels of immunization in the two countries are simi-
lar. Furthermore, even though the Panama
survey showed coverage levels to vary with place of residence, family income, and type of vaccine, the observed differences were small.
The high numbers of booster doses reported for children under one year of age could be due to excessive vaccine use or to a misreport-
Table 11. Percentages of the Panama survey children (1-5 years old) and U.S. children (1-4 years old)
receiving complete primary poliomyelitis, DPT, and measles immunizations.
% of children vaccinated Immunization
Panamaa USAb
Poliomyelitis 62.8 (60.2 - 65.4) 61.4 DPT 61.0 (58.3 - 63.7) 68.0 Measles 67.3 (64.7 - 69.9) 62.8
aThe figures in parentheses are 95 per cent confidence limits that include the estunated design effect.
knited States Immunization Survey, 1978 (6).
ing of the number of doses received. The in- formation in question was recorded from vac- cination certificates when these were avail- able; when such certificates were not avail- able, the information was obtained from an adult respondent in the household. The source of information (vaccination certificate or adult respondent) was not recorded, so it is not known what proportion of the responses were obtained from vaccination certificates. It is
certainly possible that respondents exag-
gerated the number of booster doses received by children living in their households. How- ever, the percentage of children said to have received boosters before their first birthday
was markedly higher among children from
high-income urban families and among those who received well-baby care in private medi- cal facilities, and these findings tend to argue against respondent error.
Comparison of Survey and Program Data
on Immunization
The 1978 PAHO report entitled “Status of Immunization Programs in the American Re- gion” (7) compares the vaccination coverage of children under one year of age in different countries of the Americas. Because this source
provides program immunization data for
children under one year of age in Panama, our comparison focuses on that age group.
Hue20 et al. l MCH SERVICES IN PANAMA 337
od before the survey should have received complete primary vaccination; so only 50 per cent of the children in the denominator are “eligible.” Similarly, Panama’s official rec-
ommendations state that measles vaccine
should be given at nine months of age; this means that only children born in the first three months of the twelve-month period before the survey should have been vaccinated; and so only 25 per cent of the children in the denomi- nator are “eligible.” (Of course, this percent- age of “eligibility” assumes that only routine vaccination has been carried out, and that
there have been no mass campaigns that
might have vaccinated children below the
recommended age.)
To surmount such problems, the survey da- ta can be analyzed excluding children outside the eligible age groups. For example, the Pan- ama survey data were adjusted to study DPT and poliomyelitis vaccination of children 6- 11 months of age and measles vaccination of children 9- 11 months of age. (As already not- ed, there have been no mass campaigns in
Panama.) If these adjustments were not
made, the data would show artificially lower rates of vaccination for children less than one year of age, as may be seen in the first column of Table 12.
Hypothetically, we would expect that the percentages of eligible children receiving a complete series of DPT, poliomyelitis, and measles immunizations would be, respective- ly, two, two, and four times the percentages found for all children under one year of age. However, as already mentioned, despite the
lack of mass campaigns some children were said to have completed one or another prima-
ry immunization series before the recom-
mended age. In each case, the number of
children involved was known (e.g., about 6 per cent of those under six months old were reported to have received a complete series of
poliomyelitis and DPT immunizations, and
about 15 per cent of those under nine months old were reported to have received a measles vaccination); and so in each case the percent- age of eligible children said to have received a complete immunization series could be de- termined.
Analyzing vaccination program data re-
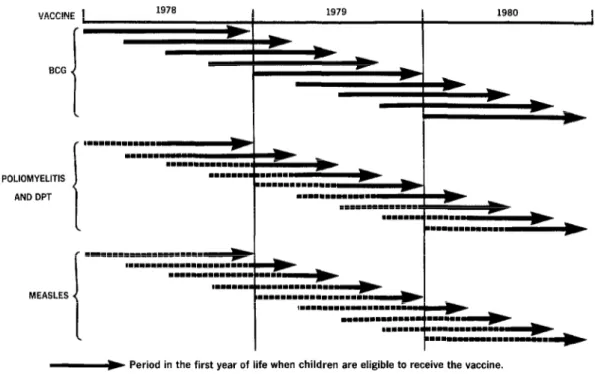
quires a different approach. It is possible to estimate the percentage of children in a specif- ic age group that received primary immuniza- tion during a given period of time, usually a calendar year. In this case, the denominator is generally the midyear population estimate of the age group in question, and the numerator represents the number of immunizations giv- en to children in that age group. For children under one year of age, the eligible population is actually a cohort of children born during the same and the previous year. And as Figure 4 shows, the size of this cohort does not depend on the length of time (three months or six months) that the children are of proper age for
completion of primary immunization. In
other words, 100 per cent of the children in the denominator are eligible.
This means it is not possible to directly compare the information obtained from the Panama survey with that from the vaccination
Table 12. Percentages of the Panama survey children less than one year old receiving complete primary BCG, poliomyelitis, DPT, and measles immunizations.
“Eligible” childrena Unweighted No. of Immunization All children < 1 year old < 1 year old “eligible” childrena
BCG 34.6 (29.0 - 40.2)b 34.6 (29.0 - 40.2)b 440
Poliomyelitis 23.5 (18.6 - 28.4) 39.2 (31.5 - 46.7) 230
DPT 23.8 (18.9 - 28.7) 40.1 (32.3 - 47.9) 250
Measles 23.0 (18.2 - 27.8) 44.4 (33.7 - 55.1) 125
a“Eligible” children: for BCG vaccine, all children in the sample; for poliomyelitis and DPT vaccines, all children 6-l 1 months old; for measles vaccine, all children 9-11 months old.
338 PAHO BULLETIN l vol. 16, no. 4, 1982
Figure 4. Cohorts (shown at three-month intervals) of children less than one year old who would be
considered “eligible” to have received complete primary immunization with BCG, poliomyelitis
and DPT, or measles vaccine administered as part of a continuous program, according to the recommendations of Panama’s 1980 immunization manual (3).
VACCINE 1 1978 1979 1980
1
BCG
POLIOMYELITIS
AND DPT
MEASLES
-w Period in the first year of life when children are eligible to receive the vaccine.
==m====m===*==m Period in the first year of life when children are not eligible to receive the vaccine.
program -because the survey finds the per- centage of children protected by the vaccine at a point in time, while the program data shows the percentage of a particular cohort of children vaccinated over a one-year period. Nevertheless, some rough indirect compari- sons can be made.
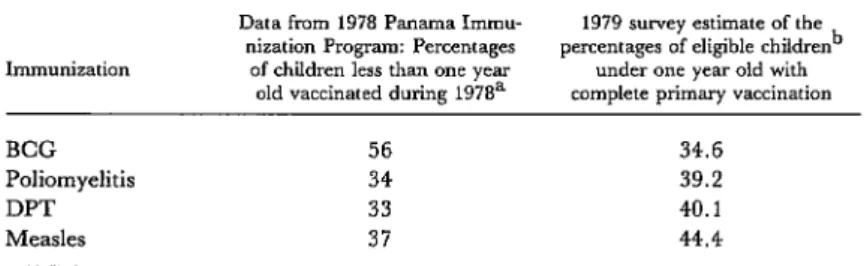
For example, Table 13 shows that 56 per cent of the Panamanian children under one year of age received BCG immunization dur- ing 1978 according to program data, while the survey data indicate that some 35 per cent of the children under one year of age had been vaccinated at the time of the survey in 1979. BCG vaccination is given at birth while the child is in the nursery. It is thus logical that the program data should show higher cover- age than the survey data, since some mothers may not have known that their children were given BCG vaccine in the hospital.
Similarly, the program data show that
about a third of the Panamanian children under one year of age were reported to have received a primary series of poliomyelitis or
DPT immunizations during 1978, while the
survey data indicate that 39 and 40 per cent, respectively, of the eligible children six to 11 months of age had received complete polio- myelitis and DPT vaccinations at the time of the survey in 1979. The survey data also show a greater percentage of eligible children vac- cinated against measles, perhaps because the survey measured private sector vaccinations as well as the vaccinations provided through the public program.
Huezo et al. l MCH SERVICES IN PANAMA 339
Table 13. An indirect comparison between the 1979 Panama survey data and the 1978 Panama Immunization Program data regarding complete primary
immunization of children less than one year old.
Immunization
BCG
Poliomyelitis
DPT
Measles
Data from 1978 Panama Immu- 1979 survey estimate of the nization Program: Percentages percentages of eligible children’
of children less than one year under one year old with old vaccinated during 1978a complete primary vaccination
56 34.6
34 39.2
33 40.1
37 44.4
aSource: PAHO, EPI Newsletter (7).
b’6Eligible” chddren: for BCG vaccine, all children in the sample; for poliomyelitis and DPT vaccines, all children 6-11 months old; for measles vaccine, all children 9-11 months old.
will be possible to calculate the proportion of age achieved five years ago. Such survey data children more than one year old who received could thus provide more than just information complete primary immunization during their about the prevalence of vaccination at some first year of life. Such data would also permit point in time; they could also yield informa- one to estimate the proportion of children one tion about program coverage that could be to five years of age who received complete im- compared with data obtained from the vacci- munization during their first year of life, and nation program itself; and they could be used to measure the program coverage achieved in computing rates of disease in the unvac- among children under one year of age during cinated and vaccinated populations, so that a each of the past five years. For example, we measure of what the vaccine’s effectiveness would be able to compare the program cover- would be in the event of a disease outbreak age achieved the previous year with the cover- could be determined.
SUMMARY
In 1979 a survey was conducted in Panama to de- termine how much various maternal and child health and family planning services were being uti- lized and how well the country’s immunization pro- gram was providing coverage for young children. A total of 3,114 households were surveyed, 1,636 of these being considered urban and 1,478 being con- sidered rural. At each eligible household, a woman 15-44 years old was sought as the respondent, and the main body of the survey questionnaire was ad- ministered to her. In all, responses were obtained from 2,348 women.
Nearly all the women who were married or living in consensual union at the time of the survey said they had used maternal and child health (MCH) services during their last pregnancy. Eighty per cent said they received prenatal care, 84 said they delivered their child at a medical facility, 67 per
cent said they received a postpartum checkup with- in a month of delivery, and 89 per cent said they obtained well-baby care for their newborns. The Health Ministry’s hospitals, health centers, and health posts were the main sources of this care. However, the survey also showed a need to extend MCH services to rural and low-income popula- tions, and to promote better coverage by MCH and family planning services for women whose youth, age, or parity placed them in high-risk groups.
340 PAHO BULLETIN l vol. 16, no. 4, 1982
children under one year old could have been due to comparison of this sort could be made if planned excessive vaccine use or to misreporting of the future surveys record each child’s date of birth and number of doses received. Direct comparison of the dates when each primary vaccination or series these survey data with data from the national im- of primary vaccinations was completed.
munization program is not possible, but a useful
REFERENCES
(1) Monteith, R. S., J. E. Anderson, F. Mas- carin, and L. Morris. Contraceptive Use and Fer- tility in the Republic of Panama. Stud Fam Plann 12(10):331-345, 1981.
(2) Morris, L. The Use of Contraceptive Preva- lence Surveys to Evaluate Family Planning Pro- grams in Latin America. In 1979 Proceedings of the Social Statistics Section of the American Statistical Associa- tion. Washington, D. C., 1980, pp. 543-548.
(3) Panam& Ministerio de Salud y Caja de1 Seguro Social. Manual de inmunizackin de Panama. Panama City, 1980.
(4) World Health Organization. Guides to Assist
Countries and Regions in Preparing Manuals of Operation for Use in Immunization Programs. Geneva, 1977.
(5) Panam& Ministerio de Salud. Infom final de la encuesta national de fecund&d de 1976. Panama City, 1977.
(6) United States Public Health Service, Center for Disease Control. United States Immunization Survey: 1978. Atlanta, Georgia, 1979.
(7) Pan American Health Organization. Status of immunization programs in the American region. EPI Newsletter 2(1):4-5, February 1980.
HEPATITIS SURVEILLANCE IN THE UNITED STATES
In the United States, hepatitis A morbidity reported for the two-year period October 1978 to November 1980 remained essentially the same as that reported from 1977 to 1978. Hepatitis B morbidity, however, in- creased during the same period, with increases being seen in the Middle Atlantic States (10 per cent), South Atlantic States (22 per cent), West South-Central States (12 per cent), and Pacific States (7 per cent). The case rates reported by the West North-Central States decreased by 10 per cent. An upward trend was also noted for hepatitis of unspecified etiology, the level of morbidity being notably higher at the end of the reporting period than at the beginning.
Nationally, the case rates per 100,000 reported for 16 October-11 No- vember 1978 were 1.1 cases of hepatitis A, 0.5 cases of hepatitis B, and 0.4 cases of unspecified etiology. The case rates per 100,000 reported for 11 October-8 November 1980 were 1.1 cases of hepatitis A, 0.7 cases of hepa- titis B, and 0.5 cases of unknown etiology.