www.soil-journal.net/1/641/2015/ doi:10.5194/soil-1-641-2015
© Author(s) 2015. CC Attribution 3.0 License.
SOIL
Assessing the performance of a plastic optical fibre
turbidity sensor for measuring post-fire erosion from plot
to catchment scale
J. J. Keizer1, M. A. S. Martins1, S. A. Prats1, L. F. Santos1, D. C. S. Vieira1, R. Nogueira2, and L. Bilro2 1Earth surface processes team, Centre for Environmental and Marine Studies (CESAM),
Dept. Environment and Planning, University of Aveiro, Campus Universitário de Santiago, 3810-193 Aveiro, Portugal
2Instituto de Telecomunicações, Aveiro (IT-Aveiro), Campus Universitário de Santiago,
3810-193 Aveiro, Portugal
Correspondence to: J. J. Keizer ([email protected])
Received: 13 April 2015 – Published in SOIL Discuss.: 11 May 2015 Accepted: 1 September 2015 – Published: 24 September 2015
Abstract. This study is the first comprehensive testing of a novel plastic optical fibre turbidity sensor with runoff samples collected in the field and, more specifically, with a total of 158 streamflow samples and 925 overland flow samples from a recently burnt forest area in north-central Portugal, collected mainly during the first year after the wildfire, as well as with 56 overland flow samples from a nearby long-unburnt study site. Sediment concentrations differed less between overland flow and streamflow samples than between study sites and, at one study site, between plots with and without effective erosion mitigation treatments. Maximum concentrations ranged from 0.91 to 8.19 g L−1 for the micro-plot overland flow samples from the six burnt sites, from 1.74 to 8.99 g L−1for the slope-scale overland flow samples from these same sites, and amounted to 4.55 g L−1for the streamflow samples. Power functions provided (reasonably) good fits to the – expected – relationships of increasing normalized light loss with increasing sediment concentrations for the different sample types from individual study sites. The corresponding adjusted R2values ranged from 0.64 to 0.81 in the case of the micro-plot samples from the six burnt sites, from 0.72 to 0.89 in the case of the slope-scale samples from these same sites, and was 0.85 in the case of the streamflow samples. While the overall performance of the sensor was thus rather satisfactory, the results pointed to the need for scale of site-specific calibrations to maximize the reliability of the predictions of sediment concentration by the POF (plastic optical fibre) sensor. This especially applied to the cases in which sediment concentrations were comparatively low, for example following mulching with forest residues.
1 Introduction
Wildfires are now widely recognized as a potential driver of conspicuous changes in geo-morphological and hydrologi-cal processes, through their direct effects on vegetation, lit-ter layer and topsoil (Shakesby, 2011; Moody et al., 2013). Studies across the globe have shown strong and sometimes extreme responses in runoff and erosion in recently burnt ar-eas, especially during the earlier stages of the so-called “win-dow of disturbance” (e.g. Cerdà, 1998; Lane et al., 2006;
Ro-bichaud et al., 2007). Nonetheless, important research gaps remain with respect to wildfire impacts on runoff and espe-cially soil erosion, in part due to the relatively limited num-ber of post-fire erosion studies as compared to erosion stud-ies in agricultural areas (Shakesby, 2011). The latter is well-illustrated by the four studies that appear to have been carried out in the Mediterranean Basin on sediment yields from re-cently burnt catchments (Lavabre and Martin, 1997; Inbar et al., 1998; Mayor et al., 2007; Keizer et al., 2015). Clearly, more studies have been published on post-fire erosion at the
plot-to-slope scale in the Mediterranean Basin (e.g. Thomas et al., 1999; Fernández et al., 2007; Prats et al., 2014). How-ever, they have typically addressed soil losses with a rela-tively coarse temporal resolution, i.e. multiple runoff events, which is hampering further insight in underlying sediment transport processes.
The advantages of employing turbidity sensors in erosion studies has been increasingly recognized since their introduc-tion more than 2 decades ago (Downing, 2006). Nonetheless, commercially available turbidity sensors such as the OBS-3+ Suspended Solids and Turbidity Monitor (© Campbell) typically require complex installations, extensive calibration to local conditions, and, perhaps most importantly, consider-able financial resources for their purchase. Fibre optical tur-bidity sensors and, in particular, those using plastic optical fibres (POFs) are now widely viewed to offer various impor-tant advantages over traditional methods of sensing (Zien-mann et al., 2008). POF sensors are not only comparatively inexpensive but also easy to handle, immune to electromag-netic interferences, and can easily be used in multi-sensor schemes (Yeo et al., 2008). This would, amongst other ad-vantages, allow for continuous in situ recording of sediment concentrations in plot-scale studies and to reduce substan-tially laboratory efforts by substituting standard methods for at least a large part of the runoff samples.
Over the past decade, various authors (Ruhl et al., 2001; Campbell et al., 2005; Postolache et al., 2007) have obtained promising results in measuring turbidity of aqueous solutions with POF sensors. Nonetheless, in their review study, Omar and MatJafri (2009) identified the need for more extensive testing, in particular also with respect to the dependence on particle size. Therefore, this study aimed at further testing the performance of the POF sensor developed by Bilro et al. (2010), which had provided promising results for contrast-ing suspended materials, includcontrast-ing ashes from recently burnt areas (Bilro et al., 2011). More specifically, this study tried to (i) assess the performance of this sensor for measuring the sediment concentration in post-fire runoff generated during the initial stages of the window of disturbance, when erosion rates are expectedly highest; (ii) evaluate if sensor perfor-mance differed for streamflow and for overland flow from erosion plots with contrasting runoff areas (micro-plots vs. slope-scale plots) and, thus, potentially different erosion pro-cesses (inter-rill erosion vs. rill/gully erosion); and (iii) deter-mine if sensor performance depended on land cover, parent material and site-specific conditions. This study was envis-aged as an important step towards the development of a com-mercial version of the sensor designed by Bilro et al. (2010).
2 Study area and sites
This study was carried out near the hamlet of Ermida in the Sever do Vouga municipality of north-central Portugal (Fig. 1). The area was burnt by a wildfire that took place
be-Figure 1.Location of the study area, the experimental catchment and the seven study sites (A: burnt eucalypt plantation on granite; B, D, E and S: burnt eucalypt plantations on schist; C: burnt pine plantation on schist; F: long-unburnt eucalypt plantation on schist).
tween 26 and 28 July 2010 and that affected some 300 ha (DUDF, 2011). By the time of the fire, the area was mainly covered by plantations of eucalypt (Eucalyptus globulus
La-bill.) but did include some plantations of maritime pine (Pi-nus pinaster Ait.). The severity of the wildfire (sensu Keely,
2009) was assessed in the field using as indicators ash colour as well as degree of tree crown scorching and of litter layer consumption, following Shakesby and Doerr (2006) and prior studies in the region such as Malvar et al. (2011, 2013). At all six study sites selected within the burnt area (Fig. 1), fire severity was classified as moderate. During the winter of 2010/11, the central part of the study area was bench ter-raced using a bulldozer, affecting three of the study sites (the terraces are clearly visible in Fig. 1).
The climate of the study area can be classified as humid meso-thermal (Csb, according to the Köppen classification), with moderately dry but extended summers (DRA-Centro, 1998). The parent material in the study area mainly con-sisted of pre-Ordovician schists but included Hercynian gran-ites at some locations, as is typical for the Hesperic Mas-sif (Ferreira, 1978). The soils were mapped, at a scale of 1 : 1 000 000, as predominantly Humic Cambisols (Cardoso et al., 1971, 1973). However, field descriptions of soil pro-files at the various study sites suggested a prevalence of Lep-tosols (WRB, 2006) (see Machado et al., 2015; Martins et al., 2013). Soil texture of the A horizon was also determined in the field and was slightly coarser for the soils on granite (sandy loam) than for the soils on schist (sandy clay loam). The topsoil was very rich in organic matter, amounting to 20–30 % at 0–2 cm depth (Machado et al., 2015) and 8–11 % at 0–5 cm depth (Prats et al., 2014).
Within the burnt area, a total of six study sites were se-lected to study post-fire runoff and erosion (Fig. 1; Table 1).
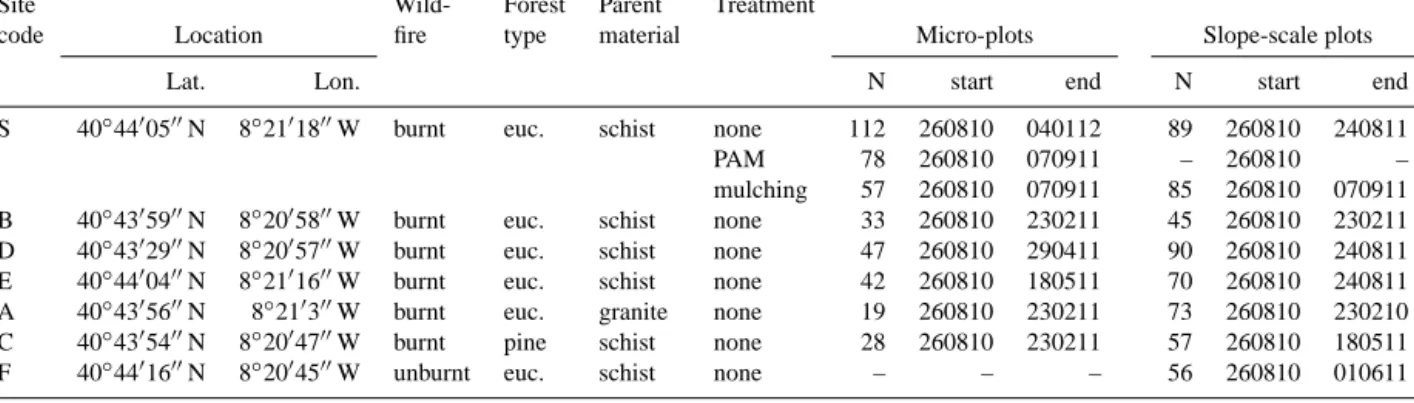
Table 1.General information about the seven study sites as well as the numbers of runoff samples from micro-plots and slope-scale plots analysed from each site and the start and end dates of collecting these samples (in ddmmyy).
Site Wild- Forest Parent Treatment
code Location fire type material Micro-plots Slope-scale plots
Lat. Lon. N start end N start end
S 40◦4400500N 8◦2101800W burnt euc. schist none 112 260810 040112 89 260810 240811
PAM 78 260810 070911 – 260810 –
mulching 57 260810 070911 85 260810 070911 B 40◦4305900N 8◦2005800W burnt euc. schist none 33 260810 230211 45 260810 230211 D 40◦4302900N 8◦2005700W burnt euc. schist none 47 260810 290411 90 260810 240811 E 40◦4400400N 8◦2101600W burnt euc. schist none 42 260810 180511 70 260810 240811 A 40◦4305600N 8◦210300W burnt euc. granite none 19 260810 230211 73 260810 230210 C 40◦4305400N 8◦2004700W burnt pine schist none 28 260810 230211 57 260810 180511 F 40◦4401600N 8◦2004500W unburnt euc. schist none – – – 56 260810 010611
They consisted of four eucalypt plantations on schist (sites B, D, E, and S), one eucalypt plantation on granite (site A) and one pine plantation on schist (site C), basically following the incidence of these land cover–parent material combinations in the burnt area. In addition, a long-unburnt eucalypt planta-tion was selected in the immediate vicinity of the burnt area (site F). Furthermore, one of the catchments within the burnt area was selected for studying the hydrological and erosion response at the catchment scale.
3 Materials and methods
3.1 Experimental set-up and collection of runoff samples
Five of the six study sites within the burnt area – i.e. ex-cept site S – were divided in three adjacent strips running from the base to the top of the slope (section) (Machado et al., 2015; Martins et al., 2013). In one of these strips, either three bounded micro-plots (0.25–0.30 m2) were in-stalled at the slope’s base (sites A, B and C, for being lo-cated within the catchments and therefore to minimize dis-turbance) or two pairs of such micro-plots were installed at the base and halfway up the slope (sites D and E). In another strip, one (un-)bounded slope-scale plot with a width of ap-proximately 2 m and contributing areas exceeding 50 m2, de-pending on slope length, was installed. Each slope-scale plot, however, comprised four outlets that were connected to dif-ferent runoff-collecting tanks. Site S involved a more elab-orate experimental design, as it had been selected to assess the effectiveness of two treatments to reduce soil erosion, i.e. mulching with forest residues and application of a dry gran-ular anionic polyacrylamide (PAM; Prats et al., 2014, 2015). Polyacrylamides have been found to markedly reduce soil losses from agricultural fields and road embankments (Ben-Hur, 2006). Four triplets of the above-mentioned micro-plots were installed from the base to the top of slope S to assess the effectiveness of both treatments. Furthermore, two bounded slope-scale runoff plots of 4 m width by 20–25 m length were
installed to assess the effectiveness of mulching with for-est residues. The unburnt site, on the other hand, involved a simpler experimental design as it was relatively narrow and could only be divided in two strips. Therefore, it was only in-strumented with an unbounded slope-scale plot as described above.
The runoff from the micro-plot and the individual outlets of the slope-scale plots was collected in tanks of 30 and 80– 500 L, respectively. Runoff volume in the tanks was mea-sured and runoff samples were collected in 1.5 L bottles, fol-lowing intensive stirring of the water in the tanks. This was done at 1–2-weekly intervals, depending on rainfall, starting at the end of August 2010 when the site instrumentation had been completed.
The outlet of the experimental catchment was instru-mented with a hydrological station comprising two flumes, two water level recorders and an automatic sampler that was triggered by a data logger based on the readings of the two water level recorders.
3.2 Laboratory analysis of runoff samples
For this study, a total of 1139 runoff samples were analysed, of which 158 concerned streamflow, and 565 and 416 over-land flow at the slope and micro-plot scale, respectively. The distribution of the latter samples over the different sites is given in Table 1. The samples were collected during the first year after the wildfire, as further detailed in Table 1, except for 36 micro-plot samples that were collected at the S site between the end of October 2011 and early January 2011.
The sediment concentration of these samples was deter-mined in the laboratory using the classic filtration method (APHA, 1998), employing filter paper with a pore diameter of 12–14 µm and drying the filters in an oven at 105◦C for 24 h. Furthermore, the organic matter content of the filtered sediments was determined using the loss-on-ignition method, placing the filters in a muffle for 4 h at 550◦C.
For each of the runoff samples, the normalized loss of the transmitted light – i.e. the ratio of the loss of light
transmit-1 Sediment concentration (gL-1) Sediment concentration (gL-1)
Normalized light loss Normalized light loss
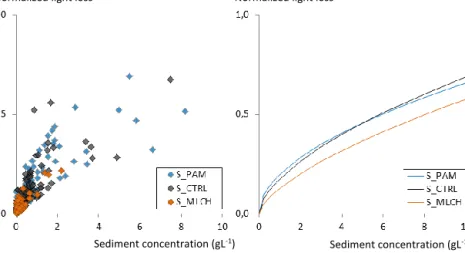
Figure 2.Relationships of sediment concentration with normalized light loss at the micro-plot scale for three treatments at study site S (left plot) and the corresponding best-fitting power functions (right plot; see Table 2). S_PAM: polyacrylamide; S_CTRL: untreated; S_MLCH: mulching with forest residues.
ted through a runoff sample and transmitted through a ref-erence sample of bi-distilled water – was determined using the POF turbidity sensor presented by Bilro et al. (2010) but with a slightly modified design of the sensor head. To this end, the sensor head was first placed within a plastic recip-ient with bi-distilled water to measure the reference signal and then within a second recipient with the runoff sample to measure the light loss due to the sediments that were being kept in suspension by means of a magnetic agitator. The mea-surements were carried out during a period of 1 min, during which the POF sensor performed 120 readings. Following visual inspection for and possible elimination of anomalous readings, the average values of both sets of readings were then used to compute the normalized transmitted light loss.
3.3 Data analysis
The sediment concentrations of the runoff samples from the micro-plots and the slope-scale plots were tested for signifi-cant differences, at α = 0.05, between the treatments at site S as well as between the sites using non-parametric tests. The Kruskal–Wallis test was employed in case of multiple groups and, in case of significant results, followed by multiple pair-wise comparisons using post hoc probabilities corrected for the number of comparisons. The Mann–Whitney U test was employed in the case of two groups. All statistical tests were carried out using STATISTICA 9.0 for Windows (©Stat Soft. Inc.).
The relationships of sediment concentrations with nor-malized light loss were determined using the Origin soft-ware (© OriginLab). In a first phase, a range of possi-ble functions (first-to-fourth-order polynomials, exponen-tial, Napierian logarithmic and power) were fitted to the entire sets of micro-plot samples, slope-scale samples and catchment-scale samples. Overall, the third- and fourth-order
polynomials and the exponential functions provided the best fits, with identical adjusted R2values (0.73, 0.87 and 0.85, respectively). Nonetheless, the power function was preferred for the ensuing results, since the differences in R2 values were considered too small (≤ 0.02) to justify the additional one or two unknowns of the other functions.
4 Results and discussion 4.1 Micro-plot scale
4.1.1 Within-site differences related to erosion mitigation treatments
In line with the findings of Prats et al. (2014) regarding spe-cific soil losses, the sample sets of the three treatments dif-fered significantly in sediment concentrations (Table 2). The median sediment concentration of the untreated samples was 35 % lower than that of the PAM samples but almost 3 times higher than that of the mulching samples. The median or-ganic matter contents of all three sample sets were high (52– 67 %), suggesting that charred material was a major com-ponent of the sediments exported under all three treatments. These median values closely matched the average values in Prats et al. (2014), attesting to the representativeness of the sample sets included in this study. Furthermore, they agreed well with the figures in Malvar et al. (2011, 2013) for sedi-ments eroded during the first 2 years following a fire.
All three sample sets revealed a relationship of increasing normalized light loss with increasing sediment concentration (Fig. 2), as was expected based on the findings with an earlier prototype of the turbidity sensor (Bilro et al., 2010, 2011). The power function provided reasonably good fits of these relationships in all three instances, with adjusted R2values ranging from 0.64 in the case of the untreated samples to 0.72 in the case of the PAM samples (Table 2). Bilro et al. (2011)
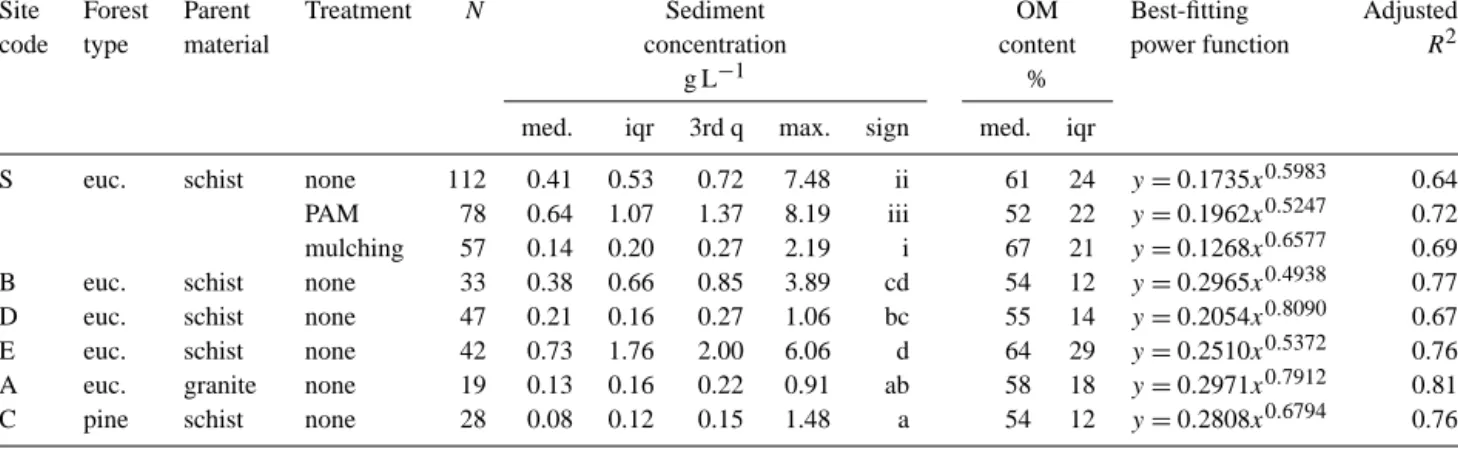
Table 2.Sediment concentrations and corresponding organic matter (OM) contents of the micro-plot scale overland flow samples at the six study sites, and best-fitting power functions between sediment concentration (x; in g L−1) with normalized light loss (y). Euc.: eucalypt; med.: median; iqr: inter-quartile range; 3rd q: third quartile; max.: maximum; sign: statistically significant differences, at α = 0.05, are indicated by different roman numbers in the case of the treatments tested at the S site and by different letters in the case of the other sites.
Site Forest Parent Treatment N Sediment OM Best-fitting Adjusted
code type material concentration content power function R2
g L−1 %
med. iqr 3rd q max. sign med. iqr
S euc. schist none 112 0.41 0.53 0.72 7.48 ii 61 24 y =0.1735x0.5983 0.64
PAM 78 0.64 1.07 1.37 8.19 iii 52 22 y =0.1962x0.5247 0.72 mulching 57 0.14 0.20 0.27 2.19 i 67 21 y =0.1268x0.6577 0.69
B euc. schist none 33 0.38 0.66 0.85 3.89 cd 54 12 y =0.2965x0.4938 0.77
D euc. schist none 47 0.21 0.16 0.27 1.06 bc 55 14 y =0.2054x0.8090 0.67
E euc. schist none 42 0.73 1.76 2.00 6.06 d 64 29 y =0.2510x0.5372 0.76
A euc. granite none 19 0.13 0.16 0.22 0.91 ab 58 18 y =0.2971x0.7912 0.81
C pine schist none 28 0.08 0.12 0.15 1.48 a 54 12 y =0.2808x0.6794 0.76
found clearly better fits (R2>0.95) for clay as well as ash particles but the authors used dilution series of artificial sam-ples rather than runoff samsam-ples collected in the field.
The curves fitted to the untreated and the PAM samples were very similar, at least within the range of measured sed-iment concentrations (i.e. < 8.5 g L−1). It is possible that the somewhat divergent curve of the mulching samples was due to a smaller range of measured sediment concentrations (< 2.5 g L−1), and because the relationships between sedi-ment concentration and normalized light loss seemed to re-veal more spread at higher concentrations.
4.1.2 Between-site differences related to land cover and parent material
Conspicuous and, in various instances, significant differ-ences existed between the study sites in the sediment concen-tration of the micro-plot runoff samples (Table 2). Median sediment concentrations appeared to be influenced by both parent material and forest type, as median values were sig-nificantly lower for the pine plantation on schist (0.08 g L−1) and for the eucalypt plantation on granite (0.13 g L−1) than for the eucalypt plantations on schist (≥ 0.21 g L−1). Signif-icant differences, however, also existed among the eucalypt plantations on schist, with the median sediment concentra-tion of the D site (0.21 g L−1) being 3.5 times lower than that of the E site (0.73 g L−1). Between-site differences did not seem to be related to fire severity, at least as suggested by the field indicators used in this study (see Sect. 2). The dif-ference in median sediment concentration between the pine plantation on schist and the eucalypt plantation on granite agreed well with the difference in the sites’ median specific sediment losses reported by Martins et al. (2013; 0.08 vs. 0.16 g m−2mm−1of runoff), once again testifying to the rep-resentativeness of the sample sets included in this study.
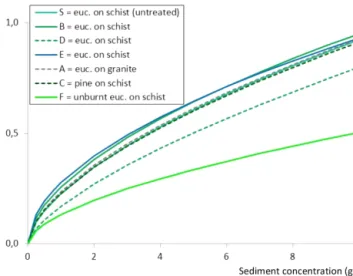
Figure 3.Best-fitting power functions of the relationships of post-fire sediment concentration with normalized light loss at the micro-plot scale for one pine plantation on schist and five eucalypt (euc.) plantations on schist or granite (see Table 2).
The untreated sample sets from all six study sites showed the expected increases in normalized light loss with increas-ing sediment concentrations. Furthermore, these increases agreed well with power functions, with the adjusted R2 val-ues of the fitted curves ranging from 0.64 to 0.81 (Fig. 3; Ta-ble 2). The fits were somewhat worse for sites D and S than for the remaining four sites (adjusted R2values: 0.64–0.67 vs. 0.76–0.81) but this difference was apparently unrelated to parent material, forest type, sediment concentrations or their organic matter contents. However, the shape of the fit-ted curves did seem relafit-ted to sediment concentrations. The curves were steeper for sites A, C and D than for sites B, E and S, and the former three sites had clearly lower median, third quartile and maximum sediment concentrations than the
Figure 4. Relationships of post-fire sediment concentration with normalized light loss at the slope scale for two treatments at study site S (symbols), and best-fitting power functions at the slope as well as micro-plot scale (lines) (see Tables 2 and 3). S_CTRL_slope/micro: untreated; S_MLCH_slope/micro: mulching with forest residues.
latter three sites (e.g. in the case of maximum concentrations, 0.91–1.48 vs. 3.89–7.48 g L−1). This contrast could be due to differences in the size of the exported sediment particles, since the sensor’s light attenuation was shown to decrease with increasing particle size (Bilro et al., 2011) and since the lower sediment concentrations at sites A, C and D could be explained by overland flow with a lower transport capacity, preferentially exporting smaller particles. Nonetheless, the contrast could also be an artefact from the lower ranges of sediment concentrations measured at sites A, C and D, as these ranges only covered the initial, steeper parts of the fit-ted curves.
4.2 Slope scale
4.2.1 Within-site differences related to erosion mitigation treatment
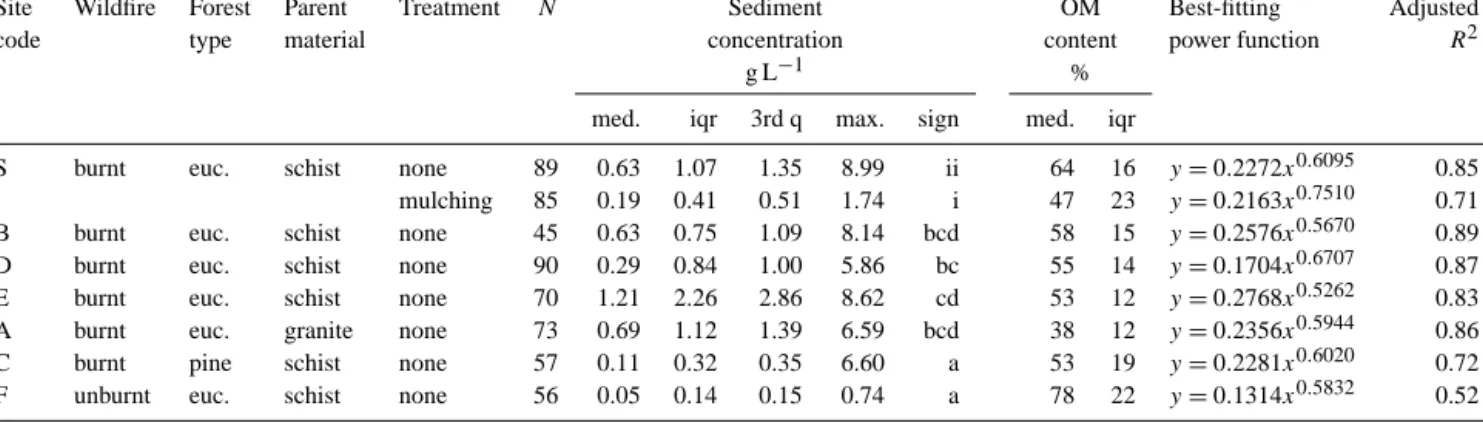
Like the micro-plot samples, the slope-scale samples re-vealed clear and significant differences in sediment concen-tration between the untreated and mulching samples (Ta-ble 3). The median sediment concentration of the untreated samples was more than 3 times higher than that of the mulching samples (0.63 vs. 0.19 g L−1). These differences agreed well with the stronger runoff response of the untreated plot compared to the mulched plot during the first year after a fire (Prats et al., 2015; 58 vs. 30 mm).
The slope-scale samples tended to have higher median, third quartile and maximum sediment concentrations than the micro-plot samples of the same treatment (Table 3). The only exception was the maximum sediment concentration of the mulched samples, being 20 % lower in the case of the
Figure 5.Best-fitting power functions of the relationships of sedi-ment concentration with normalized light loss at the slope scale for one long-unburnt eucalypt (euc.) plantation on schist (F), five re-cently burnt eucalypt (euc.) plantations on schist or granite (A, B, D, E, S) and one recently burnt pine plantation on schist (C) (see Table 3).
slope-scale samples than for the micro-plot samples (1.74 vs. 2.19 g L−1). This tendency in sediment concentrations was opposed to that in overland flow, as Prats et al. (2015) re-ported roughly 15 times less overland flow at the slope scale than at the micro-plot scale (409–956 vs. 30–58).
The fit of the power function was substantially better for the slope-scale samples than for the micro-plot samples in the case of the untreated plot but basically the same in the case of the mulched plot (Table 3; adjusted R2 values: 0.85 vs. 0.64 and 0.71 vs. 0.69, respectively). In both cases, light loss with increasing sediment concentration was larger for the slope-scale samples than for the micro-plot samples (Fig. 4). Only in the case of the mulching samples, however, was this due to a clearly higher attenuation coefficient (0.75 vs. 0.66) and, as noted earlier, could be explained by a greater prevalence of smaller particles in the slope-scale samples than in the micro-plot samples (see Bilro et al., 2011), re-flecting a reduced transport capacity of the overland flow. This explanation could also account for the lower median or-ganic matter concentration of the slope-scale samples, with the larger charred particles being beyond the runoff’s detach-ment/transport capacity.
4.2.2 Between-site differences related to fire, land cover and parent material
The slope-scale samples tended to have higher median, third quartile and maximum sediment concentrations than the micro-plot samples, as was also noted in the previous sec-tion. At the same time, however, they revealed similar con-trasts between the six burnt study sites, except in the case of
Table 3.Sediment concentrations and corresponding organic matter (OM) contents of the slope-scale overland flow samples at the seven study sites and best-fitting power functions between sediment concentration (x; in g L−1) with normalized light loss (y). Euc.: eucalypt; med.: median; iqr: inter-quartile range; 3rd q: third quartile; max.: maximum; sign: statistically significant differences, at α = 0.05, are indicated by different roman numbers in the case of the treatments tested at the S site and by different letters in the case of the other sites.
Site Wildfire Forest Parent Treatment N Sediment OM Best-fitting Adjusted
code type material concentration content power function R2
g L−1 %
med. iqr 3rd q max. sign med. iqr
S burnt euc. schist none 89 0.63 1.07 1.35 8.99 ii 64 16 y =0.2272x0.6095 0.85 mulching 85 0.19 0.41 0.51 1.74 i 47 23 y =0.2163x0.7510 0.71 B burnt euc. schist none 45 0.63 0.75 1.09 8.14 bcd 58 15 y =0.2576x0.5670 0.89 D burnt euc. schist none 90 0.29 0.84 1.00 5.86 bc 55 14 y =0.1704x0.6707 0.87 E burnt euc. schist none 70 1.21 2.26 2.86 8.62 cd 53 12 y =0.2768x0.5262 0.83 A burnt euc. granite none 73 0.69 1.12 1.39 6.59 bcd 38 12 y =0.2356x0.5944 0.86 C burnt pine schist none 57 0.11 0.32 0.35 6.60 a 53 19 y =0.2281x0.6020 0.72 F unburnt euc. schist none 56 0.05 0.14 0.15 0.74 a 78 22 y =0.1314x0.5832 0.52
the eucalypt plantation on granite (Table 3). The median sed-iment concentration was significantly lower for the pine plan-tation (0.11 g L−1) than for the burnt eucalypt plantations (on schist and granite; ≥ 0.29 g L−1). The median sediment con-centration for the eucalypt plantation on granite lied within the range of values for the other eucalypt plantations, un-like the case of the micro-plot samples. This reflected a com-paratively large increase in median sediment concentration from the micro-plot to slope scale. This was in line with the findings of Machado et al. (2015), who reported a marked increase in sediment losses with spatial scale for the euca-lypt plantation on granite (from 50 to 140 g m−2) as opposed to clear decreases for the pine plantation and the eucalypt plantation on schist at site B (from 85 and 200 to 3.5 and 6.1 g m−2, respectively).
The sediment concentrations for the unburnt eucalypt plantation were significantly lower than those for the burnt eucalypt plantations. This agreed with the slope-scale sedi-ment losses reported by Machado et al. (2015), being clearly lower for the unburnt than for the burnt eucalypt site on schist (1.2 vs. 3.5 g m−2).
Better fits of the power function were obtained for the slope-scale samples than for the micro-plot samples in the case of five of the six burnt study sites, the pine site being the exception (Table 3). The pine plantation also stood out for its low adjusted R2value (0.72) compared to the other burnt plantations (0.83–0.89). The R2value was similarly low for the mulching samples (0.71) and even considerably lower for the samples from the unburnt eucalypt stand (0.52), suggest-ing an association between poor fits and reduced sediment concentrations, unlike the case of the micro-plot samples.
The best-fitting curves for the slope-scale samples re-vealed a greater similarity between the six burnt plantations than those for the micro-plot samples (Fig. 5). Among the burnt plantations, only the D site stood out but mainly be-cause of a comparatively low base constant rather than a
dif-Figure 6.Relationships of sediment concentration with normalized light loss at the catchment scale (symbols), and best-fitting power functions at the catchment as well as slope scale for the eucalypt (euc.) and pine plantations located within the catchment (see Ta-bles 3 and 4).
ferent attenuation coefficient. For the same reason, the curve for the long-unburnt plantation stood out even more from those of the burnt plantations. The discrepancy of these two curves could well be an artefact from the comparatively low sediment concentrations measured at the D and F sites, and because possible differences in particle size due to reduced transport capacity would point to steeper curves, as was the case of the curves fitted to the micro-plot samples of sites A, C and D (see Sect. 4.1.2). Unlike in the case of the latter three sites, the curves fitted to the slope-scale samples of sites B and E agreed particularly well with those fitted to the sites’ micro-plot samples. This suggested that wider ranges of mea-sured sediment concentrations provided a more reliable basis
Table 4.Sediment concentrations and corresponding organic matter (OM) contents of the streamflow samples at the catchment outlet, and best-fitting power function between sediment concentration (x; in g L−1) with normalized light loss (y). Med.: median; iqr: inter-quartile range; 3rd q: third quartile; max.: maximum.
N Sediment OM Best-fitting Adjusted
concentration content power function R2
g L−1 %
med. iqr 3rd q max. med. iqr
158 0.50 0.83 1.05 4.55 22 8 y =0.2809x0.7071 0.85
for a consistent relation between turbidity and sediment con-centrations over spatial scales as well as across study sites.
4.3 Catchment scale
The sediment concentrations of the streamflow samples were more similar to those of slope-scale samples from the B site than from the A and C sites (Table 4). This fitted in well with the fact that the B site represented the dominant land cover– parent material combination within the catchment (Table 4). Nonetheless, the maximum value of the streamflow samples was well below the maximum values for all three slopes (4.55 vs. ≥ 6.59 g L−1). The median organic matter concentration of the streamflow samples was also comparatively low (22 vs. ≥ 38 %). Even so, it was substantially higher than the or-ganic matter content of the sediments deposited as bed load within the flume at the catchment outlet (Keizer et al., 2015; 5 %).
The power function provided a good fit to the relationship of increasing normalized light loss with increasing sediment concentration as revealed by the streamflow samples, with an adjusted R2of 0.85 (Table 4). The fitted curve, however, dif-fered considerably from the curves fitted to slope-scale sam-ples of the three slopes located within the catchment (Fig. 6). The stronger attenuation coefficient for the streamflow sam-ples (0.71 vs. 0.57–0.60) could be due to a prevalence of smaller particles in suspension, especially because of the de-position of sediments in the flume at the catchment outlet as well as in two upstream retention ponds (see Keizer et al., 2015).
5 Conclusions
The principal conclusions of this study into the performance of a novel plastic optical fibre (POF) turbidity sensor for measuring soil erosion following a wildfire were the follow-ing:
i. the observed sediment concentrations were within the measurement range of the POF sensor, attesting to the suitability of the sensor to be employed during the ini-tial phases of the so-called window of disturbance when erosion losses tend to be highest and exported sediments
tend to contain the highest content of – charred – or-ganic matter;
ii. the relationships of sediment concentration with nor-malized light loss varied markedly with spatial scale and, in particular, between micro-plot and slope-scale samples, on the one hand, and, on the other, catchment-scale samples, suggesting that catchment-scale-specific calibration curves are required to guarantee optimal sensor perfor-mance;
iii. the slope-scale relationships of sediment concentration with normalized light loss varied clearly less between study sites than the micro-plot-scale relationships, indi-cating that the need for site-specific calibration curves is greater when sediment concentrations and, thus, erosion rates are comparatively low;
iv. the previous conclusion was also suggested by the com-parison of the sediment concentrations with and without an effective erosion mitigation treatment;
v. the POF sensor would allow speeding up considerably the processing of the runoff samples in the laboratory (and, perhaps, even in the field) and, at the same time, would permit an efficient, stratified-sampling approach towards the construction of scale- and/or site-specific calibration curves.
Given the very satisfactory performance of the sensor in this study, further work will include redesigning the sensor and, in particular, its head to make it more robust and more easy to handle, testing the new sensor for continuous moni-toring of streamflow turbidity under field conditions, and op-timizing data processing algorithms,
Acknowledgements. The present study was carried out in the
framework of the projects TRANFIBRA (project no. 23148) and FIRECNUTS (PTDC/AGRCFL/104559/2008), funded by FEDER, through the Agência de Inovação S.A., in the framework of the QREN SI I&DT program and funded by FCT/MCTES (PIDDAC), with co-funding by FEDER through COMPETE (Programa Operacional Factores de Competitividade; POFC), respectively. Additional financial support was provided by the EU-FP7 project RECARE (grant agreement no. 603498). We further gratefully
acknowledge the help of various colleagues of the earth surface processes team with field data and sample collection and/or with laboratory analysis of the sediment samples. Finally, we would like to acknowledge the comments and suggestions by the handling editor as well as by the three anonymous reviewers, which helped to improve this manuscript considerably.
Edited by: G. Guzmán
References
APHA (American Public Health Association): Total suspended solids dried at 105 degrees Celsius method 2540D, in: Standard Methods for the Examination of Water and Waste Water, 20th Edn., Washington, DC, USA, 1998.
Ben-Hur, M.: Using synthetic polymers as soil conditioners to con-trol runoff and soil loss in arid regions – a review, Aust. J. Soil Res., 44, 191–204, 2006.
Bilro, L., Prats, S. A., Pinto, J. L., Keizer, J. J., and Nogueira, N.: Design and performance assessment of a POF based sensor for measuring water turbidity, Meas. Sci. Technol., 21, 107001, doi:10.1088/0957-0233/21/10/107001, 2010.
Bilro, L., Prats, S., Pinto, J. L., Keizer, J. J., and Nogueira, R. N.: Turbidity sensor for determination of concentration, ash presence and particle diameter of sediment suspensions, Proc. Spie., 7753, 775356, doi:10.1117/12.885112, 2011.
Campbell, C., Laycak, D., Hoppes, W., Tran, N. T., and Shib, F.: High concentration suspended sediment measurements using a continuous fiber optic in-stream transmissometer, J. Hydrol., 311, 244–253, 2005.
Cardoso, J. C., Bessa, M. T., and Marado, M. B.: Carta dos solos de Portugal (1:1,000,000), Serviço de Reconhecimento e de Or-denamento Agrário, Secretaria de Estado da Agricultura, Lisbon, Portugal, 1971.
Cardoso, J. C., Bessa, M. T., and Marado, M. B.: Carta dos solos de Portugal (1:1,000,000), Agronomia Lusitana, 33, 461–602, 1973. Cerdà, A.: Changes in overland flow and infiltration after a range-land fire in a Mediterranean shrubrange-land, Hydrol. Process., 12, 1031–1042, 1998.
Downing, J.: Twenty-five years with OBS sensors: The good, the bad, and the ugly, Cont. Shelf. Res., 26, 2299–2318, 2006. DRA-Centro (Direcção Regional do Ambiente do Centro): Plano
de bacia hidrográfica do Rio Vouga, 1◦fase, Análise e diagnós-tico da situação de referência, Análise biofísica, Anexos, Lisboa, Portugal, 1998.
DUDF (Direcção de Unidade de Defesa da Floresta): Relatório An-ual de Áreas Ardidas e Ocorrências 2010, Autoridade Florestal Nacional, Lisboa, 2011.
Fernández, C., Veja, J. A., Fontúrbel, M. T., Pérez-Gorostiaga, P., Jiménez, E., and Madrigal, J.: Effects of wildfire, salvage logging and slash treatments on soil degradation, Land. Degrad. Dev., 18, 591–607, 2007.
Ferreira, A. de Brum: Planaltos e montanhas do norte da Beira – es-tudo de geomorfologia, Centro de Eses-tudos Geográficos, Lisbon, Portugal, 1978.
Inbar, M., Tamir, M., and Wittenberg, L.: Runoff and erosion pro-cesses after a forest fire in Mount Carmel, a Mediterranean area, Geomorphology, 24, 17–33, 1998.
Keeley, J. E.: Fire intensity, fire severity and burn severity: A brief review and suggested usage, Int. J. Wildland Fire, 18, 116–126, 2009.
Keizer, J. J., Martins, M. A. S., Prats, S. A., Faria, S. R., González-Pelayo, O., Machado, A. I., Rial-Rivas, M. E., Santos, L. F., Serpa, D., and Varela, M. E. T.: Within-in flume sediment de-position in a forested catchment following wildfire and post-fire bench terracing, north-central Portugal, Cuadernos de Investi-gación Geográfica, 41, 149–164, 2015.
Lane, P. N. J., Sheridan, G. J., and Noske, P. J.: Changes in sedi-ment loads and discharge from small mountain catchsedi-ments fol-lowing wildfire in south eastern Australia, J. Hydrol., 331, 495– 510, 2006.
Lavabre, J. and Martin, C.: Impact d’un incendie de forêt sur l’hydrologie et l’érosion hydrique d’un petit bassin versant méditerranéan, Human Impact on Erosion and Sedimentation, Proceedings of Rabat Symposium S6, April 1997, IAHS Pub-lication 245, 39–47, 1997.
Machado, A. I., Serpa, D. R., Ferreira, R. S. V., Rodríguez-Blanco, M. L., Pinto, R., Nunes, M. I., Cerqueira, M. M., and Keizer, J. J.: Cation export by overland flow in a recently burnt forest area in north-central Portugal, Sci. Total Environ., 524–525, 201–212, 2015.
Malvar, M. C., Prats, S. A., Nunes, J. P., and Keizer, J. J.: Post-fire overland flow generation and inter-rill erosion under simulated rainfall in two eucalypt stands in north-central Portugal, Environ. Res., 111, 222–236, 2011.
Malvar, M. C., Martins, M. A., Nunes, J. P., Robichaud, P. R., and Keizer, J. J.: Assessing the role of pre-fire ground preparation operations and soil water repellency in post-fire runoff and inter-rill erosion by repeated rainfall simulation experiments in Por-tuguese eucalypt plantations, Catena, 108, 69–83, 2013. Martins, M. A. S., Machado, A. I., Serpa, D., Prats, S. A., Faria,
S. R., Varela, M. E. T., Gonzalez-Pelayo, O., and Keizer, J. J.: Runoff and inter-rill erosion in a Maritime Pine and a eucalypt plantation following wildfire and terracing in north-central Por-tugal, J. Hydrol. Hydromech., 61, 261–269, 2013.
Mayor, A. G., Bautista, S., Llovet, J., and Bellot, J.: Post-fire hydro-logical and erosional responses of a Mediterranean landscape: seven years of catchment-scale dynamics, Catena., 71, 68–75, 2007.
Moody, J. A., Shakesby, R. A., Robichaud, P. R., Cannon, S. H., and Martin, D. A.: Current research issues related to post-wildfire runoff and erosion processes, Earth-Sci. Rev., 122, 10–37, 2013. Omar, A. F. B. and MatJafri, M. Z. B.: Turbidimeter design and analysis: a review on optical fiber sensors for the measurement of water turbidity, Sensing, 9, 8311–8335, 2009.
Postolache, O. A., Silva Girao, P. M. B., Dias Pereira, J. M., and Ramos, H. M.: Multibeam optical system and neural processing for turbidity measurement, IEEE Sens. J., 7, 677–684, 2007. Prats, S. A., Martins, M. A. S., Malvar, M. C., Ben-Hur, M., and
Keizer, J. J.: Polyacrylamide application versus forest residue mulching for reducing post-fire runoff and soil erosion, Sci. Total Environ., 468–469, 464–474, 2014.
Prats, S. A., Wagenbrenner, J. W., Martins, M. A. S., Malvar, M. C., and Keizer, J. J.: Hydrological implications of post-fire mulching across two spatial scales, Land Degrad. Dev., doi:10.1002/ldr.2422, online first, 2015.
Robichaud, P. R., Elliot, W. J., Pierson, F. B., Hall, D. E., and Mof-fet, C. A.: Predicting postfire erosion and mitigation effective-ness with a web-based probabilistic erosion model, Catena, 71, 229–241, 2007.
Ruhl, C. A., Schoellhamer, D. H., Stumpf, R. P., and Lindsay, C. L.: Combined use of remote sensing and continuous monitoring to analyse the variability of suspended-sediment concentrations in San Francisco Bay, California, Estuar. Coast. Shelf S., 53, 801– 812, 2001.
Shakesby, R.: Post-wildfire soil erosion in the Mediterranean: re-view and future 730 research directions, Earth-Sci. Rev., 105, 71–100, 2011.
Shakesby, R. A. and Doerr, S. H.: Wildfire as a hydrological and geomorphological agent, Earth-Sci. Rev., 74, 269–307, 2006.
Thomas, A. D., Walsh, R. P. D., and Shakesby, R. A.: Nutrient losses in eroded sediment after fire in eucalyptus and pine forests in the wet Mediterranean environment of northern Portugal, Catena, 36, 283–302, 1999.
WRB (World reference base for soil resources): World Soil Re-sources Reports, 103, FAO, Rome, 2006.
Yeo, T. L., Sun, T., and Grattan, K. T. V.: Fibre-optic sensor tech-nologies for humidity and moisture measurement, Sensor Actuat. A-Phys., 144, 280–295, 2008.
Ziemann, O., Krauser, J., Zamzow, P. E., and Daum, W.: POF Hand-book – Optical Short Range Transmission Systems, 2nd Edn., Springer-Verlag, Berlin Heidelberg, 2008.