Nuno Miguel Amorim Jobling Ferreira
Dissertation of Integrated Master in Mechanical Engineering (MIEM)
Supervisor: Prof. Lucas F. M. da Silva
ii
Abstract
The objective of this work was to study the influence of the macroscopic state of the substrate surface on the strength of adhesive joints. For that, several patterns were made on the surface of the substrates. The patterns were treated in two different ways, cleaned with acetone or chemically treated. The substrates were then bonded with two types of adhesive, a brittle one (AV138) and a ductile one (Araldite 2015) and static and fatigue tests were carried out. Static testing began by trying to determine which depth of the pattern allowed better results for the joint strength of both adhesives. The next step was to test the different patterns with the depth chosen to see which was the best. The different patterns were always compared with specimens without pattern. For the fatigue tests, the pattern and adhesive with the most interesting results were used. After analyzing the results, it was observed that the patterns can increase the joint strength of non treated substrates in the case of the brittle adhesive.
iii
Resumo
Este trabalho teve como objectivo estudar a influência do estado macroscópico da superfície dos substratos na resistência de juntas adesivas. Para isso foram feitos vários perfis na superfície dos substratos. Os perfis foram então tratados de duas maneiras, foram limpos com acetona ou sofreram ataques químicos. Os substratos foram então colados com 2 tipos de adesivo, um frágil (AV138) e um dúctil (Araldite 2015) sendo efectuados ensaios estáticos e de fadiga. Nos ensaios estáticos começou-se por tentar determinar qual a profundidade dos perfis que permitia obter melhores resultados de resistência da junta para ambos adesivos. O próximo passo foi ensaiar os diferentes perfis com a profundidade escolhida de modo a perceber qual o melhor. Os vários perfis foram sempre comparados com substratos sem perfil. Para os ensaios de fadiga foi usado o perfil e o adesivo que apresentavam resultados mais interessantes. Depois de analisados os resultados percebeu-se que os perfis aumentam a resistência da junta para substratos sem tratamento no caso do adesivo frágil.
iv
Acknowledgements
Prof Lucas F.M. Silva Mr Miguel Figueiredo Mr Rui Silva
Mr Eduardo Marques Mrs Emilia Soares
v
Contents
1 Introduction ... 1 2 Experimental details ... 7 2.1 Adhesive description ... 8 2.2 Substrate material ... 10 2.3 Specimen geometry ... 11 2.4 Surface patterning ... 11 2.5 Surface treatments ... 13 2.6 Bonding ... 14 2.7 Static testing ... 17 2.8 Fatigue testing ... 18 3 Results ... 183.1 Influence of the pattern depth ... 18
3.1.1 Adhesive AV138 ... 18
3.1.2 Adhesive Araldite 2015 ... 21
3.2 Influence of the pattern direction ... 24
3.2.1 Adhesive AV138 ... 25 3.2.2 Adhesive Araldite 2015 ... 27 3.3 Fatigue testing ... 30 3.3.1 Adhesive AV138 ... 30 4 Conclusions ... 34 5 Future work ... 35 6 References ... 36
vi
Figure List
Figure 1 Stress distribution in riveted joints [1] ... 1
Figure 2 Stress distribution in bonded joints [1] ... 1
Figure 3 Peel and cleavage forces [1] ... 2
Figure 4 Avoid localized stress and ensure the adhesive works in shear [1] ... 2
Figure 5 Effect of overlap length on rupture strength for ductile and brittle adhesives [4] ... 3
Figure 6 Difference in stress distribution along the overlap for a single lap joint. a) Brittle adhesive, b) Ductile adhesive [5] ... 4
Figure 7 Representation of possible defects on surfaces with high roughness ... 6
Figure 8 Schematic representations of different modes of rupture in bonded single lap joints [1] ... 7
Figure 9 Araldite AV138 with Hardener HV998 ... 8
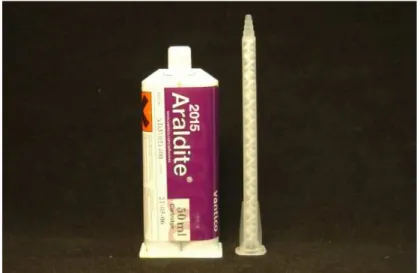
Figure 10 Araldite 2015 with the tube for application of the adhesive ... 9
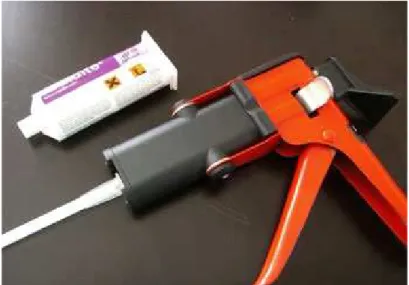
Figure 11 Araldite 2015 with dual syringe dispensing system ... 10
Figure 12 Joint geometry ... 11
Figure 13 Surface preparation patterns used and their designation ... 12
Figure 14 Cutting bit used for creating the patterning of the surface [13] ... 12
Figure 15 Specimens with no pattern and a 90º pattern with depths of 0.1mm and 0.3mm .... 13
Figure 16 Different patterns with a depth of 0.1 mm ... 13
Figure 17 Bottom half of mould used for the manufacturing of the adhesive joints ... 15
Figure 18 Top half of the mould used for the manufacturing of the adhesive joints ... 15
Figure 19 Mould with some specimens ... 16
Figure 20 Setup used to guarantee a constant adhesive thickness ... 16
Figure 21 INTOCO Hydraulic Press ... 17
Figure 22 Representation of a single lap joint ... 18
vii Figure 24 Fracture surfaces of specimens bonded with AV138 without chemical surface treatment. The surface patterns from left to right are: no surface pattern, 0.1 mm at 90º and 0.3 mm at 90º ... 20 Figure 25 AV138 with and without chemical surface preparation (the values in percentage represent the increase in joint strength from ‘no treatment’ to ‘chemical treatment’) ... 20 Figure 26 Fracture surfaces of specimens bonded with AV138 with chemical surface treatment. The surface patterns from left to right are: no surface pattern, 0.1 mm at 90º and 0.3 mm at 90º ... 21 Figure 27 Araldite 2015 without chemical surface preparation ... 22 Figure 28 Fracture surfaces of specimens bonded with Araldite 2015 without chemical surface treatment. The surface patterns from left to right are: no surface pattern, 0.1 mm at 90º and 0.3 mm at 90º ... 22 Figure 29 Araldite 2015 with and without chemical surface preparation (the values in percentage represent the increase in joint strength from ‘no treatment’ to ‘chemical treatment’) ... 23 Figure 30 Fracture surfaces of specimens bonded with Araldite 2015 with chemical surface treatment. The surface patterns from left to right are: no surface pattern, 0.1 mm at 90º and 0.3 mm at 90º ... 23 Figure 31 Typical load displacement curve ... 24 Figure 32 Various surface patterns with a depth of 0.1 mm without chemical surface preparation bonded with AV138 ... 25 Figure 33 Fracture surfaces of specimens bonded with AV138 without chemical surface treatment. The surface patterns from left to right are: no surface pattern, 0º, 45ª, 45º crossed, 90º and 90º crossed ... 26 Figure 34 Various surface patterns with a depth of 0.1 mm with and without chemical surface preparation bonded with AV138 (the values in percentage represent the increase in joint strength from ‘no treatment’ to ‘chemical treatment’) ... 26 Figure 35 Fracture surfaces of specimens bonded with AV138 with chemical surface treatment. The surface patterns from left to right are: no surface pattern, 0º, 45º, 45º crossed, 90º and 90º crossed [13] ... 27
viii Figure 36 Various surface patterns with a depth of 0.1 mm without chemical surface preparation bonded with Araldite 2015 ... 28 Figure 37 Fracture surfaces of specimens bonded with Araldite 2015 without chemical surface treatment. The surface patterns from left to right are: no surface pattern, 0º, 45º, 45º crossed, 90º and 90º crossed ... 28 Figure 38 Various surface patterns with a depth of 0.1 mm with and without chemical surface preparation bonded with Araldite 2015 (the values in percentage represent the increase in joint strength from ‘no treatment’ to ‘chemical treatment’) ... 29 Figure 39 Fracture surfaces of specimens bonded with Araldite 2015 with chemical surface treatment. The surface patterns from left to right are: no surface pattern, 0º, 45º, 45º crossed, 90º and 90º crossed [13] ... 30 Figure 40 Fatigue results for specimens with no pattern and 90º pattern bonded with AV138 and no surface treatment ... 31 Figure 41 Fatigue results with unitary loads for specimens with no pattern and 90º pattern bonded with AV138 and no surface treatment ... 31 Figure 42 Fatigue results for specimens with no pattern and 90º pattern bonded with AV138 and chemically treated ... 32 Figure 43 Fatigue results with unitary loads for specimens with no pattern and 90º pattern bonded with AV138 and chemically treated ... 32 Figure 44 Comparison between the 90º pattern with no treatment and no pattern with and without treatment ... 33 Figure 45 Comparison with unitary loads between the 90º pattern with no treatment and no pattern with and without treatment ... 33
ix
Table List
Table 1 Mechanical properties of AV138 adhesive [11] ... 8 Table 2 Mechanical properties of Araldite 2015 adhesive [11] ... 9 Table 3 Mechanical properties of aluminium AA6082-T6 [12]... 10
1
1
Introduction
In this work, single lap joints were studied. This type of joint is the most studied in the literature, where there is multiple simple criteria of dimensioning. The resistance of the joint depends on several factors that are hard to quantify, like the length of overlap, the plasticity of the adhesive, the thickness of the adhesive and the surface treatment.
From the beginning of the 20th century to the current 21st century, a progressive utilization of adhesives in bonding can be noticed. Adhesives are progressively replacing the conventional mechanical fastening systems.
Currently, structural adhesive bonding is more used, replacing or used in conjunction with the conventional mechanical fastening systems, with numerous advantages over them. Some of the characteristics of the structural adhesives are [1]:
− A more uniform stress distribution through the connected area, which allows for greater stiffness and load transfer;
Figure 1 Stress distribution in riveted joints [1]
2
− Improved fatigue strength in adhesively bonded joints ;
− Weight reduction and a lower cost;
− Connection of different materials in composition and with different coefficients of expansion;
− Usually adhesives are the most convenient and effective method to connect two materials;
− Can make the project more flexible allowing the use of new concepts and materials;
− Creates a continuous contact between the connected surfaces.
Although adhesives have a number of advantages, it is necessary to take into account the limitations they have [1]:
− Design connections that eliminate peel, cleavage and impact loads;
Figure 3 Peel and cleavage forces [1]
− Avoid localized stress and ensure an even distribution of stress by subjecting the adhesive to shear stress;
Figure 4 Avoid localized stress and ensure the adhesive works in shear [1]
− To obtain good results, a careful surface preparation is required;
3
− Adhesives have limited resistance to extreme conditions, such as heat and humidity due to the polymer nature of the adhesive.
The susceptibility of most adhesives to degradation in harsh environments is the main limitation of adhesive bonding. The humidity, temperature and solar radiations are some parameters affecting the durability of adhesive joints.
Adhesive joints are increasingly being used in industrial applications, hence the need for a more detailed analysis of the structures. This analysis involves a choice of the most appropriate joint geometry, the adhesives and the construction of the adhesive joints. These choices are based on environmental conditions, loads and the work to which the joint is subjected. The factors to consider are: the yield of the substrate and its thickness, type and thickness of the adhesive, the length of overlap and the surface treatment.
In single lap joints, the edges of the joint are the areas that have the highest stress concentration. The average stress is lower than the stress on the edges of the joint, and this uneven distribution of stress along the adhesive layer leads to failure normally for loads of inferior value than the adhesive can support [2].
Figure 5 shows the difference in joint strength for ductile and brittle adhesives, depending on the length of overlap. The joint strength increases initially, being higher for brittle adhesives. But for big overlaps, it appears that the ductile adhesives have joint strength much higher than the brittle adhesives [3].
4 Figure 6 shows, for a single lap joint, the difference of the shear stress distribution in a joint with a brittle adhesive and a ductile adhesive. It is evident that there is a high stress at the ends of the joint for the brittle adhesive and a greater uniformity of stress along the joint for the ductile adhesive. The ductile adhesive can take advantage of all of the overlap length, unlike the brittle adhesive, which explains why the rupture strength increases almost linearly with the length of overlap in the case of ductile adhesives.
Figure 6 Difference in stress distribution along the overlap for a single lap joint. a) Brittle adhesive, b) Ductile adhesive [5]
Another factor that should be taken into account is the adherend yielding. For adherends that remain elastic and a ductile adhesive, the failure load of single lap joints can be predicted using a global yielding criterion based on the shear stress of the adhesive.
ܨܮ = ߬௬∗ ݓ ∗ ݈ (1)
ܨܮ is the joint failure load,
τ
y is the adhesive yield shear strength, w is the joint width and l is overlap length. For joints with a brittle adhesive and elastic adherends, the Volkersen [6] model is used and the failure occurs when the maximum shear stress at the ends of the overlap exceeds the shear strength of the adhesive [7].ܨܮ ≃ ߬∗ߣ ∗ ݈ ∗ ሾ1 + cosh(ߣ ∗ ݈)ሿ (2)2 ∗ ݓ ∗ ݈ ∗ sinh(ߣ ∗ ݈)
5
ߣଶ = ܩ
ݐ∗ ൬
2 ܧ ∗ ݐ௦൰
ܨܮ is the joint failure load, ta is the adhesive thickness, ts is the substrate thickness, G is the adhesive shear modulus, E is the substrate Young’s modulus, w is the joint width, l is overlap length and τr is the adhesive shear strength.
For adherends that deform plastically Adams et al [8] proposed a failure criterion corresponding to the adherend yielding.
ܨܮ = ߪ௬∗ ݓ ∗ ݐ௦ (3)
Where FL is the joint failure load, ߪ௬ is the adherend yielding stress, w is the joint width and ts is the substrate thickness.
The thickness of the adhesive layer is an important factor when it comes to structural adhesives. An optimum thickness should be ensured for the adhesive to be able to obtain the best performance of the joint. The thicknesses commonly used and recommended by the manufacturers are between 0.1 and 0.2 mm. It is experimentally verified that the resistance of a joint decreases with an increase of adhesive thickness from 0.1 – 0.2 mm. For thickness less than 0.1 mm, there is a sudden drop in resistance of the joint, possibly due to the fact that there is a risk of failure of bonding [1].
The decrease of joint strength with the increase of thickness can be explained by several parts:
1. For high adhesive thickness, there is the risk of introducing defects in the joint, such as air bubbles and micro cracks;
2. At the extremities of the joint, the bending moment increases (depending on the thickness of the adhesive and the substrate), resulting in a decrease in the resistance of the joint;
3. Plastification in the case of ductile adhesives occurs for higher loads in high thickness joints, but spreads more rapidly along the overlap resulting in a lower resistance of the joint.
6 The surface treatments are intended to form surfaces which are resistant and easy to wet. The strength of an adhesive joint increases significantly when loose particles such as corrosion products, paint and other contaminants are removed from the surface.
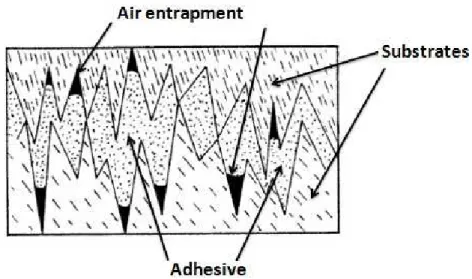
Roughness is a parameter which affects the strength of bonded joints, because it leads to an increased contact area between the two substrates and increases the interface connections. The substrates must present, in the area of overlap, an intermediate roughness so that the entrapment of air in the joint interface does not happen. A high surface roughness may cause an increase of stress concentration and consequent decrease in the resistance of the joint because the adhesive does not fully penetrate into the cavities. For metals, roughness may increase the resistance of the joint but for substrates with a low surface energy the increase of roughness does not have the same effect, as shown by Pinto et al [9]. Figure 7 shows the phenomenon of non-penetration of the adhesive in the cavities of the substrate.
Figure 7 Representation of possible defects on surfaces with high roughness
Figure 8 shows the difference between adhesive and cohesive fracture, where the objective of the surface treatment is to obtain a cohesive rupture.
7 Figure 8 Schematic representations of different modes of rupture in bonded single lap joints [1]
The relationship between the joint strength and the substrate roughness depends on other factors, and cannot be expressed only as a function of the substrate roughness. Thus, it is considered that many of the surface treatments applied in order to generate roughness, induce physical-chemical changes that can affect the surface energy of the substrates and wettability [10].
The surface condition is an important factor and should be such that the failure is cohesive. The results from the literature show that a rough surface increases the joint strength up to a certain point upon which the cavities might introduce stress concentrations. It is common in workshops to have metal plates with scratches due to handling. From the results in the literature, these scratches might increase the joint strength; however this has never been assessed. Also, the effect might be different with brittle and ductile adhesives. The main objective of this study is to assess the effect of scratches or grooves with two different types of adhesives.
2
Experimental details
An experimental study was planned to determine the influence of the surface pattern on the resistance of single lap joints. The experiments consisted in static and fatigue tests for various specimens with different patterns. The rupture strength of the specimens was compared along with the behavior of the specimens under cyclic loads and conclusions were drawn.
8
2.1
Adhesive description
For the testing program two different kinds of adhesives were selected. A brittle one (Huntsman AV138 + HV998 Hardener) and a more ductile one (Huntsman Araldite 2015). These adhesives when applied on a patterned surface are expected to have different behaviors. The brittle adhesive, Araldite AV138 with Hardener HV998 is a two component, room temperature curing paste adhesive of high strength. When fully cured the adhesive will have a excellent performance at elevated temperatures (120 ºC) and has high chemical resistance. It is suitable for bonding a wide variety of metals and is widely used in many industrial applications where resistance to aggressive or warm environments is required. The resin and hardener should be mixed with a mass relation of 100/40 (resin/hardener) until they form a homogenous mix. The mechanical properties of the adhesive can be seen on Table 1.
Table 1 Mechanical properties of AV138 adhesive [11]
Shear modulus G (MPa) 1559 ± 11
Shear yield stress, ࣎࢟ࢇ (MPa) 25.0 ± 0.55 Shear strength, ࣎࢘ (MPa) 30.2 ± 0.40 Shear failure strain, ࢽࢌ(%) 5.50 ± 0.44
9 The ductile adhesive, Araldite 2015 is a two component, room temperature curing paste adhesive giving a resilient bond. It is thixotropic and non sagging up to 10 mm thickness and has a high shear and peel strength. The mechanical properties of the adhesive can be seen on Table 2.
Table 2 Mechanical properties of Araldite 2015 adhesive [11]
Shear modulus G (MPa) 487 ± 77
Shear yield stress, ࣎࢟ࢇ (MPa) 17.9 ± 1.8 Shear strength, ࣎࢘ (MPa) 17.9 ± 1.8 Shear failure strain, ࢽࢌ(%) 43.9 ± 3.4
Figure 10 Araldite 2015 with the tube for application of the adhesive
This adhesive is applied through a dual syringe dispensing system and the two parts of the adhesive are blended in the tube coming out of the free side as a homogenous mix.
10 Figure 11 Araldite 2015 with dual syringe dispensing system
2.2
Substrate material
The material used for the substrates was AA6082-T6 aluminium. This choice was made because the aluminium due to its low weight and good mechanical properties is an increasingly used material in aerospace and automotive industries which are among those that use adhesive techniques. Aluminium also helps to keep costs down in the fabrication of the specimens because it is easier to do the patterns. The mechanical properties of the aluminium can be seen in Table 3.
Table 3 Mechanical properties of aluminium AA6082-T6 [12]
Tensile strength, ࣌ࢁࢀࡿ (MPa) 305.6 Yield stress, ࢙࣌࢟ (MPa) 245.1 Elongation at failure, ࢿ࢘ (%) 16.5 Young's modulus, E (GPa) 69.5
Shear modulus, G (GPa) 25.34
11
2.3
Specimen geometry
For the tests, a specimen with a simple geometry was chosen. An overlap area of
24.8 ∗ 25 ݉݉ was prepared with the various patterns. A very rough approximation for the
yield strength can be calculated from the overlapping region. Equations 4 and 5 show the force needed to completely plastify the adhesive region and equation 6 shows the force needed in order to yield the aluminium substrate.
ܨܮௗ௦௩ ଵଷ଼ ≃ ߬
௬ௗ,ௗ௦௩∗ ܽݎ݁ܽ = 25 ∗ 24.8 ∗ 25 = 15500 ܰ (4)
ܨܮௗ௧ ଶଵହௗ௦௩ ≃ ߬
௬ௗ,ௗ௦௩∗ ܽݎ݁ܽ = 17.9 ∗ 24.8 ∗ 25 = 11098 ܰ (5)
ܨܮ௦௨௦௧௧ ≃ ߪ௬ௗ,௦௨௦௧௧∗ ܽݎ݁ܽ = 245.1 ∗ 24.8 ∗ 3 = 18235 ܰ (6) Equations (4)-(6) show that there will be no adherend yielding for the chosen adhesives during the tensile test when a overlap area of approximately 24.8 ∗ 25 ݉݉ଶ is used. This is important, since no deformation of the adherend should exist which could influence the adhesive behavior to be studied. Figure 12 shows the chosen joint geometry.
Figure 12 Joint geometry
2.4
Surface patterning
The preparation of the surface of the substrate is of extreme importance in the implementation of a glued joint, as its resistance depends heavily on the quality of this operation. In an ideal bond, the substrate must be the weakest link, however in most of the bonded joints it is the adhesive that behaves as the weakest link. Different surface patterns and depths were tested in tensile tests for both adhesives and the best pattern and depth were
12 then selected for the fatigue tests. Figure 13 shows the different patterns that were used and the unprepared surface used for comparison.
Figure 13 Surface preparation patterns used and their designation
The manufacturing of the patterned specimens was done on a Bridgeport vertical milling machine, which was previously fitted with a lathe cutting bit with a 45º angle in the tool holder.
Figure 14 Cutting bit used for creating the patterning of the surface [13]
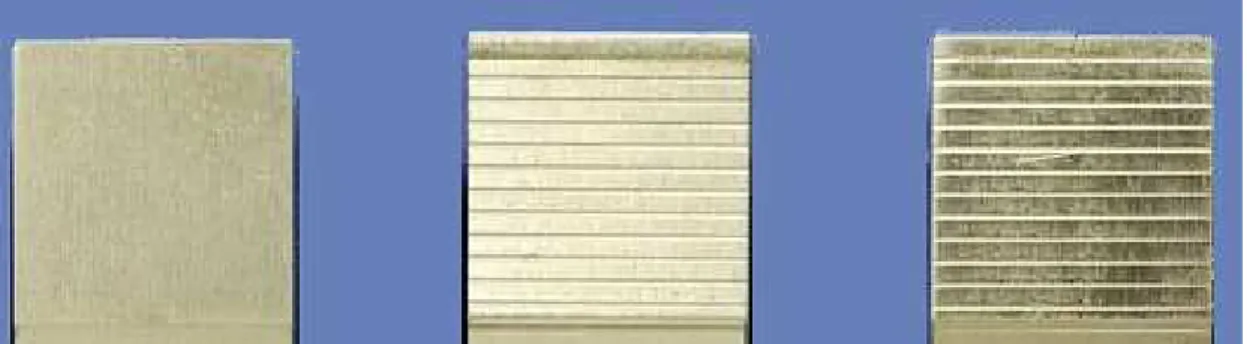
The patterns applied to the specimens consisted of a series of grooves, which were applied with 0º, 45º or 90ºorientations (relative to the sides of the specimen) and with depths of 0.1 and 0.3 mm. The distance between the grooves was 2 mm. Figure 15 shows specimens with a pattern of 90º and depths of 0.1 mm and 0.3 mm compared with a specimen with no pattern.
13 Figure 15 Specimens with no pattern and a 90º pattern with depths of 0.1mm and 0.3mm
Figure 16 shows all the patterns with a depth of 0.1 mm that will be tested with both adhesives.
Figure 16 Different patterns with a depth of 0.1 mm
2.5
Surface treatments
The effect of the grooves was assessed under two conditions: with and without surface treatment. The idea was to check if the grooves would be sufficient to have a good strength without additional treatment. For the case of ‘no treatment’ only acetone was used to clean the substrates after the grooves were done. In the case of surface treatment, a chemical surface treatment using chromic acid was chosen as it is verified that the tensile strength of chemically prepared specimens is significantly higher than without preparation.
It should, however, be noted that this process is currently being phased out of industrial applications. Despite being a very efficient procedure, it uses a large amount of toxic and even carcinogenic chemicals. Some alternative procedures are being currently developed which are much less damaging to the environment. As an example, the work of G. W. Critchlow [14]
14 studied several duplex oxide layer mechanisms to substitute anodizing with chromic acid. Various non toxic-electrolytes have been tested [13].
The chromic acid used for this work was produced with the following composition:
− 1 liter of distilled water
− 300g of ܪଶܱܵସ
− 60g of ܰܽଶܥݎଶܱ. ܪଶܱ
The procedure for the preparation of the specimens is described below:
1. 300g of high grade sulphuric acid are dissolved in 1 liter of distilled water.
2. The ܰܽଶܥݎଶܱ. ܪଶܱ crystals are dissolved in the solution. This reaction is exothermic and heats the recipient. The operation must be done in a ventilated area and the recipient must have a large open section to minimize the chances of overheating.
3. The specimens are suspended on metallic wires with half of their length submerged in the chromic acid solution.
4. The solution is heated up to 65ºC and kept at that temperature for 15 minutes. 5. The specimens are removed and quickly rinsed with tap water. A second rinse is
performed with distilled water to remove surface contaminants.
6. The specimens are then dried in hot air and carefully conditioned to avoid the reappearance of oxides.
The final result is a very clear surface, clearly devoid of any contamination. The application of the adhesive has to be fast to avoid the reappearance of oxides.
2.6
Bonding
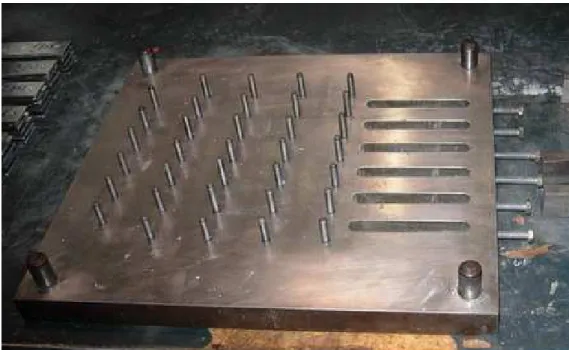
The adhesive joints were manufactured using a mould that can be seen in Figures 17 and 18.
15 Figure 17 Bottom half of mould used for the manufacturing of the adhesive joints
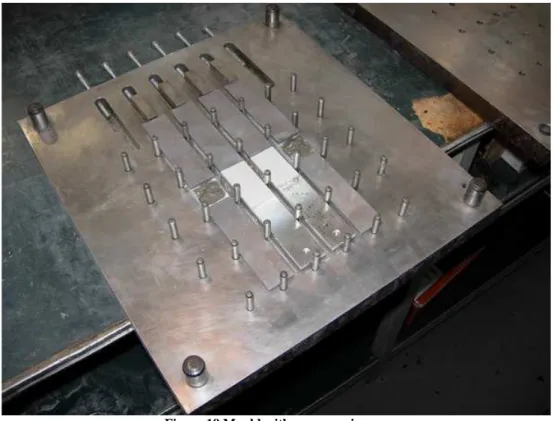
Figure 18 Top half of the mould used for the manufacturing of the adhesive joints This mould allows the manufacture of 6 adhesive joints at the same time.
16 Figure 19 Mould with some specimens
The adhesive thickness used was 0.2 mm, since this is believed to be the best performing thickness. This is achieved by the curing setup shown in Figure 20.
Figure 20 Setup used to guarantee a constant adhesive thickness
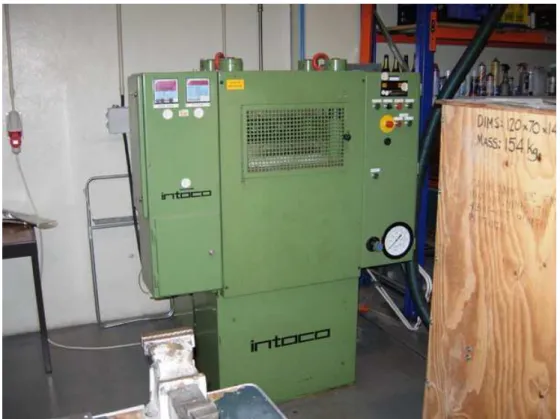
Spacers with a thickness of ݐℎ݅ܿ݇݊݁ݏݏ௦+ ݐℎ݅ܿ݇݊݁ݏݏௗ௦௩ = 3.2݉݉ were used in order to guarantee a constant thickness of the adhesive layer. The INTOCO hot-plate hydraulic press shown in Figure 21 was used to secure the parts in place during the curing process. The hot-plate hydraulic press uses heat and pressure in order to cure the adhesive.
17 Figure 21 INTOCO Hydraulic Press
The steps necessary to prepare the specimens are the following:
− Heat the tools to 80ºC for easier application of the mould release agent.
− Apply the mould release agent on the mould and spacers.
− Apply a thin adhesive layer on the overlap being careful so that no air is trapped inside.
− Mount the mould.
− Insert the mould into the previously heated at 40ºC hydraulic press.
− Cure the adhesive at 100ºC and with a load of 2000 lbs for 1h30.
2.7
Static testing
The tensile test of a single lap joint is one of the most common methods to characterize an adhesive joint. The test consists in applying forces in the longitudinal direction of the specimens until the occurrence of rupture. As can be seen by the geometry of the specimen (Figure 22), there is a misalignment of traction forces, even when spacers are used in the places of mooring. The test of a single lap joint can be used as a method for comparative study of adhesives, provided that the standardization of other parameters that can affect the outcome of the tests is ensured. The tests were done on a MTS 810 machine with a test
18 velocity of 1 mm/min in typical laboratory ambient conditions (approximately 25ºC and 50% relative humidity).
Figure 22 Representation of a single lap joint
2.8
Fatigue testing
The effect of the grooves might be different under cyclic loads. The grooves act like stress concentrators which may lead to a shorter life of the specimens under cyclic loads. The behavior under cyclic conditions is a function of the type of adhesive and, above all, the geometry of the joint. Usually, the tests that are performed have as an objective to represent a diagram of maximum stress vs number of cycles for rupture. This diagram is called the SN curve or Wöhler curve. The solicitation frequency has an important role in fatigue behavior. The maximum usable frequency is dependent on the thermal conductivity of the par adhesive/substrate, the method of loading and the size of the specimen. The fixation of the specimens must keep the specimens well aligned so that there is no deviation in the applied force of more than 2%. The tests were done on a MTS 810 machine with a test frequency of 10 Hz to see the effect of grooves under cyclic loads. Three levels of load were used (80%, 60% and 40% of the ultimate load obtained in the static test) and the maximum number of cycles that a specimen could do was set to one million cycles. Three specimens were tested for each load level.
3
Results
3.1
Influence of the pattern depth
3.1.1
Adhesive AV138
Tensile tests were performed in order to see the influence of the depth of the patterns. In these tests the patterns were applied at 90º with depths of 0.1 and 0.3 mm. 0.1 mm is the smallest dimension possible to machine on the available equipment and 0.3 mm represents 10% of the substrate thickness, reducing the resistance of the substrate considerably. Four
19 tensile tests were done for each depth and 4 not patterned specimens were also tested. This was done for both surface treatments.
The first tests were done with the specimens only cleaned with acetone. This should lead to weaker joint strength than the specimens that were chemically treated, which should simplify the identification of the best surface pattern depth. The results are presented in Figure 23.
Figure 23 AV138 without chemical surface preparation
The tests show that the patterned surface leads to a higher resistance of the joint, but no conclusion can be made in relation to the different depths since the results are very similar between them. Figure 24 shows the fracture surfaces of specimens with various depths of the patterns. 0 2125 4250 6375 8500 0 0.1 0.3 F m a x m e a n [ N ] Depth [mm]
20 Figure 24 Fracture surfaces of specimens bonded with AV138 without chemical surface treatment. The surface
patterns from left to right are: no surface pattern, 0.1 mm at 90º and 0.3 mm at 90º
The fracture surfaces show that the specimens without pattern had adhesive failures while the patterned ones had mixed cohesive/adhesive failures.
The next step was to test chemically treated specimens. The same number of specimens for the different depths was tested in addition to the specimens with no pattern. The results are presented in Figure 25.
Figure 25 AV138 with and without chemical surface preparation (the values in percentage represent the increase in joint strength from ‘no treatment’ to ‘chemical treatment’)
With chemically treated specimens, the results show that the pattern with a depth of 0.1 mm has the best result. The specimen with no pattern has a high increase of strength in relation to no treatment while the pattern with a depth of 0.1 mm has a lower but still considerable increase of strength. The increase of strength from the no treated surface to the
37,85% 19,46% 4,24% 0 2125 4250 6375 8500 0 0.1 0.3 F m a x m e a n [ N ] Depth [mm] chemical treatment no treatment
21 treated surface is because the failure goes from mixed cohesive/adhesive to cohesive. The 0.3 mm pattern presents very similar results with or without chemical treatment. The results may be influenced by an equilibrium between the anchoring effect and stress concentration factors. Figure 26 shows the fracture surfaces of specimens with various depths of the patterns.
Figure 26 Fracture surfaces of specimens bonded with AV138 with chemical surface treatment. The surface patterns from left to right are: no surface pattern, 0.1 mm at 90º and 0.3 mm at 90º
The fracture surfaces show that all chemically treated specimens had cohesive ruptures. The tests with AV138 adhesive show that the 0.1 mm depth is the best leading to a higher resistance of the joint, especially when chemically treated.
For joints with a brittle adhesive, the Volkersen model is used for a prediction of joint strength giving a value of 5474.98 N (Equation 2)
This value is to be compared with the joint strength results when cohesive failure is obtained which is approximately 6500 N. The model cannot be used to assess the effect of the grooves.
3.1.2
Adhesive Araldite 2015
The first tests were done with the specimens only cleaned with acetone. This should lead to weaker joint strength than the specimens that were chemically treated, which should simplify the identification of the best surface pattern depth. The results are presented in Figure 27.
22 Figure 27 Araldite 2015 without chemical surface preparation
The tests show that the patterned surface leads to a lower resistance of the joint, but no conclusion can be made in relation to the different depths since the results are very similar between them and the test uncertainty, defined by the standard deviation of the results overlaps the mean values. Figure 28 shows the fracture surfaces of specimens with various depths of the patterns.
Figure 28 Fracture surfaces of specimens bonded with Araldite 2015 without chemical surface treatment. The surface patterns from left to right are: no surface pattern, 0.1 mm at 90º and 0.3 mm at 90º
The fracture surfaces show that the rupture was mixed cohesive/adhesive for the different specimens. The next step was to test chemically treated specimens. The same number of specimens for the different depths was tested in addition to the specimens with no pattern. The results are presented in Figure 29.
0 3125 6250 9375 12500 0 0.1 0.3 F m a x m e a n [ N ] Depth [mm]
23 Figure 29 Araldite 2015 with and without chemical surface preparation (the values in percentage represent the
increase in joint strength from ‘no treatment’ to ‘chemical treatment’)
With chemical treated specimens, the results show that the pattern with a depth of 0.1 mm has the best result. The specimen with no pattern has an increase of strength smaller than the pattern with a depth of 0.1 mm in relation to the no treatment surface. The 0.3 mm depth pattern presents very similar results with or without chemical treatment. Because of the results of the patterns with a depth of 0.3 mm, this depth was not used again in the following tensile and fatigue tests. Figure 30 shows the fracture surfaces of specimens with various depths of the patterns.
Figure 30 Fracture surfaces of specimens bonded with Araldite 2015 with chemical surface treatment. The surface patterns from left to right are: no surface pattern, 0.1 mm at 90º and 0.3 mm at 90º
10,29% 18,50% 7,22% 0 3125 6250 9375 12500 0 0.1 0.3 F m a x m e a n [ N ] Depth [mm] chemical treatment no treatment
24 The fracture surfaces show that the rupture was cohesive for the different specimens. As with the AV138 adhesive, the depth of 0.1 mm presents the best results but the results with and without chemical treatment are very similar for the Araldite 2015 adhesive.
The joint strength prediction using the Volkersen model gives a value of 555.06 N (Equation 2).
The failure load obtained with this model is well below the experimental failure load (≈ 10500 N). This is because the adhesive is ductile. For ductile adhesives, the global yielding criterion is more appropriate giving a value of 11098 N (Equation 1).
This value is to be compared with the joint strength results when cohesive failure is obtained which is ≃ 10500 N.
Figure 31 shows a typical load displacement curve. The curve is linear up to failure which shows that there was not any adherend plastic deformation during the test.
Figure 31 Typical load displacement curve
3.2
Influence of the pattern direction
All 5 specimen patterns were tested in these tensile tests. The tensile tests were done to compare different patterns with a depth of 0.1 mm for both adhesives with and without surface treatments. 0 2500 5000 7500 10000 0 0,2 0,4 0,6 0,8 1 Lo a d [ N ] Displacement [mm]
25
3.2.1
Adhesive AV138
The first tests were done with the specimens only cleaned with acetone. This should lead to weaker joint strength than the specimens that were chemically treated, which should simplify the identification of the best surface pattern. The results are presented in Figure 32.
Figure 32 Various surface patterns with a depth of 0.1 mm without chemical surface preparation bonded with AV138 The tests show that the best results were obtained with the crossed patterns at 45º and 90º. This may be related to the bigger anchoring effect of these patterns due to the higher affected area. The patterns at 45º and 90º also had good results almost to the level of the crossed patterns at 45º and 90º. The test uncertainty, defined by the standard deviation of the results of each specimen is high. Figure 33 shows the fracture surfaces of specimens with different patterns. 0 2125 4250 6375 8500 no 0 45 45X 90 90X F m a x m e a n [ N ]
26 Figure 33 Fracture surfaces of specimens bonded with AV138 without chemical surface treatment. The surface
patterns from left to right are: no surface pattern, 0º, 45ª, 45º crossed, 90º and 90º crossed
The fracture surfaces show that the specimens without pattern had adhesive ruptures while the patterned ones had mixed cohesive/adhesive failures.
The next step was to test chemically treated specimens. The same number of specimens for the different patterns was tested. The results are presented in Figure 34.
Figure 34 Various surface patterns with a depth of 0.1 mm with and without chemical surface preparation bonded with AV138 (the values in percentage represent the increase in joint strength from ‘no treatment’ to ‘chemical
treatment’) 43,75% 56,35% 12,92% 4,49% 16,78% 6,36% 0 2125 4250 6375 8500 no 0 45 45X 90 90X F m a x m e a n [ N ] Axis Title chemical treatment no treatment
27 The tests show that the results are all very similar between the patterns with the test uncertainty, defined by the standard deviation of the results of each specimen overlapping the mean values. The specimens that were chemically treated present higher rupture strength than the non chemically treated, but are not sensitive to the presence of the patterns since the results are similar between the patterns. Figure 35 shows the fracture surfaces of specimens with different patterns.
Figure 35 Fracture surfaces of specimens bonded with AV138 with chemical surface treatment. The surface patterns from left to right are: no surface pattern, 0º, 45º, 45º crossed, 90º and 90º crossed [13]
The fracture surfaces show that all chemically treated specimens had cohesive ruptures. The chemical treatment allows the specimens to achieve higher rupture strengths but presents an indifference to the presence of patterns while with no chemical treatment the presence of patterns clearly had an effect of the rupture strength of the specimens.
3.2.2
Adhesive Araldite 2015
The first tests were done with the specimens only cleaned with acetone. This should lead to weaker joint strength than the specimens that were chemically treated, which should simplify the identification of the best surface pattern. The results are presented in Figure 36.
28 Figure 36 Various surface patterns with a depth of 0.1 mm without chemical surface preparation bonded with
Araldite 2015
The tests show that the results are all very similar between the patterns with the test uncertainty, defined by the standard deviation of the results of each specimen high. Figure 37 shows the fracture surfaces of specimens with different patterns.
Figure 37 Fracture surfaces of specimens bonded with Araldite 2015 without chemical surface treatment. The surface patterns from left to right are: no surface pattern, 0º, 45º, 45º crossed, 90º and 90º crossed
0 3125 6250 9375 12500 no 0 45 45X 90 90X F m a x m e a n [ N ]
29 The fracture surfaces show that the rupture was mixed cohesive/adhesive for the different specimens
The next step was to test chemically treated specimens. The same number of specimens for the different patterns was tested. The results are presented in Figure 38.
Figure 38 Various surface patterns with a depth of 0.1 mm with and without chemical surface preparation bonded with Araldite 2015 (the values in percentage represent the increase in joint strength from ‘no treatment’ to ‘chemical
treatment’)
The tests show that the results are all very similar between the patterns with the test uncertainty, defined by the standard deviation of the results of each specimen overlapping the mean values. The results between the chemically treated specimens and the non treated were very similar. Figure 39 shows the fracture surfaces of specimens with different patterns.
9,44% 4,16% -3,90% 6,79% 1,30% 1,94% 0 3125 6250 9375 12500 no 0 45 45X 90 90X F m a x m e a n [ N ] Axis Title chemical treatment no treatment
30 Figure 39 Fracture surfaces of specimens bonded with Araldite 2015 with chemical surface treatment. The surface
patterns from left to right are: no surface pattern, 0º, 45º, 45º crossed, 90º and 90º crossed [13]
The fracture surfaces show that all chemically treated specimens had cohesive ruptures. The results show little difference between the specimens with chemical treatment and the specimens with no treatment and between the different patterns.
3.3
Fatigue testing
For fatigue testing, only two types of specimens were used: no pattern and a 90º pattern with a depth of 0.1 mm. The 90º pattern was not the best overall but showed good results and it is easier to manufacture than the other patterns presenting savings in time and costs. The adhesive AV138 was the only one tested because adhesive Araldite 2015 did not show any sensitivity to the patterns. Three fatigue tests were done for each load level for both patterns.
3.3.1
Adhesive AV138
The first tests were done with the specimens only cleaned with acetone. The results are presented in Figures 40 and 41. In Figure 41 the load is normalized in relation to the static failure load.
31 Figure 40 Fatigue results for specimens with no pattern and 90º pattern bonded with AV138 and no surface treatment
Figure 41 Fatigue results with unitary loads for specimens with no pattern and 90º pattern bonded with AV138 and no surface treatment
The tests show that the patterned specimens were better than the specimens with no pattern. At 40% of the ultimate load, the patterned specimens were close to 500.000 cycles while the specimens with no pattern at the same level were only close to 50.000 cycles. The slope of the patterned specimens is lower than that of the specimens with no pattern. This shows that the grooves have a good effect on the behavior of the specimens under cyclic conditions y = -268,1ln(x) + 5029 R² = 0,8346 y = -296,7ln(x) + 6039,3 R² = 0,9524 0 2500 5000 7500 10000 12500 1 10 100 1000 10000 100000 1000000 Lo a d [ N ] Number of cycles no pattern 90º y = -0,054ln(x) + 1,0045 R² = 0,8346 y = -0,051ln(x) + 1,0421 R² = 0,9524 0 0,25 0,5 0,75 1 1,25 1,5 1 10 100 1000 10000 100000 1000000 U n it a ry l o a d [ N ] Number of cycles no pattern 90º
32 The next step was to test chemically treated specimens. The results are presented in Figures 42 and 43. In Figure 43 the load is normalized in relation to the static failure load.
Figure 42 Fatigue results for specimens with no pattern and 90º pattern bonded with AV138 and chemically treated
Figure 43 Fatigue results with unitary loads for specimens with no pattern and 90º pattern bonded with AV138 and chemically treated
The tests show that the patterned specimens were slightly better than the specimens with no pattern. All the patterned specimens achieved 1,000,000 cycles with a load of 3621 N while only one of the specimens with no pattern achieved 1,000,000 cycles with a load of 2761 N. The slope of the patterned specimens is also slightly lower than that of the specimens with no pattern. This shows that the grooves have a good effect on the behavior of the specimens under cyclic conditions.
y = -335,5ln(x) + 7460,7 R² = 0,9396 y = -354,6ln(x) + 8352,3 R² = 0,8996 0 2500 5000 7500 10000 12500 1 10 100 1000 10000 100000 1000000 Lo a d [ N ] Number of cycles no pattern 90º y = -0,049ln(x) + 1,081 R² = 0,9396 y = -0,047ln(x) + 1,1031 R² = 0,8996 0 0,25 0,5 0,75 1 1,25 1,5 1 10 100 1000 10000 100000 1000000 U n it a ry l o a d [ N ] Number of cycles no pattern 90º
33 Figures 44 and 45 compare the three following cases: no pattern and no treatment, no pattern and chemically treated and 90º pattern with no treatment. The specimen with a 90º pattern and not treated is not as good as the chemically treated specimen with no pattern. However, the results show the scratches or grooves are almost sufficient to obtain good results with no any additional surface treatment.
Figure 44 Comparison between the 90º pattern with no treatment and no pattern with and without treatment
Figure 45 Comparison with unitary loads between the 90º pattern with no treatment and no pattern with and without treatment 0 2500 5000 7500 10000 12500 1 10 100 1000 10000 100000 1000000 Lo a d [ N ] Number of cycles 90º no treatment no pattern chemically treated no pattern no treatment 0 0,25 0,5 0,75 1 1,25 1,5 1 10 100 1000 10000 100000 1000000 U n it a ry l o a d [ N ] Number of cycles 90º no treatment no pattern chemically treated no pattern no treatment
34
4
Conclusions
Single lap joints with patterns were studied with and without surface treatment and bonded with a brittle and a ductile adhesive. The conclusions that can be taken from the study are:
1. Tensile testing showed that the depth of the patterns that showed the best results was 0.1 mm for both adhesives.
2. Tensile testing with the brittle adhesive (AV138) shows that the surface patterns influence the joint strength. This influence is most noticed for the specimens with no surface treatment, with the patterned specimens having a higher strength than the specimens with no pattern. With the chemically treated specimens, the patterns still have a influence on the joint strength but that influence is considerably smaller compared with the specimens that were not treated.
3. Tensile testing with the ductile adhesive (Araldite 2015) shows that the surface patterns does not have a significant influence on the joint strength.
4. Fatigue testing with the brittle adhesive (AV138) shows that the surface patterns have a good effect on the behavior of the specimens under cyclic conditions. The patterned specimens consistently endured more cycles than the specimens with no pattern. This happened especially with the specimens without surface treatment. 5. The surface patterns with no treatment are a good alternative to the chemical
35
5
Future work
Despite all the work done in this study there are some points that can be assessed in future works.
1. Study the effects of the grooves with other surface treatments.
2. Fatigue testing with adhesive Araldite 2015 to see the behavior of the specimens under cyclic loads.
36
6
References
[1] da Silva, Lucas F. M.; Magalhães, António G.; Moura, Marcelo F. S. F., “Juntas Adesivas Estruturais”, Publindústria, Porto, 2007
[2] Monteiro, D. F., “Análise do Comportamento à Fractura de Juntas de Aço Efectuadas com Adesivos Estruturais”, Tese de Mestrado Integrado em Engenharia Mecânica, Faculdade de Engenharia da Universidade do Porto, 1995
[3] Carbas, R. J. C., “Estudo Paramétrico de Juntas Adesivas pelo Método de Taguchi”, Tese de Mestrado Integrado em Engenharia Mecânica, Faculdade de Engenharia da Universidade do Porto, 2008
[4] Petrie, Edward M., “Handbook of Adhesives and Sealants”, McGraw Hill, New York, 2007
[5] Lees, W. A., “Adhesives in Engineering Design”, The Design Council, London, 1984 [6] Volkersen, O., “Die nietkraftoerteilung in zubeanspruchten nietverbindungen mit konstanten loschonquerschnitte”, Luftfahrtforschung 15, 41-47, 1938.
[7] Banea, Mariana D.; da Silva, Lucas F. M., “Mechanical Characterization of Flexible Adhesives”, The Journal of Adhesion, 85:261–285, 2009
[8] Adams, R. D.; Comyn, J.; Wake, W. C., “Structural Adhesive Joints in Engineering”, Second Edition Chapman & Hall, London, 1997
[9] Guedes Pinto, A.M.; Magalhães, A. G.; Gomes da Silva, F.; Monteiro Baptista, A.P., “Shear Strength of Adhesively Bonded Polyolefins with Minimal Surface Preparation”, International Journal of Adhesion and Adhesives, 28:452–456, 2008
[10] Arenas Reina, J. M.; Narbón Prieto, J. J.; Alía García, C., “Influence of the Surface Finish on the Shear Strengh of Structural Adhesive Joints and Application Criteria in Manufacturing Processes”, The Journal of Adhesion, 85:324–340 2009
[11] da Silva, Lucas F. M.; Carbas, R.J.C.; Chrichtlow, G. W.; Figueiredo, M. A. V.; Brown, K., “Effect of Material, Geometry, Surface Treatment and Environment on the Shear Strength of Single Lap Joints”, The Journal of Adhesion Science Technology, 29;621-632, 2009
37 [12] Pereira, A. M.; Ferreira, J. M.; Antunes, F. V.; Bártolo, P. J., “Study on the Fatigue Strengh of AA6082-T6 Adhesive Lap Joints”, International Journal of Adhesion & Adhesives, 29:633-638, 2009
[13] Richter-Trummer, V.; Marques, E.; “Influence of Surface Patterns on Joint Resistance”, Relatório da disciplina de Juntas Adesivas Estruturais do Programa Doutoral em Engenharia Mecânica, Faculdade de Engenharia da Universidade do Porto, 2008
[14] Critchlow, G. W., “Mechanisms for the Formation of Duplex Oxides for the Bonding of Aluminum Alloys”, Proc. Advanced Computational Engineering an eXperimenting (ACE-X), Algarve, Portugal, July 2007, p 79
![Figure 6 Difference in stress distribution along the overlap for a single lap joint. a) Brittle adhesive, b) Ductile adhesive [5]](https://thumb-eu.123doks.com/thumbv2/123dok_br/15911220.1092689/13.892.136.798.348.596/figure-difference-distribution-overlap-brittle-adhesive-ductile-adhesive.webp)
![Figure 8 Schematic representations of different modes of rupture in bonded single lap joints [1]](https://thumb-eu.123doks.com/thumbv2/123dok_br/15911220.1092689/16.892.121.787.114.315/figure-schematic-representations-different-rupture-bonded-single-joints.webp)
![Figure 14 Cutting bit used for creating the patterning of the surface [13]](https://thumb-eu.123doks.com/thumbv2/123dok_br/15911220.1092689/21.892.237.692.520.780/figure-cutting-bit-used-creating-patterning-surface.webp)