Velocity Growth Plan Continues
And we’re lovin’ it
We start the analysis of McDonald’s with a BUY recommendation, since our FY18 target price of $187.52 represents a 19.5% return over the current prices.
The further refranchising of the business model will drive profitability, due to the increasingly steady revenues from the franchisees with higher operating margins, offsetting any estimated decrease in revenues. The Company is already 92% franchised and the current Company target is 95%, which according to our estimates, will be reached by 2020.
Stronger investments in EOTF, mobile app and introducing delivery, along with the relaunch of the McCafé and the new $ lower value menus, are the main growth drivers, which will enable the Company to retain and bring in more customers.
High Growth Markets (HGM) segment is expected to have a big increase in its operating margins. With operating margins of 17.1% in 2016 and 22.2% in 2017, we expect 38.4% in 2018, a significant increase due to the “Vision 2022” plan, which consists on the refranchising of the majority of China and Hong Kong restaurants.
Company description
McDonald’s is an American fast food company. Founded in 1940, it became the largest global fast food restaurant chain, operating through 37,241 stores in 120 countries as of year-end 2017. The Company’s business is structured into four segments: US, International Lead Markets, High Growth Markets and Foundational Markets & Corporate, having a global footprint, which contributes to its enormous reputation as a key player in this industry.
M
CD
ONALD’
SC
OMPANYR
EPORTQUICK SERVICE RESTAURANTS INDUSTRY
23
M
AY2018
S
TUDENT:
D
IOGOG
ÓIS27229@novasbe.pt
Recommendation: BUY
Price Target FY18: $187.52
Price (as of 22-May-18) $159.44
Bloomberg: MCD US 52-week range ($) 146.84-178.70 Market Cap ($bn) 125.61 Outstanding Shares (m) 787.8 Source: Bloomberg Source: Bloomberg 2017 2018E 2019E Revenues ($m) 22 820 20 338 20 244 EBITDAR ($m) 12 561 11 839 12 431 EBITDA ($m) 10 916 10 460 10 953 EBIT ($m) 9 553 9 018 9 448 Net Income ($m) 5 192 5 892 6 139 EPS ($) 6.5 7.7 8.3
Dividend Payout Ratio (%) 59.5% 53.6% 51.1% ROIC (%) 21.6% 26.0% 26.4% CAPEX ($m) 1 854 2 431 2 258 FCF ($m) 5 469 5 470 6 240 Source: Company Data and Analyst Estimation
Table of Contents
MCDONALD’S AND THE QSR INDUSTRY ...
3MCDONALD’S PRESENTATION – BRIEF HISTORY ... 3
MCDONALD’S STRATEGY – RECENT DEVELOPMENTS ... 4
SHAREHOLDER STRUCTURE AND STOCK ANALYSIS ... 5
ECONOMIC OUTLOOK ...
6INDUSTRY OUTLOOK ...
7SECTOR ANALYSIS ... 7
MAIN COMPARABLES ... 10
KEY GROWTH DRIVERS ...
13EXPERIENCE OF THE FUTURE (EOTF) ... 13
DIGITAL ... 14
DELIVERY... 14
DOLLAR MENU ... 15
LEVERAGING THE MCCAFÉ BRAND ... 15
VALUATION ...
16KEY DRIVERS ... 16
Stores Expansion ... 16
Sales ... 17
Operating Margin Analysis ... 19
Capital Expenditures (Capex) ... 21
Working Capital ... 22
SHAREHOLDERS´ RETURN ... 22
LONG-TERM DEBT FORECAST ... 23
RETURN ON INVESTED CAPITAL ... 23
FIRM VALUATION ... 24
Weighted Average Cost of Capital ... 24
Growth Rate ... 26
DCF Valuation ... 27
Sensitivity Analysis ... 27
Relative Valuation ... 27
Scenario Analysis ... 28
Final Value Creation Analysis ... 28
APPENDIX ...
29FINANCIAL STATEMENTS – BALANCE SHEET ... 29
FINANCIAL STATEMENTS – INCOME STATEMENT ... 30
McDonald’s and the QSR Industry
McDonald’s Presentation – Brief History
Since the first McDonald's Bar-B-Q restaurant was founded in 1940 by the brothers Dick and Mac McDonald and the first franchised restaurant was opened by Ray Kroc in 1955, who later purchased the McDonald brothers' equity in the Company and led its worldwide expansion, McDonald’s has become the largest global fast food restaurant chain, operating through 37,241 stores in 120 countries at year-end 2017. The Company’s business is currently structured in 4 segments, with the US segment representing almost 38% of the Company stores and 35% of total revenues as of year-end 2017 (figures 1 and 2).
The global expansion throughout the years has been based on a successful franchise business model, wherein all restaurants are operated either by the Company or by franchisees, including conventional franchisees under franchise arrangements (in which McDonald’s owns the land and building) and developmental licensees and foreign affiliated markets under license agreements. This business model, in which the Company defines itself primarily as a franchisor, enables McDonald’s to consistently have a substantially uniform menu across its units, adapting it to local culture, driving profitability due to the increasingly steady revenues from the franchisees with higher operating margins, as can be seen in the valuation section, key drivers / operating margin analysis: the franchisees contribute to the Company’s revenue through the payment of rent (just for the conventional) and royalties / fees for all the 3 types of franchisees. At year-end 2017, 34,108 restaurants were franchised (figure 3).
McDonald’s was the most valuable fast food brand in the world in 2017 with an estimated brand value of about $97.7 bn, according to Statista, well ahead of Starbucks, the second in the ranking, with a brand value of $44.2 bn (figure 4). Figure 1: Historical Store Evolution
Source: Company Data 0 2 000 4 000 6 000 8 000 10 000 12 000 14 000 16 000 United States International Lead Markets High Growth Markets Foundational Markets & Corporate
Figure 2: 2017 Revenue Split per Segment
Source: Company Data 35% 32% 24% 9% United States International Lead Markets High Growth Markets Foundational Markets & Corporate
Figure 3: Historical Operate/Franchised Stores Split
Source: Company Data
Figure 4: 2017 Most Valuable Food Brands ($m)
Source: Statista 2018 Survey
97 723 44 230 21 713 13 521 8 133 6 289 5 893 5 722 5 388 5 116 McDonald's Starbucks Subway KFC Pizza Hut Domino's Pizza Tim Hortons Chipotle Taco Bell Burger King Brand Value 2017
McDonald’s Strategy – Recent Developments
In May 2015, due to poor 2014 operating results (systemwide sales for the year saw a moderate increase, while global comparable-store sales figures declined by 1% and operating income dropped by 8%, on top of six straight consecutive quarters declines in the US same-store sales), McDonald´s announced a major turnaround plan (figure 5), designed to sharpen the Company’s focus on the customer. This resulted in a reorganization from a geographically-focused structure to segments that combine markets with similar characteristics and opportunities for growth – US, its largest market; International Lead Markets, including Australia, Canada, France, Germany and the UK; High Growth Markets, including China, Italy, Poland, Russia, South Korea, Spain, Switzerland and the Netherlands; and Foundational Markets & Corporate, the remaining markets in the McDonald´s system.
More recently, in March 2017, McDonald's unveiled its long term global growth plan, focusing on increasing guest counts, average check and its profitability. This plan, called the Velocity Growth Plan (figure 6), identified three growth accelerators: Experience of the Future (EOTF), focusing on store reimaging and modernization, technology and greater emphasis on McCafé brand; Delivery, where the Company continues to further scale its delivery platform as a way of expanding the convenience to customers, namely through the partnership with UberEats; Digital, placing renewed emphasis on improving its existing service model and strengthening its relationships with customers, by evolving the technology platform.
With the successful revamping of McCafé in 2016 and more recently the launch of the $1 $2 $3 Dollar Menu in January 2018, the Company is better positioned to offer a compelling, national value program that resonates with customers.
Furthermore, due to the substantial cash flow generation, the Company has consistently returned cash to shareholders: $30 bn for the 2014 – 2016 period and announced a target of $24 bn for the 2017 – 2019 period, through the combination of dividends paid and share repurchases, while maintaining solid investment grade credit rating (McDonald’s has currently the following ratings: BBB+ by S&P; Baa1by Moody’s and BBB by Fitch).
At the end of 2017, the Company reached over $90 bn in systemwide sales (sales at all restaurants), $22.8 bn in revenues, $9.6 bn in operating income (with a 41.9% Figure 5: Turnaround Plan
Source: Company Data Turnaround Plan Technology Investment Core Menu Quality Experience Upgrades All-day Breakfast Sleeker Menu Pipeline Simplified Menu Boards
Figure 6: Velocity Growth Plan
Source: Company Data Velocity Growth Plan EOTF Delivery Digital
Figure 7: Historical Revenue ($m) and Operating Margin Evolution
0.0% 5.0% 10.0% 15.0% 20.0% 25.0% 30.0% 35.0% 40.0% 45.0% 0 5 000 10 000 15 000 20 000 25 000 30 000 2014 2015 2016 2017 Total Revenues Operating Margin
operating margin), with nearly 92% of the restaurants being owned and operated by independent and local franchisees (figure 7).
In terms of the recent evolution of revenues and operating income margin (excluding other operating income / expense) by segment, following the turnaround and Velocity Growth plans, there has been a natural decrease in revenues due to the franchise business model. However, operating income margin in all the segments have improved, proving the recent strategy implemented by McDonald’s to be in good track (figure 8).
Regarding the strategy of the peers, the franchising business model and the growth accelerators of the Velocity Growth Plan identified above, are general trends in the fast food industry, as we will see in the industry outlook section, main comparables. However, the key strategic challenges McDonald’s faces have to do with:
(1) Increase customer loyalty and innovate in the US market. This is important due to the brand’s popularity being tied to this segment. Therefore, a weakening evolution in the US could jeopardize the overall McDonald’s operation, especially in key markets whose brand awareness is not as strong as in the US. (2) Convenience redefinition. This is critical as customers are focusing more and more on this feature and might easily choose other options.
Shareholder Structure and Stock Analysis
McDonald’s is a public company, trading under the symbol MCD on the New York Stock Exchange in the US. McDonald’s is listed in the Dow Jones Industrial Average (DJIA) since 1985, due to its market capitalization, trading volume and relevance in an industry. The number of shareholders of the Company’s common stock as of 31st
January, 2018 was estimated to be 1,781,818, according to its 2017 Annual Report. Even though McDonald´s is also included in published restaurant indices, the Company believes that the comparison in those indices is not meaningful, because most of the other companies cannot be compared in terms of international exposure and operations with McDonald´s.
Revenues ($m) and OI%
Revenues OI % Revenues OI % Revenues OI % Revenues OI %
US 8 651 41.1% 8 559 40.6% 8 253 43.6% 8 006 47.6%
ILM 8 544 34.5% 7 615 35.2% 7 223 38.6% 7 340 41.5%
HGM 6 845 13.8% 6 173 13.8% 6 161 17.1% 5 533 22.2%
FM&C 3 401 15.3% 3 066 11.4% 2 985 12.8% 1 941 15.8%
Figure 8: Historical Revenue and Operating Margin Evolution per Segment
Source: Company Data
2016 2017
2014 2015
Figure 9: Comparison of Cumulative 5 Year Total Return
Source: Bloomberg $ 50 $ 100 $ 150 $ 200 $ 250 2012 2013 2014 2015 2016 2017 McDonald's Corporation S&P 500 Index Dow Jones Industrials
The figure 9 shows McDonald’s cumulative total shareholders return relative to the Standard & Poor’s 500 Stock Index (S&P 500 Index) and to the DJIA companies for the five-year period ended 31st December, 2017 (based on an $100 investment at 31st December, 2012).
McDonald´s has paid dividends on common stock for 42 consecutive years throughout 2017 and has increased the dividend amount at least once every year. In figure 10, the key financial data, related to recent dividends and share evolution.
Economic Outlook
As a global firm, McDonald’s is affected by the economies in which it is located – See figure 11 for the evolution of US GDP and food and beverage sector, from 2010 up to 2017. Therefore, it is important to understand global and local economy drivers. On a global level, according to the International Monetary Fund (IMF) “World Economic Outlook” April 2018 report, the global upswing that began around mid-2016 driven by an investment recovery in advanced economies and robust growth in Asia, has become broader and stronger, recording a 3.8% world growth increase in 2017, the fastest since 2011.
According to the same report, global growth is expected to maintain its growth pace at 3.9% in 2018 and 2019, due to strong market sentiment and financial conditions, as well as the fiscal policy reform implemented in the United States, which will enable companies to pay less in taxes. Helping to drive this output acceleration is faster growth in the Euro area, Japan, China, and the United States, all of which grew above expectations last year. Along with China, several other emerging markets and developing economies, including Brazil, Mexico and emerging Europe, will also do better this year than in the past.
On the medium-term, the IMF estimates global growth of 3.7%, cautioning that this positive momentum will eventually slow down, due to the warning of some cyclical forces: financial conditions are expected to tighten; US tax reform will refrain momentum starting in 2020, and then more strongly as full investment expensing is Figure 10: Historical Dividends and Shares Purchases Evolution
Source: Company Data
Year 2014 2015 2016 2017
DPR % 67.6% 71.3% 65.3% 59.5%
Dividend per share ($) 3.28 3.44 3.61 3.83
Number of shares outstanding at year end (m) 962.9 906.8 819.3 794.1
Total dividends paid ($m) 3 216 3 230 3 058 3 089
Treasury stock purchases ($m) 3 199 6 099 11 171 4 686
Figure 11: US GDP ($bn) and Food and Beverage ($bn) Evolution
Source: US Department of Commerce – Bureau of Economic Analysis
0.00% 1.00% 2.00% 3.00% 4.00% 5.00% 6.00% 00 5 000 10 000 15 000 20 000 25 000 2010 2011 2012 2013 2014 2015 2016 2017 GDP GDP Growth
Food and Beverage Growth Food and Beverage % of GDP
phased out starting in 2023; and China’s transition to lower growth is expected to resume as credit growth and fiscal stimulus diminish.
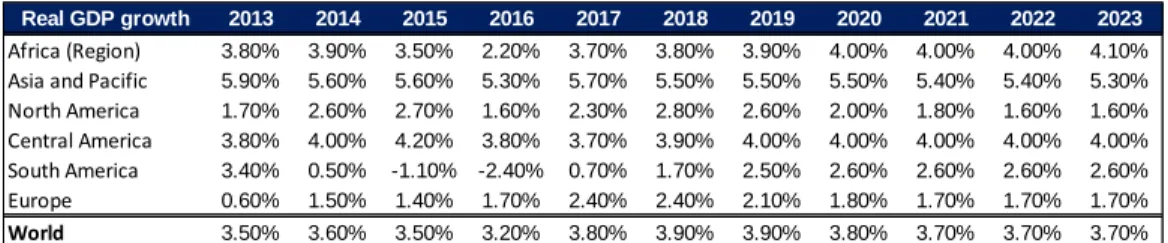
Taking into account IMF estimates and the Company’s primary locations, we have in the figure 12 below the historical and estimated GDP annual percentage changes from 2015 to 2022, in constant prices, supporting the valuation key drivers that will be presented in the valuation section below.
Industry Outlook
Sector Analysis
The restaurant industry has 3 generic market segments: Quick Service Restaurants (QSR), identified with the fast food; Casual Dining, which consists, on average, on more expensive meals, such as $15 and above, offering menus with a much wider range of choices; and Fast Casual, which is a mix of both.
McDonald’s operates in the QSR, which consists on fast food service and minimal table service. According to Passport Euromonitor research, the fast food industry generated about $708 bn worldwide sales in 2017, which is higher than several countries GDP, such as Portugal ($218 bn in 2017) or Denmark ($325 bn in 2017) (Franchise Help, 2017; World Bank, 2017). This market is composed of the following fast food types: Asian, bakery, burger, chicken, convenience stores, fish, ice cream, Latin American, Middle Eastern, pizza and others.
The fast food industry grew at a CAGR of 2.3% in the period 2012 / 2017 and the United States represented more than 1/3 of the world sales in 2017, showing a CAGR of 3.9% in the same period, followed by the Asia-Pacific region (practically in line with the US in terms of generated sales in 2017 and a CAGR of 3.4% in the
Real GDP growth 2013 2014 2015 2016 2017 2018 2019 2020 2021 2022 2023
Africa (Region) 3.80% 3.90% 3.50% 2.20% 3.70% 3.80% 3.90% 4.00% 4.00% 4.00% 4.10%
Asia and Pacific 5.90% 5.60% 5.60% 5.30% 5.70% 5.50% 5.50% 5.50% 5.40% 5.40% 5.30%
North America 1.70% 2.60% 2.70% 1.60% 2.30% 2.80% 2.60% 2.00% 1.80% 1.60% 1.60%
Central America 3.80% 4.00% 4.20% 3.80% 3.70% 3.90% 4.00% 4.00% 4.00% 4.00% 4.00%
South America 3.40% 0.50% -1.10% -2.40% 0.70% 1.70% 2.50% 2.60% 2.60% 2.60% 2.60%
Europe 0.60% 1.50% 1.40% 1.70% 2.40% 2.40% 2.10% 1.80% 1.70% 1.70% 1.70%
World 3.50% 3.60% 3.50% 3.20% 3.80% 3.90% 3.90% 3.80% 3.70% 3.70% 3.70%
Figure 12: Historical and Forecasted GDP Growth per Region
Source: IMF
Figure 13: Fast Food Industry CAGR (From 2012 to 2017) per Region
Source: Passport Euromonitor 3.4% -1.6% 0.6% -1.0% 3.3% 3.3% -0.4% Asia Pacific Australasia Eastern Europe Latin America Middle East and
Africa North America Western Europe
same period), particularly due to the Chinese evolution (sales of $129 bn in 2017, with a CAGR of 4.1% in the same period). See figure 13 for CAGR evolution by main regions in the period 2012 / 2017.
In terms of firm’s revenues dominance in 2017, McDonald’s was the number one with $22.8 bn, followed by Starbucks ($22.4 bn) and Yum! ($5.9 bn). In the US, the restaurants in general, seem to be experiencing a positive trend. The S&P Supercomposite Restaurants Index increased 23% in 2017 through December, especially due to large companies, such as Yum! and McDonald’s. It is important to note that this industry increased slightly more than the S&P 500 index, which recorded a gain of 19% in the same time period, highlighting the good period this industry is going through (figure 14).
According to Zion Market Research, the fast food industry will grow at an expected 4.2% annual growth between 2017 and 2022, despite the increasing concerns about the impact of fast food on health, clearly supporting the outstanding importance of fast food around the globe. Another essential characteristic of this industry is the franchising activity, which is the preferred model of several quick service restaurant chains, such as McDonald’s and its main peers.
According to Bloomberg Intelligence, there are many factors that could affect fast food spending: stagnant income growth, rising health care, rent and student loan costs. However, at least in the US, those factors will be mitigated by the intrinsic consumer relationship with fast food, since in the last survey published by Gallup in 2013, QSR plays a major role in most Americans’ lives – 8 of 10 reported they eat fast food at least monthly, while nearly half eat at least once in a week. On the other side, younger adults, those aged 18 to 29, eat fast food most often, with 57% saying they do so weekly.
In order to understand better the regions in which McDonald’s is located in, we decided to do an analysis of the main markets the Company has a strong presence in terms of store units and sales, namely United States, France, Germany, UK, China and Japan.
United States
In the US, fast food reached a market size of $247 bn in 2017, a 4% year on year growth. This market has been consistently growing over that last 5 years, always recording growth above 3%, as figure 15 highlights.
Figure 14: S&P Supercomposite Restaurants versus S&P 500 Index
Source: Bloomberg/Reuters 90% 95% 100% 105% 110% 115% 120% 125% 130% S&P 500 restaurants S&P 500
Figure 15: US Fast Food Market Size ($bn) and Growth
Source: Passport Euromonitor
0.00% 2.00% 4.00% 6.00% 180 200 220 240 260
In this market a price war is now underway, with companies such as McDonald’s, Jack-in-the-Box or Taco Bell adopting low cost price strategies. For example, McDonald’s is introducing the dollar menu, in which the customer can buy items for $1, $2 or $3, while Taco Bell introduced a list of all $1 menus. Another trend is the investment in innovation, which will add convenience for customers, increase margins, introduce self – service kiosks and focus more on mobile ordering and delivery. Lastly, customers want healthier options, placing special focus in the food they eat and its impact on their health, as this is a trend being seen more often in this industry.
In terms of fast food units, there were 272,325 stores in 2017, which can be divided in several types, as seen in figure 16. Bakery products has the highest number of units, representing 31.8% of the market, followed closely by burger products with 27.6%, the key segment in which McDonald’s operates, although it also offers other types of fast food. The Company has 14,036 units in the US, representing almost 5% of the whole number of units in the fast food industry, highlighting its strong presence.
When analyzing sales (figure 17), burger comes as the revenue king. It has almost 50% of the market, with a total value of $109 bn, followed by bakery products with 22.2% and sales of $55 bn and chicken products, with 11.1% and sales of $27 bn. McDonald’s which had systemwide sales of $37.6 bn in the US, had a market share of 15% , highlighting once again its strong presence.
France, Germany and UK
France, Germany and UK where the Company has a total of 4,207 stores, as of 2017, are the main European markets. Europe currently has an estimated market size of about $100 bn, generating less than half the sales the US generates. Over the past 3 years, Europe has seen a decrease in sales. However, during 2017, European sales increased by 6% (figure 18).
France fast food industry has a total size of $14 bn, a value that has been stable in the last 5 years. When analyzing stores, it increased from 23,839 units to 24,728 last year, with burger fast food representing a total of 2,068 stores. Burger fast food sales, generated in 2017 almost 50% of sales in the fast food industry. McDonald’s is currently the leader in this market with a 55% share, according to Passport research.
Germany reached a size of $15 bn in 2017, being stable in the last 5 years. It increased its number of units in 183 stores to 43,181 units in the last year, from Figure 16: US 2017 Outlets Split per
Type of Fast Food
Source: Passport Euromonitor 8 363 86 999 75 519 18 530 29 609 2 476 17 221 18 227 582 6 736 9 063
Asian Bakery products Burger Chicken Convenience Fish Ice cream Latin American Middle Eastern Pizza Other
Figure 17: US 2017 Revenues Split per Type of Fast Food
Source: Passport Euromonitor
3.6% 22.2% 44.0% 11.1% 4.6% 0.7% 2.3% 8.5% 0.1% 1.3% 1.5%
Asian Bakery products
Burger Chicken
Convenience Fish Ice cream Latin American Middle Eastern Pizza Other
Figure 18: Europe Fast Food Market Size ($bn) and Growth
Source: Passport Euromonitor
-20.00% -10.00% 0.00% 10.00% 80 100 120
Europe Market Size Growth
which burger fast food represents 2,335 stores and almost 40% of the share in this industry. McDonald’s is estimated to have a 29% market share in this country. Lastly, UK has a size of $22 bn in 2017, $3 bn less than the value seen in 2014. Total units decreased last year from 38,479 to 38,402 stores, where burger chains have 2,232 stores. Sales wise, burger fast food generated about 20% of sales in this industry. McDonald’s is currently the market leader with a market share of 14%.
China and Japan
China and Japan belong to the Asia Pacific region, which generates sales of $242 bn. Sales have been increasing in the last years, with growth rates of above 3%, except for the year 2015, which saw a small growth rate of 0.74% (figure 19). Japan generated $44 bn sales in 2017, with 7-Eleven as its market leader with a 26% share. It increased its number of units by 940 stores to 92,233 units where burgers fast food represents a small portion of 5,336 stores. Also, burger fast food only generated 12% of total fast food sales, as convenience stores currently lead this market.
China alone generates 53% of the Asia Pacific region in terms of fast food sales, reaching a value of $129 bn in 2017. It is characterized as a highly fragmented market, where Yum! leads the way with a market share of 5%. There are currently 1,674,300 stores, which have been increasing over the last years. Burger chains represent 4,000 stores, with Asian fast food accounting for 1,607,200 units and 96% of the sales.
Main Comparables
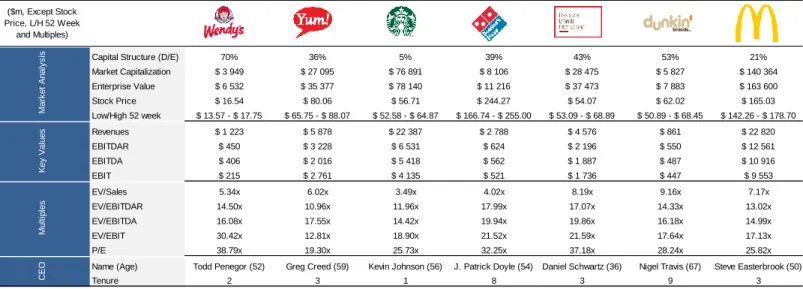
The first step in selecting a peer group, is to establish or define the industry, which in this case is the fast food industry. Then, the number of peers is narrowed based on geographical location, financials, such as sales and others characteristics, like for example products offering or business models (franchises). Having all these elements established, the following companies were selected as McDonald’s key peers’ group (figure 20).
Figure 19: Asia Pacific Fast Food Market Size ($bn) and Growth
Source: Passport Euromonitor 0.00% 5.00% 10.00% 150 200 250
Asia Pacific Market Size Growth
Wendy’s
Wendy's is an American fast food company founded in 1969. It offers similar products to McDonald's, such as hamburgers, chicken burgers, salads or fries. It also offers a menu focused on children, bakery products and breakfast. As of December 31, 2017, the company was comprised of 6,634 restaurants, of which 337 were company owned, being therefore 95% franchised, the same target that McDonald's wants to achieve. Wendy’s manages and reports its businesses by geography, even though its main segment is North America (99% of units are located in this segment). The country with most stores outside North America is Indonesia, with 83 restaurants. In total, excluding the North American segment, the company has 504 stores.
YUM!
Yum! is an American fast food company, which was a spun-off from PepsiCo in 1997 and is composed of 3 brands well known in this industry: KFC (Kentucky Fried Chicken), Pizza Hut and Taco Bell. The company is based in Kentucky and has over 45,000 restaurants spread over 135 countries, as of December 31, 2017.
KFC is located in 131 countries, operating 21,487 units, of which 97% are franchised. It focuses on the offering of chicken products. Pizza Hut is located in 106 countries, having a total of 16,748 units, of which 99% are franchised. It focuses on the delivery and casual dining of pizza. Taco Bell is the smallest brand in terms of units, having
Capital Structure (D/E) 70% 36% 5% 39% 43% 53% 21%
Market Capitalization $ 3 949 $ 27 095 $ 76 891 $ 8 106 $ 28 475 $ 5 827 $ 140 364 Enterprise Value $ 6 532 $ 35 377 $ 78 140 $ 11 216 $ 37 473 $ 7 883 $ 163 600 Stock Price $ 16.54 $ 80.06 $ 56.71 $ 244.27 $ 54.07 $ 62.02 $ 165.03 Low/High 52 week $ 13.57 - $ 17.75 $ 65.75 - $ 88.07 $ 52.58 - $ 64.87 $ 166.74 - $ 255.00 $ 53.09 - $ 68.89 $ 50.89 - $ 68.45 $ 142.26 - $ 178.70 Revenues $ 1 223 $ 5 878 $ 22 387 $ 2 788 $ 4 576 $ 861 $ 22 820 EBITDAR $ 450 $ 3 228 $ 6 531 $ 624 $ 2 196 $ 550 $ 12 561 EBITDA $ 406 $ 2 016 $ 5 418 $ 562 $ 1 887 $ 487 $ 10 916 EBIT $ 215 $ 2 761 $ 4 135 $ 521 $ 1 736 $ 447 $ 9 553 EV/Sales 5.34x 6.02x 3.49x 4.02x 8.19x 9.16x 7.17x EV/EBITDAR 14.50x 10.96x 11.96x 17.99x 17.07x 14.33x 13.02x EV/EBITDA 16.08x 17.55x 14.42x 19.94x 19.86x 16.18x 14.99x EV/EBIT 30.42x 12.81x 18.90x 21.52x 21.59x 17.64x 17.13x P/E 38.79x 19.30x 25.73x 32.25x 37.18x 28.24x 25.82x
Name (Age) Todd Penegor (52) Greg Creed (59) Kevin Johnson (56) J. Patrick Doyle (54) Daniel Schwartz (36) Nigel Travis (67) Steve Easterbrook (50)
Tenure 2 3 1 8 3 9 3 C E O M u lt ip le s M a rk e t A n a ly s is K e y V a lu e s ($m, Except Stock Price, L/H 52 Week and Multiples)
Figure 20: Peers’ Group Data as of 2017 in $m, Excluding Current Stock Price, L/H 52 Week and Multiples
6,849 units spread over 27 countries, of which 90% are franchised. It offers a different variety of products, such as tacos, nachos and others.
Starbucks
Starbucks is an American coffee company founded in Seattle in 1971, with more than 27,000 stores worldwide as of 2017. With coffee as its main product offering, it is highly focused in purchasing and roasting high-quality coffees as well as handcrafted coffee. It also offers other products, such as tea, beverage and snack products. It also sells some of its product through other channels such as grocery stores.
It is divided in 4 segments: Americas, including North America and Latin America; China/Asia Pacific; EMEA; and Channel Development. In the Americas, it has 16,559 units, being 43% of them refranchised. In the China/Asia Pacific, it has a total of 7,479 units, with 59% franchised. In EMEA, has its most franchised segment, with 83% franchised stores out of a total of 2,974.
Domino’s Pizza
Domino’s Pizza is an American pizza restaurant chain which was established in 1960. According to its CEO, J. Patrick Doyle, Domino’s has the greatest market share in pizza at a global level. It focuses on delivery and casual dining of pizza, selling on average more than 2.5 million pizzas per day. In terms of geographical presence, the company has more than 14,000 stores spread over 85 markets around the world.
The company is divided by 3 segments: domestic stores, international franchise, and supply chain. The first segment is related to the US, where the company has 5,195 franchised stores and 392 company owned, having therefore 93% of their total units franchised. In the international segment, they have a total of 9,269 stores, being all of them franchised, as the segment name suggests.
Restaurant Brands International
Restaurant Brands International (RBI) is a Canadian corporation formed in 2014 after a $12 bn deal was completed in the merge of Burger King and Tim Hortons. Besides these 2 brands, the company also owns Popeyes, an acquisition announced in early 2017. The company operates as well in the QSR industry, generating $30 bn in systemwide sales and having more than 24,000 restaurants in the end of 2017. The company operates in a franchise agreement as well, having approximately 100% of their units franchised.
The Burger King brand is probably the greatest competitor of McDonald’s, due to its very similar products offering and business model. Tim Hortons focuses on coffee, hot and cold beverages and other snacks. Popeyes focuses on fried chicken fast food.
Dunkin’ Brands
Dunkin’ Brand is an American fast food company which runs 2 main brands: Dunkin Donuts and Baskin-Robbins, which both date back to the 1940s. It focuses on the serving of cold and hot coffee, as well as baked goods and ice cream. It currently has more than 19,000 units spread over 60 countries. It runs almost as a 100% franchised model, having more than 11,500 units of Dunkin’ Donuts and more than 7,600 Baskin-Robbins units.
Key Growth Drivers
Experience of the Future (EOTF)
The EOTF is a main pillar of the Velocity Growth plan, introduced earlier. It is a way of modernizing the restaurant service experience and develop the brand for the clients. It has the objective of driving incremental visits to each store while at the same time increasing the average check (see figures 21 and 22). By 2017, the Company had already deployed this feature in about 33% of the restaurants worldwide, expecting at the same time half of the US stores to be enhanced with this feature by the end of 2018.
These bring a variety of features to increase future Company sales: (1) instead of ordering only in the traditional counter service, customers can now order through double-sided touch screen digital kiosks. It is also possible to order ahead with the mobile app in order to save time when picking up their menus; (2) customers can now also pay on the digital kiosks machines or through the mobile app; (3) bigger product customization, enabling customers more power in designing their order; (4) table service, through the usage of a table-location technology, which allows employees to deliver customers’ orders directly to their tables; and (5) digital menu for drive thru.
This feature represents more than a simple upgrade of the Company stores. According to McDonald’s CEO, Steve Easterbrook, it represents a “journey toward mass personalization”. This is what EOTF represents to the Company, a way of making it more valuable to their clients.
Figure 22: US Composites Evolution
Source: Company Data -5.00% 0.00% 5.00% 2014 2015 2016 2017 US CS US Traffic US Price Mix
Figure 21: Global Composites Evolution
Source: Company Data -5.00% 0.00% 5.00% 10.00% 2014 2015 2016 2017 Global CS Global Traffic Global Price Mix
Digital
Digital represents another key stone for future Company growth, being intrinsically related with EOTF. It represents a key investment by the Company, since it is through the evolution of the technology platform that the Company simplifies how clients place their order, pay and are served. It also represents the investment the Company is making in its global mobile app.
When analyzing globally, we can see that this is a trend being followed by consumers. As shown in figure 23, the percentage of online ordering has been growing in the last 5 years, increasing from 5% in 2013 to almost 10% in 2017. Putting into a matter of perspective and according to the research of Euromonitor, $93 bn restaurant sales worldwide went through online ordering channels in 2015, from which $42 bn were from fast food. One of the key insights shown in the last 3 years is that consumers are steering away from ordering via their computers to ordering via mobile phones. This is where McDonald’s mobile app enters in action, which has in the US alone 20 million users. This app lets the user order and pickup in 3 ways: through the curbside pickup, where the customer gets the order delivered to a curbside parking spot; inside the restaurant, enabling the user to save time when reaching to a store; and by the drive thru, where the client checks in at the drive thru speaker to pick up his order. Furthermore, this app enables the customers to find nearby stores and to be aware of all available promotions.
Delivery
Through delivering orders to customer’s homes, the Company expects to even increase the convenience customers desire, as well boosting its sales. As at the end of 2017, the Company is already delivering from over 10,000 restaurants. By enabling this feature to its clients, the Company expects a bigger expenditure by clients as well improved satisfaction rates. Through 2018, the Company will continue to increase the number of stores offering delivery, as well as increasing awareness and demand in areas where it currently offers this feature.
Delivery could bring a problem to the Company which is the cannibalization of sales. However, according to the Company, 60% of delivery orders are coming in the evening and late hours, suggesting that it could offset the cannibalization that might happen. Moreover, average checks tend to be higher when placing online orders, whit almost double average check, according to the Company.
Figure 23: Evolution of Online vs Offline Ordering
Source: Passport Euromonitor 5% 6% 6% 7% 9% 95% 94% 94% 93% 91% 0% 20% 40% 60% 80% 100% 2013 2014 2015 2016 2017 Online Offline
McDonald’s was able to deliver this by doing partnerships with third-party deliver providers, especially with UberEats. This will enable the Company to reach places where the app is already located, gaining therefore new consumers that are already using the UberEats application.
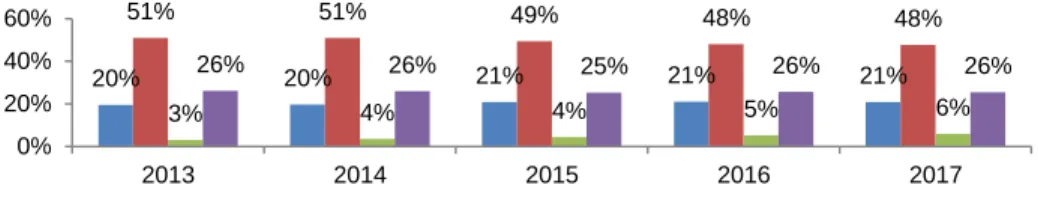
As a matter of fact, and similarly to online orders, this new feature of delivery is growing on a yearly basis. As shown in figure 24, customers seem to be shifting away from eating in restaurants to order their meals home. Eat-in weight has decreased from 51% in 2013 to 48% in 2017, while home delivery increased from 3% in 2013 to 6% in 2017, practically in the same magnitude. By tapping this market, McDonald’s is indeed betting in a segment with good growth potentials, which can offset the decrease in the number of people eating in the Company’s stores.
Dollar Menu
The $1 $2 $3 dollar menu introduced in 2018 is another step in gaining sales, through regaining lost consumers and offering more accessible menus to current ones. Basically, the customer has the option to choose items that range from $1, like the cheeseburger, to $3 like a Happy Meal.
In each price point, the customer is able to choose between a chicken burger, beef burger, breakfast item or a beverage. This is crucial in reaching out more customers, as the Company is not only offering value menus, but also enabling this menu to be attractive during the day. This dollar menu also helps as an additive product to add at the end of an order, as well as creating a family meal sharing experience.
Leveraging the McCafé Brand
At the end of 2016, the Company revamped its McCafé brand, which generated US sales of $4 bn in that year, in order to ensure all coffees are made through sustainable sourced beans. It is expected new and upgraded coffee machines in its
Figure 24: Global Evolution of Drive-through, Eat-in, Home Delivery and Takeaway Split
Source: Passport Euromonitor
20% 20% 21% 21% 21% 51% 51% 49% 48% 48% 3% 4% 4% 5% 6% 26% 26% 25% 26% 26% 0% 20% 40% 60% 2013 2014 2015 2016 2017
stores with features to enable a wider variety of drinks, as well as special deals. It is worth mentioning that McCafé is present in the dollar menu introduced on January 2018.
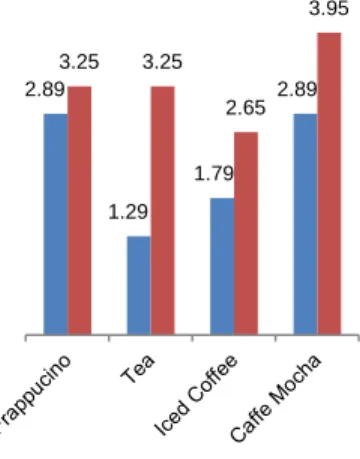
This acts as challenge to companies more established in this segment, such as Starbucks or Dunkin’ Donuts. As seen in figure 25, McDonald’s offers lower prices than one of its main competitors in the coffee sector, which is Starbucks. This is a way for the Company to compete in this market, in order to drive traffic, build loyalty and boost margins.
Valuation
Key Drivers
Stores Expansion
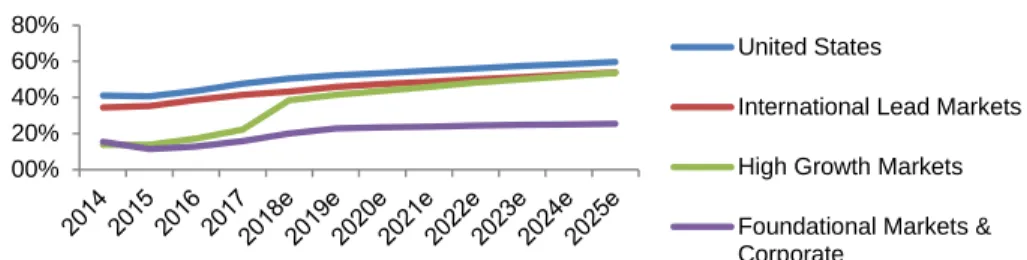
Stores expansion is a main value driver of McDonald’s, by being one of the core key drivers of revenues. In order to estimate stores evolution, we decided to look individually at each segment of McDonald’s, which would give us the total estimated number of stores, either franchised or Company owned. The procedure was done similarly for all segments, taking into consideration that the Company expects to be 95% franchised in the long term on a global level: analyze historical growth of net new units and based on that, plot the estimated stores, considering Company information and our own research estimates.
In terms of overall net new units and percentage franchising evolution per segment (figures 26, 27, 28 and 29), the United States is near the franchised Company target and the Foundational Markets & Corporate is already exceeding that target. Therefore, for these 2 segments it is only expected a marginal increase in the number of net new units and the franchised percentage.
In the International Lead Markets segment, the franchised percentage is expected to increase from 87% in 2017 up to 92% in 2022, even though the net new units will just increase slightly.
The High Growth Markets segment, is the segment where the changes are expected to be deeper, since it is focused on geographical areas which are exposed to high potential sales growth, like for example China, which is the main market in this segment. This segment has seen the biggest increase of all segments in its refranchising percentage, since it increased from 48% in 2016 to 81% in 2017, Figure 26: US Projected Stores
Evolution
Source: Analyst Estimation
93% 94% 95% 96% 97% 0 5 000 10 000 15 000 Franchise Stores
Company - Operate Stores % Franchised
Figure 27: ILM Projected Stores
86% 88% 90% 92% 94% 0 2 000 4 000 6 000 8 000 Franchise Stores
Company - Operate Stores % Franchised
Figure 25: $ Price Comparison 2017 in the US
Source: Company and Starbucks Data 2.89 1.29 1.79 2.89 3.25 3.25 2.65 3.95 McDonald's Starbucks
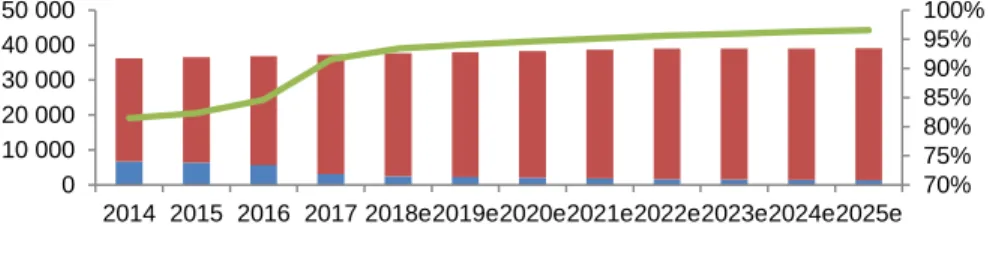
majority of the China and Hong Kong business to CITIC and Carlyle Group. According to the private equity group, “this strategy aims to drive double-digit sales growth in each of the next five years by increasing the number of restaurants from 2,500 to 4,500”. By 2022, we expect a 95% refranchising target in this segment. Globally, based on the analysis made per segment, we expect to achieve the Company’s target of 95% of franchised units in 2020, and almost 97% in 2025, as seen in figure 30. By 2025, we also expect to have 39,083 stores, 1,842 more stores than in 2017.
Sales
In order to calculate global sales, we have to take into account the comparable sales and sales per store. The former is important because it measures the annual revenues performance from stores that have been open for one year or more, thus eliminating the effects of new opened and closed stores. Then, to calculate sales, we analyzed historical data and forecasted certain variables, streamlining atypical values and the closed stores, taking in consideration the recent menus introduced by the Company, the revamp of McCafé and the 3 factors of the new Velocity Growth Plan – EOTF, Delivery and Digital – aiming to increase the average sales per store and the guest counts.
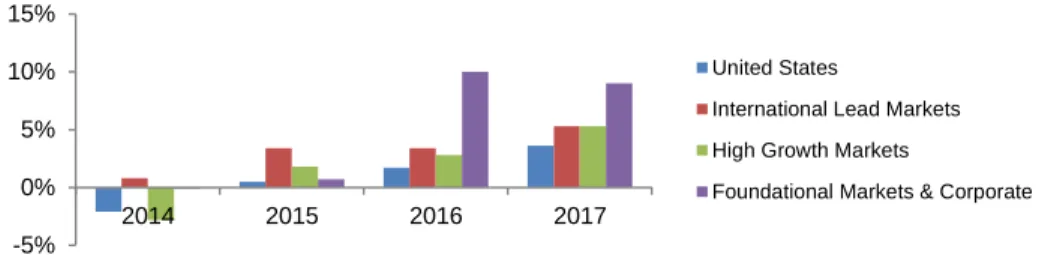
Comparable sales (CS)
In order to estimate these, we analyzed the historical trend of comparable sales as well as the estimates provided by the Company and our own research. Figure 31 shows the historical evolution in the last 4 years.
Comparable sales represent a mix of 2 variables: Guest counts and average check (which is driven by changes in prices and product mix).
Figure 28: HGM Projected Stores Evolution
Source: Analyst Estimation
86% 88% 90% 92% 94% 0 5 000 10 000 Franchise Stores
Company - Operate Stores % Franchised
Figure 29: FM&C Projected Stores Evolution
Source: Analyst Estimation
98% 99% 99% 100% 0 5 000 10 000 15 000 Franchise Stores
Company - Operate Stores % Franchised
Figure 30: McDonald’s Projected Stores Evolution
Source: Analyst Estimation
70% 75% 80% 85% 90% 95% 100% 0 10 000 20 000 30 000 40 000 50 000 2014 2015 2016 2017 2018e2019e2020e2021e2022e2023e2024e2025e
-5% 0% 5% 10% 15% 2014 2015 2016 2017 United States
International Lead Markets High Growth Markets
Foundational Markets & Corporate
Guest counts and average check are expected to increase, through the Velocity Growth Plan, explained before. The first is Delivery, through the partnership with UberEats. In 2017, the Company added this feature to 7,000 restaurants in 21 different countries, and is now delivering through 10,000 stores. These, according to the Company, “tend to realize a higher average check and a high customer satisfaction rating”. It is more convenient as well, increasing even further the guest counts.
The Experience of the Future (EOTF) is another key pillar of the plan to increase comparable sales. The management team believes that these modernization investments will increase the guest counts and average check – for example in 2017 CS increased in the US 3.6%, due to an increase of 1% in guest counts and 2.6% in changes in price and product mix, partially due to the innovations made.
The last pillar is Digital, which is increasing CS due to synergies with EOTF, as the Company is focusing on the relationship with clients through a more efficient use of technology, enhanced through the McDonald’s application, which has 20 million registered users in the US alone.
Other elements increasing CS are the dollar menu and the focus on McCafé. The first element has the objective of offering a more valued based menu to customers, through the offering of $1, $2 and $3 Dollar Menu. The focus on McCafé, as explained before, will help convert casual customers to more committed ones, a key objective of the Velocity Growth Plan.
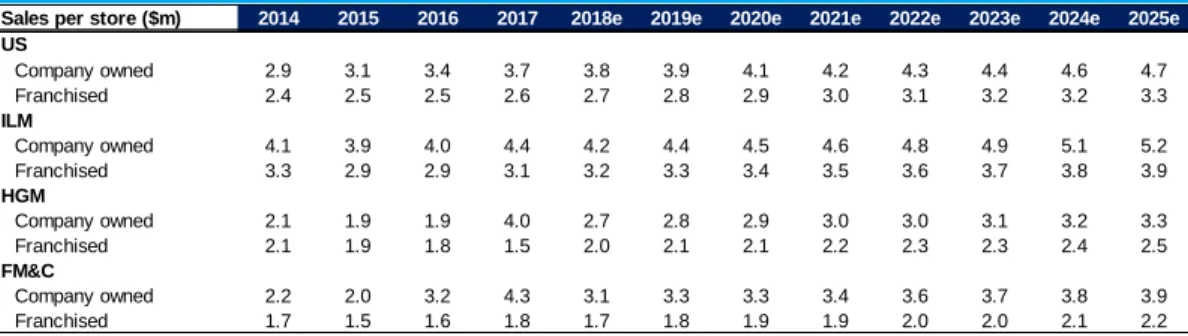
Sales per store (SpS)
Sales per store represents the main key driver of sales. Figure 32 highlights the historical and projected SpS.
Figure 31: Historical CS Evolution per Segment
The projections were based on 2 factors: Historical growth and estimated comparable sales. Joining these 2 would yield the estimated SpS in the future years. In order to estimate revenues generated from franchise agreements, it was taken into account the % the Company receives from franchise sales. Below we have figure 33 with projected systemwide sales and Company total revenues, which continued to decrease in 2018 - 2020, due to the increased weight of the franchised stores, but afterwards start to increase slightly, when the franchise target tends to stabilize.
Operating Margin Analysis
Operating expenses are divided into 5 main types: Food & paper, payroll & employee benefits, occupancy and other operating expenses, selling, general & & administrative (SG&A) and other operating income / expense. The first 2 type of expenses are only related to the Company owned restaurants, being the others common to both Company owned and franchised restaurants.
Food & paper is estimated through an analysis based on the Company store revenues, as both go hand by hand. The global evolution, based on the estimated revenues, is shown in figure 34, in which we estimate a decrease in this driver, in line with recent trend evolution.
Payroll & employee benefits are estimated through an analysis based on the average cost per Company store.
Sales per store ($m) 2014 2015 2016 2017 2018e 2019e 2020e 2021e 2022e 2023e 2024e 2025e
US Company owned 2.9 3.1 3.4 3.7 3.8 3.9 4.1 4.2 4.3 4.4 4.6 4.7 Franchised 2.4 2.5 2.5 2.6 2.7 2.8 2.9 3.0 3.1 3.2 3.2 3.3 ILM Company owned 4.1 3.9 4.0 4.4 4.2 4.4 4.5 4.6 4.8 4.9 5.1 5.2 Franchised 3.3 2.9 2.9 3.1 3.2 3.3 3.4 3.5 3.6 3.7 3.8 3.9 HGM Company owned 2.1 1.9 1.9 4.0 2.7 2.8 2.9 3.0 3.0 3.1 3.2 3.3 Franchised 2.1 1.9 1.8 1.5 2.0 2.1 2.1 2.2 2.3 2.3 2.4 2.5 FM&C Company owned 2.2 2.0 3.2 4.3 3.1 3.3 3.3 3.4 3.6 3.7 3.8 3.9 Franchised 1.7 1.5 1.6 1.8 1.7 1.8 1.9 1.9 2.0 2.0 2.1 2.2
Sales ($m) 2018e 2019e 2020e 2021e 2022e 2023e 2024e 2025e
Systemwide sales 93 496 96 921 100 310 103 831 107 500 110 593 113 799 117 122 Total revenues 20 338 20 244 20 191 20 274 20 396 20 490 20 618 20 778 US 8 000 7 936 7 896 7 874 7 873 7 889 7 922 7 971 ILM 6 845 6 716 6 614 6 620 6 636 6 663 6 703 6 752 HGM 3 735 3 813 3 901 3 999 4 107 4 104 4 105 4 110 FM&C 1 758 1 779 1 781 1 781 1 780 1 833 1 888 1 945
Figure 32: Historical and Projected SpS per Segment
Source: Company Data and Analyst Estimation
Figure 33: McDonald’s Projected Sales and Revenues
Source: Analyst Estimation
Figure 34: Historical and Projected Food & Paper Cost Evolution
Source: Company Data and Analyst Estimation
25% 30% 35%
Food & paper as % of company store revenue
Occupancy and other operating expenses represent mainly the rent and the depreciation the Company is incurring. This cost belongs to both Company owned stores and franchise, since in the conventional franchises the Company owns the land and building. Estimation of this cost was done similarly to the payroll & employee benefits, through an analysis based on the historical average cost per Company store.
The SG&A expenses were estimated by segment based on the systemwide sales (sales at all restaurants – either the Company owned stores or franchised stores). It is worth mentioning that these sales are not equal to the Company total revenues, as McDonald’s only receives a % of franchised sales as revenues. This driver was used in accordance with what is mentioned in the Company 2017 annual report, due to the fact that these expenses are incurred to support the overall McDonald's business. Concerning the other operating income / expense, estimated at the Company level, we projected only the gains on sales of restaurants business, based on the average gains generated by the Company in the last 3 years, not considering the other items, because they are mostly related to equity losses/gains of unconsolidated affiliates and impairment and other charges/gains, which were historically erratic. The global results are presented in figure 35, including the Company owned and franchised gross margins, where we can see the higher contribution from the latter.
As we can see, the total operating income is expected to grow in the future years, with a growing operating margin that reflects the efforts the Company is doing in reducing costs. From 2017 to 2018 it is expected to decrease operating income, as in 2017 the Company reflected the gain on the sales of its business in China and Hong Kong by approximately $850 m.
The results per segment, excluding other operating income / expense are presented Figure 35: McDonald’s Historical and Projected Operating Income ($m) and Margin Evolution, Globally and per Business Type
Source: Company Data and Analyst Estimation
00% 20% 40% 60% 80% 100% 0 5 000 10 000 15 000
Total Operating Income (Loss) $m Global Operating Margin %
This figure highlights the operating income margin growth expected in each segment. Both the US and the ILM segments tend to grow in line with recent trend evolution. In the HGM, we are expecting a higher increase in its margin, through a more efficient cost control of payroll & employee benefits as well as occupancy costs. In the FM&C we expect a moderate increase in its operating income margin, as we are being conservative in SG&A evolution in this segment. This comes from the belief that the Company will not reduce significantly the SG&A due to being a segment composed of remaining markets and the fact that corporate activities are also reported here.
Capital Expenditures (Capex)
Capital expenditures represent an important part of any business, as it is important to the long term growth and sustainability of any company. In McDonald’s case, we separated capex into 2 main components: Maintenance capex and growth capex (see figure 37 for the projected capex):
Maintenance capex is a result of expenditures in technology, maintenance in Company owned stores, remodeling of franchise and owned stores and investments in the experience of the future (EOTF), which is a key component of the Company strategy.
Growth capex, as the name suggests, are the new units projected, already identified in the stores expansion section above, either Company owned stores or franchised stores. These new stores are assumed to incorporate the EOTF.
Year 2018 represents a strong investment by the Company which expects $2.4 bn capital expenditures. This is due to the strong investment made by the Company in the EOTF, as well as remodeling and building of new stores to achieve its 95% target. As the investments done in EOTF start to fade and the Company starts achieving its target of 95% we expect the Company to start stabilizing in a capex range of $1.2 bn. We also target the capex in technology to be stable in the range of
00% 20% 40% 60% 80% United States
International Lead Markets High Growth Markets Foundational Markets & Corporate
Figure 36: Segments Operating Margin Evolution, Excluding Other Operating Income/Expense
$150 m in the long term, as the Company focus in this area is expected to continue in the years to come.
In order to calculate depreciation, it was calculated as a % of net PP&E, since it remained historically stable when looking at this ratio. Note that this cost was already included in the occupancy and other operating expenses.
Working Capital
For companies in the retail industry, the working capital requirements are usually lower than the ones for other type of industries (e.g. a manufacturing firm). That is the case of McDonald’s, with a very low cash conversion cycle, which is lower when comparing against some of its peers, as seen on figures 38 and 39. As we can see, Starbucks has a bigger conversion cycle, while both Wendy’s and Yum! have been increasing over the last 4 years, similarly to McDonald’s. We don’t expect this increase to continue in the future, since McDonald’s has a strong working capital management and worldwide power. Therefore we assumed the same 4 days cash conversion cycle for the future, based on the year 2017 (figure 39).
Shareholders´ Return
As explained briefly before, the Company pays its shareholders through a combination of dividends and shares repurchases, proposing for the period 2017 to
Capex map ($m) 2018e 2019e 2020e 2021e 2022e 2023e 2024e 2025e
Technology & Other 150 150 150 150 150 150 150 150
Maintenance Capex 149 135 122 112 102 94 87 80
U.S. Franchisee Remodel Capex 707 655 547 274 55 55 55 55
U.S. Franchisee EOTF Capex 291 228 131 10 10 10 10 10
U.S. Company-owned Remodel Capex 78 65 49 22 5 4 4 3
U.S. Company-owned EOTF Capex 32 22 12 1 1 1 1 1
Other Company-owned Store Builds 218 198 178 162 145 135 122 112 System Conventional Franchise Builds 805 805 804 802 799 802 806 809
Total Capex 2 431 2 258 1 993 1 533 1 267 1 251 1 235 1 220
Total Maintenance Capex 1 408 1 255 1 011 569 323 314 306 298
Total Growth Capex 1 023 1 003 982 964 945 938 929 921
MCD Working Capital 2014 2015 2016 2017 2018e 2019e 2020e 2021e 2022e 2023e 2024e 2025e
Days Receivables 17 18 21 28 28 28 28 28 28 28 28 28
Days Payables 21 20 21 25 25 25 25 25 25 25 25 25
Inventory Days 3 2 2 2 2 2 2 2 2 2 2 2
Cash Conversion Cycle (Days) -2 0 2 4 4 4 4 4 4 4 4 4
Figure 37: Estimated Capex Requirements
Source: Company Data and Analyst Estimation
Figure 38: McDonald’s Peers’ WC Evolution
Source: Companies Data
Figure 39: McDonald’s WC Evolution
Source: Company Data and Analyst Estimation
Peers' CCC 2014 2015 2016 2017
Domino's Pizza 8 7 6 8
Starbucks 32 29 29 28
Wendy's -7 -2 8 16
was assumed they would pay $8.1 bn for each of the following 2 years, in order to pay the total they projected. In the 3 years following 2019, we assumed they would return to the shareholders the same value as for the period 2017 – 2019, $8 bn each year and from there on the same annual target. We expect the Company to preserve its current investment grade credit rating, since it will be able to maintain the key metrics assessed by the credit rating agencies, namely the “Debt / EBITDA” ratio in the 3.0 – 3.3 range over the long term (figure 41 below).
In order to estimate dividend payments, we analyzed the dividend payout ratio (DPR). Based on the historical range from 2014 to 2017, and taking into account its decrease, it is estimated a 53.58% DPR in 2018. For the following years, we assumed a DPR of 51.12%, being this the industry average, according to Damodaran’s estimation (Dividend Fundamentals by Sector (US)), which is consistent with the expected increase in the dividend amount at least once every year, as referred in the shareholder structure and stock analysis section above (figure 40).
These dividend payout ratios would enable to estimate dividend payments based on the estimated net income. After having this procedure done, the share repurchase was calculated as we already assumed the total shareholder’s return.
Long-Term Debt Forecast
In order to estimate future debt requirements, it was taken into account the free cash flow (including non-core), the financing cash flow (excluding additional needed debt and financial results) and the shareholders return explained before.
The idea here is based on the assumption that the Company will require extra debt in order to fulfill its shareholder’s return. This extra debt is calculated by the difference of shareholder’s return with the free cash flow and the financing cash flow (excluding additional needed debt and financial results). This difference would yield the debt amount needed, excluding financial result and tax shield effect. Then, we adjusted this value for the estimated financial result and tax shield effect, and this would give us the future estimated debt (figure 41).
Return on Invested Capital
Return on invested capital (ROIC), as the name suggests, measures the return created to both shareholders and debtholder based on the total Company invested Figure 40: McDonald’s Historical and
Forecasted Dividends ($m) and DPR
Source: Companies Data and Analyst Estimation 00% 10% 20% 30% 40% 50% 60% 70% 80% 0 500 1 000 1 500 2 000 2 500 3 000 3 500 4 000
2014 2016 2018e 2020e 2022e 2024e
Dividends paid DPR
Figure 41: McDonald’s Historical and Projected Debt ($bn) and Debt/EBITDA
Source: Company Data and Analyst Estimation 15 24 26 30 32 35 37 38 39 40 40 41 2x 3x 3x 4x 4x 5x 5x 0 5 10 15 20 25 30 35 40 45 2 0 1 4 2 0 1 5 2 0 1 6 2 0 1 7 2 0 1 8 e 2 0 1 9 e 2 0 2 0 e 2 0 2 1 e 2 0 2 2 e 2 0 2 3 e 2 0 2 4 e 2 0 2 5 e
Debt end of the year Debt/EBITDA
Figure 42: McDonald’s Historical and Projected ROIC Evolution
Source: Company Data and Analyst Estimation 20% 22% 24% 22% 26% 26% 27% 28% 29% 30% 31% 33% 00% 05% 10% 15% 20% 25% 30% 35% ROIC
capital. Thus, the higher it is and keeping everything else constant, the higher the firm value will be (figure 42).
ROIC has a big expected increase in 2018, mainly due to the fiscal reform implemented by the US government, which will enable big firms to pay less taxes. Furthermore, this increase is explained by the growth in operating margins, due to higher cost control and to the evolution to an even higher refranchised model, as this segment has higher margins than Company owned ones. In the long term, we expect the ROIC to increase even further, reaching a value in the range of 30%, reflecting the turnaround and the Velocity Growth plans.
In terms of decomposition, it’s possible to split ROIC in its operating margin, asset turnover and (1-tax rate), which allows us to understand better its evolution.
As seen in figure 43, the main driver in 2018 is the decrease in the tax rate, as we just explained. This component is expected to be constant in the following years. From there on, we have 2 situations seen in the 2019 to 2021 and from 2022 to 2025. From 2019 to 2021, we see low increases in ROIC, as while operating margin is increasing, asset turnover is not. This decrease is explained due to the declining revenues and high investments in Capex due to EOTF. From 2022 to 2025, ROIC starts increasing steadily as asset turnover starts recovering due to stabilizing revenues and Capex investments, while operating margins continues to increase.
Firm Valuation
Weighted Average Cost of Capital
Cost of Equity
Cost of Equity is a key factor in order to estimate WACC. Therefore, we used CAPM (Capital Asset Pricing Model) to estimate it.
The first factor is the risk-free rate. Since McDonald’s is headquartered in the US and the valuation is being done in USD, it was used a risk free rate based on that same currency. The one used was as 10 year US government bond based, currently yielding 3.1%.
ROIC Breakdown 2014 2015 2016 2017 2018e 2019e 2020e 2021e 2022e 2023e 2024e 2025e
(1) EBIT/Revenues = Operating Margin 29.04% 28.94% 31.76% 36.76% 43.16% 45.48% 47.00% 48.35% 49.79% 51.02% 52.21% 53.37% (2) Revenues/ Invested Capital = Asset Turnover 1.08 1.08 1.13 0.97 0.82 0.80 0.78 0.78 0.80 0.81 0.82 0.84 (3) (1- Tax Rate) 64.57% 68.65% 67.86% 60.46% 73.00% 73.00% 73.00% 73.00% 73.00% 73.00% 73.00% 73.00% ROIC =(1)*(2)*(3) 20.19% 21.51% 24.44% 21.63% 25.96% 26.40% 26.74% 27.64% 28.95% 30.14% 31.38% 32.68%
Figure 43: ROIC Breakdown
The second is the market risk premium (MRP), which is the premium above the risk-free rate that investors demand when investing in the stock market. The value used was 5.08%, which is a value estimated by Damodaran (Country Default
Spreads and Risk Premiums).
Then we have the country risk premium (CRP). This factor is used since the Company has a global presence, being therefore inherent to the risks presented in the countries where it operates. The list of countries where it operates ranges from the United States, which has a CRP of 0%, to Brazil, which has a CRP of 3.46%, according to Damodaran (Country Default Spreads and Risk Premiums).Therefore, in order to calculate McDonald’s CRP, we decided to use the number of stores located in each country as a weight to use in the corresponding countries CRP. The result yielded a global CRP of 0.73%.
To finalize the CAPM, we still need the Beta which measures the Company’s risk. This was calculated doing a regression against the S&P 500 Index, using weekly share prices from the last 3 years. This gave us a result of 0.66, based on weekly share prices from May 2015 to May 2018. This Beta was used as it has been somewhat consistent in the latest years, as figure 44 suggests. By using this Beta, we are assuming its current capital structure will be maintained, explained in the Capital Structure Analysis section. Its Beta was 0.60 in the beginning of 2015, and from there on it reached a maximum of 0.71 and a minimum of 0.52. Statistically, this Beta is significant on a 95% confidence level, with a confidence interval of 0.5 to 0.8. After having all the inputs, Cost of Equity was estimated at 7.20%.
Cost of Debt
Cost of debt calculation was based on the following elements: Yield to maturity (YTM) on a 10 year Company bond and probability of default (PD) and loss given default (LGD).
The yield to maturity used was based on a corporate bond, which traded at an YTM of 4.17%. The PD and LGD, which would take into account the Company’s credit rating, were provided by the credit rating agencies, Standard & Poor's and Moody’s. Based on this, the Company would have a PD of 1.26% and a LGD of 56.48% (based on the recovery rate of 43.52%), yielding a final cost of debt of 3.46%.
Capital Structure Analysis
A key aspect of the Weighted Average Cost of Capital, besides the cost of debt and equity, is the capital structure. It is important to select the appropriate D/E, as this is Figure 44: McDonald’s Weekly Rolling
Beta on a 3 Year Basis
Source: Bloomberg and Analyst Estimation 0.30 0.35 0.40 0.45 0.50 0.55 0.60 0.65 0.70 0.75 2015 2016 2017 2018
the capital structure assumed for perpetuity when valuing McDonald’s. In figure 45 we have the capital structure of the Company being analyzed, as well as its peers and industry, based on market values.
From this figure, the first thing we can see is that McDonald’s has a lower capital structure than the comparable peers (except for Starbucks). However this does not come as a surprise, due to the Company’s solid financial structure. Another number that catches our attention is that McDonald’s currently has the same D/E as the average of the industry, which is 21% according to Damodaran (Debt Fundamentals
by Sector (US)) and, therefore, we might question if we can use the Company’s
current D/E for the future.
To have a shift in the capital structure 2 situations would have to happen:
1) Debt would have to increase, at least more than any increase in market capitalization, or the other way around – this is not expected to happen, even with the expected increase in the incremental debt throughout the years, because it is intrinsically related to shareholders return. Therefore, keeping everything else constant, any debt increase should be followed by an expected increase in market capitalization.
2) Equity would have to decrease, at least more than any decrease in debt, or the other way around – this scenario could happen periodically, especially if the Company misses analyst’s estimations in the future. However, in the long run, we expect the D/E ratio to adjust itself, if the missing estimations are not structural. Consequently, although aware that D/E will indeed change over the future, we assumed in the years to come the same D/E as seen at the end of 2017, which is 21%.
WACC Result
After having calculated the cost of debt and equity, the WACC yielded a final result of 6.42%. This WACC is assumed to be constant for the following years for the purpose of the valuation.
Growth Rate
Growth rate is a key aspect of valuation, as it is an assumption with strong impact on the target price. A fundamental analysis could be done to estimate this rate, by looking at its historical return on invested capital and reinvestment rate. However, this could possible yield imprecise results due to the recent turnaround and Velocity Figure 45: Peers’ D/E
Source: Bloomberg and Damodaran 70% 36% 5% 39% 43% 53% 21% 21% 0% 10% 20% 30% 40% 50% 60% 70% 80% W E ND Y 'S C O/ T HE Y UM ! B RA ND S I NC S T A R B UC K S CORP DO M INO 'S P IZ Z A INC RB I DU NK IN' B RA ND S … In d u str y M cDon a ld 's
Figure 46: NOPLAT Yearly Growth
Source: Analyst Estimation 26% 5% 3% 3% 4% 3% 3% 3% 0.00% 5.00% 10.00% 15.00% 20.00% 25.00% 30.00%