Procedia Social and Behavioral Sciences 12 (2011) 322–329
ICEEPSY-2010
Student characteristics and PISA science performance: Portugal
in cross-national comparison
Jesuina Fonseca
a*
Maria Odete Valente
aJoseph Conboy
aaInstituto de Educação, University of Lisbon, 1749-016 Lisboa, Portugal; *[email protected]
Abstract
Problem Statement: PISA 2006 indicates that Portuguese students’ performance in science, although improving, is still lower than in most OCDE countries. What is the role of student characteristics, interests, gender and economic, social, cultural, status (ESCS) on scientific literacy scores? How does Portugal compare with some other selected countries? Purpose of Study: The study compares Portuguese students’ performance in PISA 2006 scientific literacy with that of students from the OECD, Spain, France, the United Kingdom, Turkey, Greece, and the USA. The study also examines students’ science interests, self-efficacy and beliefs about their own competences. Furthermore, the study identifies which student variables may help to explain performance in science. Research Methods: Our data are selected from the PISA 2006 student: (a) science performance and (b) interests and beliefs measured by the student questionnaire. In order to answer our research questions, we performed secondary analyses using hierarchical linear modeling. The 2006 PISA sample in Portugal consisted of 5109 students in 173 schools, all between the ages of 15;3 and 16;2. Findings: Change-in-score coefficients in the fitted model indicate that the ESCS effect is strongest in the USA, Finland and UK. The school-wide ESCS effect is superior to that of student ESCS and is a performance factor for all countries with the exception of Finland. Mean differences in performance tend to favor boys but, in several countries, gender does not contribute a significant change in score in the fitted models. For all countries, the general value of science, enjoyment of science and science self-efficacy are positively associated with performance. A negative association between personal value of science and performance was observed. The association of “participation in non-school science activities” with performance is either negative or non-significant. Conclusions: The constellation of associated factors differs from country to country but a few of these factors stand out as cross-nationally valid. Knowledge of both kinds of factors can be useful for the improvement of teaching/learning systems. Cross-national factors can simplify general models while the country-specific factors can help identify and target local concerns.
© 2010 Published by Elsevier Ltd.
Keywords: Scientific literacy; science teaching and learning; student attitudes; explanatory variables; PISA 2006
1. Introduction
Attitudes toward science play an important role in scientific literacy learning. As many educators affirm, an important goal of science education is for students to develop interest in, and support for, scientific inquiry as well as to acquire and apply scientific knowledge (Bybee et al., 2009). The relationship between interest in science and achievement has been the subject of research for more than 40 years. And although there is still debate about the causal link, it is generally agreed that students’ interest in science and school science, and their beliefs as learners, are important for their science learning (Osborne, Simon & Collins, 2003). In a study in Finland, Lavonen &
1877-0428 © 2011 Published by Elsevier Ltd. Selection and/or peer-review under responsibility of Dr. Zafer Bekirogullari of Y.B. doi:10.1016/j.sbspro.2011.02.041
Laaksonen (2009) concluded that science-related self-efficacy, self-concept and science topic-related interest are highly relevant to successful science learning and performance.
PISA 2006 Science aims at assessing student achievement in the scientific domain, but also to assess students’ interests, values and sense of self-efficacy and beliefs about their own competence (OECD, 2007). The inclusion of attitudes toward science provided an international portrait of students’ general appreciation of science (Bybee et al., 2009).
PISA 2006 indicates that Portuguese students’ performance in science, although improving, is still lower than most OECD countries (GAVE, 2007). What is the role of student characteristics, including gender, ESCS, interests, values and beliefs, on scientific literacy scores? How does Portugal compare with some other selected countries?
1.1. Scientific literacy
Scientific literacy has been the global aim of science education for several decades. Paul DeHurd described scientific literacy as an understanding of science and its applications to social experience (Hurd, 1958). More recently, different authors have contributed to clarify the subject in terms of proposed curricular orientation and instructional emphasis for attaining scientific literacy as a purpose of science education (Bybee et al., 2009). Project
2061, one large science education project aimed at not only delineating philosophical views, but, above all, at
curriculum development, science teaching and learning, and teacher education, was one of the most important cross-national (although based in the USA) efforts in using the concept of scientific literacy as a goal for science education reform. The Project produced several major documents, including Science for All Americans (American Association for the Advancement of Science, AAAS, 1989) and Benchmarks for Science Literacy (AAAS, 1993). Following these, the National Research Council (NRC), also in the USA, published the National Science Education Standards (NRC, 1996) which established the standards for achieving scientific literacy.
The discussion on scientific literacy emerges from, and feeds itself in, two politically conflicting emphases about science curriculum. Some argue that curriculum should emphasize a science subject for itself; others, on the contrary, argue that it should emphasize science in real life situations in which science plays a key role (Abell & Lederman, 2007). PISA 2006 Science represents an assessment emphasizing the vision of scientific literacy as educating future citizens, that is, the perspective of science applied in real life situations.
PISA 2006 assessed scientific competencies that 15-year-old students should know, and be able to do, within personal and social contexts (OECD 2009a, 2009b). Scientific literacy included four components: a) scientific
contexts (life situations involving science and technology); b) scientific competencies (three major competencies
were selected—identifying scientific issues, explaining phenomena scientifically, using scientific evidence to draw conclusions); c) domains of scientific knowledge (students’ understanding of scientific concepts as well as their understanding of the nature of science); and student attitudes toward science (interest in science, support for scientific inquiry, and responsibility toward resources and environment).
1.2. Science attitudes and their role in science performance
Attitudes toward science play an important role in scientific literacy performance. They encompass an individual’s interest in, and response to, science, her or his feelings, beliefs and values that orient personal postures and actions. An important aim of science education is for students to develop interest in, and support for, the science enterprise, as well as to acquire and apply scientific knowledge for personal and social purposes (Bybee,et al., 2009).
Freedman (1997) studied the relationship among laboratory instruction, attitudes toward science and achievement in science of students enrolled in a ninth-grade physical science course in a large urban high school. He concluded that “attitude toward science influences achievement” and additionally that “a hands-on laboratory program influences the attitude toward science of students and influences their achievement in science knowledge” (p. 353). Freedman defined attitudes toward science as the students’ perception of their ability to achieve in science. According to some other authors, there is often a positive link between student engagement, when defined in terms of their interest, enjoyment, self-belief and self-confidence, future motivation in science, and their performance in science (Ministry of Education, New Zealand, 2009). Other researchers found that although positive attitudes can increase students’ actual science achievement, high science achievement does not necessarily create positive attitudes toward science by the students (Papanastasiou & Michalinos, 2002).
In order to measure attitudes toward science, PISA 2006 integrated both non-contextualized questions in the student questionnaire, and contextualized questions (within a unit) in the achievement test. The student questionnaire contained questions in each of the three areas—interest in science, support for scientific inquiry, responsibility toward resources and environment, while the student test contained questions on only the two first areas. Student attitude data were not considered in the calculation of their literacy scores.
1.3. Research questions
Using data from PISA 2006, we conducted secondary analyses of the attitudes and science performance of students in Portugal and in six other selected countries (we selected countries based on their geographic, cultural or academic similarities to Portugal, or excellence in PISA performance). We looked into identifying student variables that might explain student performance. Our research questions were: (a) How do Portuguese students compare with those of other selected countries (namely, Finland, Greece, Spain, Turkey, USA and UK) regarding PISA 2006 scientific literacy? (b) What are the interests of Portuguese students, compared with those of the selected OECD countries, with respect to science, science studies and scientific careers? What are their senses of self-efficacy and beliefs about their own competencies as measured by PISA? How do they compare? (c) What student variables explain student performance in PISA scientific literacy assessment in Portugal and in other countries?
2. Method 2.1. Sample
In PISA 2006, the Portuguese sample consisted of 5109 students from 173 schools. All students in the sample were aged between 15 years, three months, and 16 years, two months old; all attended, at a minimum, the 7thgrade. The sampling process has been described in OECD (2007) and GAVE (2007).
2.2. Procedure
We looked at variables of PISA 2006 measuring performance in general scientific literacy (SCIE), as well as those measuring scientific literacy competency components, namely (a) identifying scientific issues (ISI), (b) explanation of scientific phenomena (EPS), and (c) using scientific evidence (USE). In terms of attitudes, we looked at nine PISA variables: (a) general interest in science learning (different disciplines and the science process--INTSCIE); (b) enjoyment of science (JOYSCIE); (c) instrumental motivation to learn science (usefulness for the future-- INSTSCIE); (d) future-oriented science motivation (science careers-- SCIEFUT); (e) science self-efficacy (how easy it is for me to learn…-- SCIEEFF); (f) science self-concept (I can understand… --SCSCIE); (g) general value of science (to society-- GENSCIE); (h) personal value of science(PERSCIE); and (i) out-of-school science activities (frequency of performing them-- SCIEACT). We also examined the effect of student gender and student socio-economic and cultural background, both individually (ESCS) and as a school-wide variable (XESCS). All data were provided by the OECD (http://www.pisa.oecd.org), and were originally obtained through the scientific literacy test and the student questionnaire.
Data were analyzed using the statistical program HLM version 6.08 for multi-level analyses (2009), the Statistical Package for Social Sciences (SPSS, ver. 17.0, 2009), as well as macros and syntax files provided by the OECD (OECD, 2009b).
3. Results
3.1. Science mean scores, ESCS and gender in the seven countries
According to mean data published by the OECD, in general, higher mean ESCS is associated with higher mean science sore. However, there are cases of countries that do not follow this general tendency. An example is the USA where ESCS is higher than the OECD average but the mean science score is lower than that of OECD.
The same OECD tables show that gender does not seem to behave consistently across countries. Sometimes boys are better than girls, sometimes the opposite happens but, in general, the difference (measured through Cohen’s d) is not significant. An exception is Turkey where girls are significantly better than boys.
When breaking down the scientific literacy performance into the three competencies (EPS, ISI, USE), we observe that in most cases boys are better than girls in the Explaining Phenomena Scientifically competency, but girls are always better than boys for the Identifying Scientific Issues competency.
3.2. Interests, values and beliefs in the seven countries
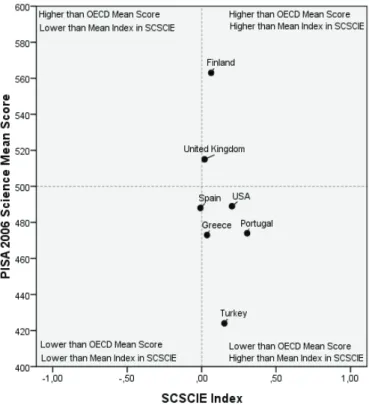
If we consider graphs of PISA 2006 science mean scores, by each one of the nine attitudes, for all the seven countries, we can see that Finland and UK are located in positions that correspond to a mean score higher than the OECD and, either lower than the mean attitude index or higher than the mean attitude index. Generally all the other five countries are located in positions corresponding to a lower than average score and higher than the mean attitude index (with some exceptions for some attitudes). In Figure 1, we present an example of this for Science
Self-Concept.
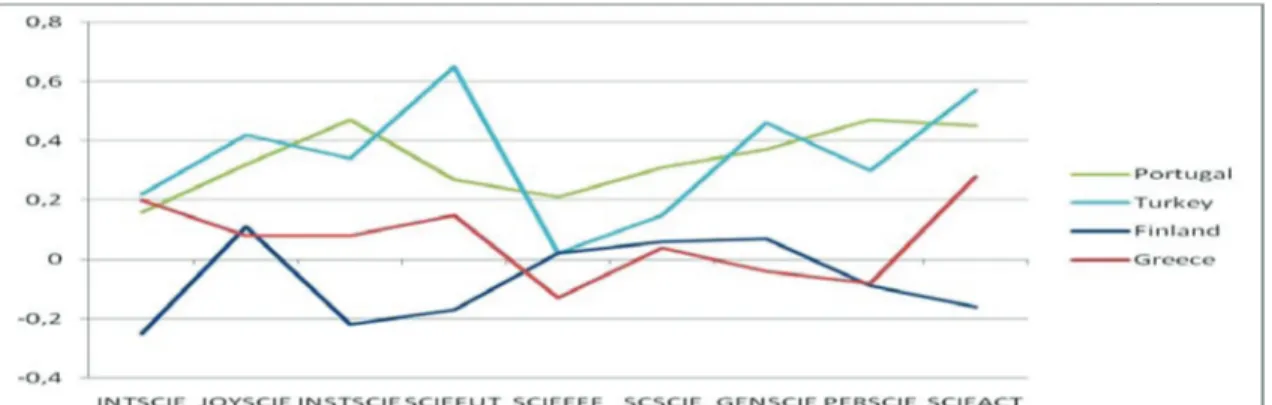
Figure 2. Means of each attitude index for four countries
Figure 2 depicts the means for the nine attitude indexes for some of the countries (Portugal, Turkey, Finland and Greece).
It is interesting to notice some extreme positions in some attitudes. Turkey has a very high index for
Future-oriented science motivation and comparatively low index for Science self-efficacy, which seems somehow
contradictory. Finnish students, with their typical high-performance scores, have lower attitude indexes than students in countries like Portugal.
3.3. Hierarchical linear model for science performance in Portugal
Table 1 shows a hierarchical linear model for science performance in Portugal in PISA 2006. We used, as explanatory variables, gender, student socioeconomic and cultural status (ESCS) and school ESCS (XESCS), and the nine attitude variables. The first column -- Model 1 -- shows the change in score in performance associated with change in each of the variables (CIS) for each of the variables. The second column -- Model 2 -- shows the CIS when only the significant variables are included in the analysis (fitted model). The results of the analysis indicate that gender is a factor in relation to performance, with boys scoring better than girls. A typical girl has, on average, performance that is 6.71 points lower than the boys’ performance. ESCS is a strong factor, both individually and for the overall school. ESCS for the school is even stronger than the individual ESCS. For the ESCS, for each unit increase, there will be an increase of 11.88 points in the performance.
Six of the nine attitudes are significant factors in performance. The exceptions are for the following: General
Table 1. Hierarchical Linear Model for Science Performance in Portugal 2006
Modelo 1 Modelo 2 1
CIS CIS
Intercept 472.59*** 473.04***
Gender (0 = Male; 1 = Female) -8.80*** -6.31***
ESCS 12.12*** 11.88***
XESCS 31.79*** 34.08***
INTSCIE – General interest in learning science 0.98ns**
JOYSCIE – Enjoyment of science 16.83*** 16.69***
INSTSCIE – Instrumental motivation to learn science 3.88ns**
SCIEFUT – Future-oriented science motivation 14.33*** 12.21***
SCIEEFF – Science self-efficacy 11.07*** 12.19***
SCSCIE – Science self-concept 2.28ns**
GENSCIE – General value of science 14.30*** 14.93***
PERSCIE – Personal value of science -12.61*** -11.73***
SCIEACT – Science activities -6.61*** -4.55***
R12 18.76% 20.58%
R22 62.78% 62.18%
________________________________________________ Note. CIS = Change in score. 1Fitted Model.
ns
p > 0.05. * p < 0.05. ** p < 0.01. *** p < 0.001 R2Proportional reduction in variance level 1 and level 2
3.4. Hierarchical linear model for science performance for the seven countries---Gender, ESCS and XESCS
Table 2 presents the CIS coefficients for the seven countries and the variables Gender, ESCS and XESCS. In three of the countries, gender does not contribute a significant change-in-score in the fitted models (Greece, Turkey, Spain; We note that, once the ESCS and XESCS variables are controlled, the significant difference between boys and girls in Turkey , reported by the OECD, is not maintained).
Change-in-score coefficients in the fitted models indicate that the ESCS effect is strongest in the USA, Finland and UK. The school-wide student ESCS effect is superior to that of the individual student ESCS and is a performance factor for all countries with the exception of Finland.
Table 2. Change in score in science performance associated with a one point positive change in each index
Index Finland Greece Portugal Spain Turkey United
Kingdom USA Gender (0=Male; 1=Female) 8.47*** 0.47ns** -6.31*** -2.94ns** 0.17ns** 6.86*** 5.87*** ESCS 16.40*** 10.39*** 11.88*** 14.92*** 7.14*** 15.13*** 21.13*** XESCS 4.06ns** 63.44*** 34.08*** 22.62*** 54.14*** 63.27*** 54.23***
Note. Fitted Model
ns
p > 0.05. *p < 0.05. ** p < 0.01. *** p < 0.001
3.5. Hierarchical linear model for science performance for the seven countries---Interests, values and beliefs
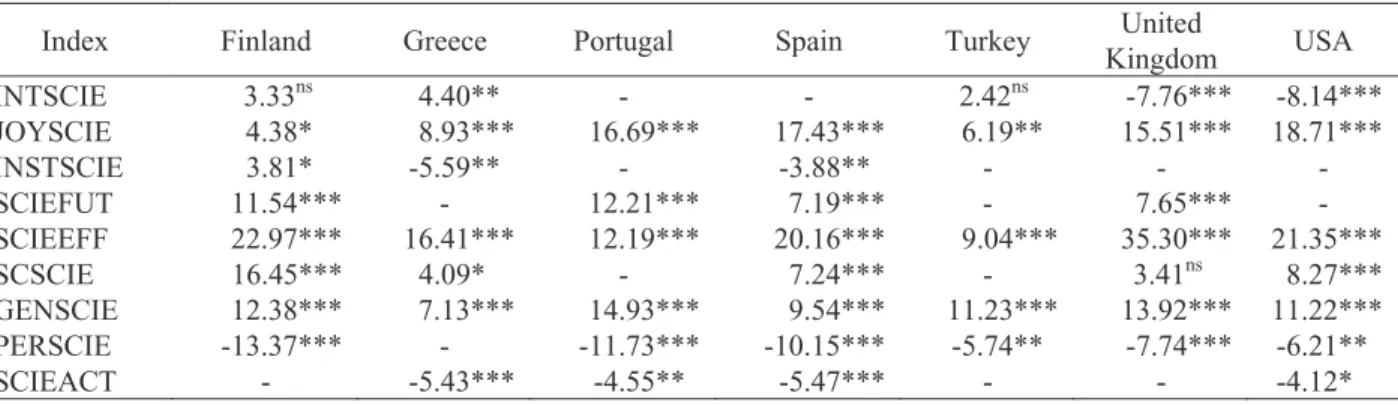
Table 3 shows the CIS coefficients for the seven countries and the nine attitude variables. For all countries, three variables, the General value of science, Science self-efficacy and Enjoyment of science are positively associated with performance. A negative association was found for all countries between Personal value of science and performance. The association of “participation in non-school science activities” with performance is either negative or non-significant .
Table 3. Change in score in science performance associated with a one point positive change in each index
Index Finland Greece Portugal Spain Turkey United
Kingdom USA INTSCIE 3.33ns** 4.40*** - - 2.42ns** -7.76*** -8.14*** JOYSCIE 4.38*** 8.93*** 16.69*** 17.43*** 6.19*** 15.51*** 18.71*** INSTSCIE 3.81*** -5.59*** - -3.88*** - - -SCIEFUT 11.54*** - 12.21*** 7.19*** - 7.65*** -SCIEEFF 22.97*** 16.41*** 12.19*** 20.16*** 9.04*** 35.30*** 21.35*** SCSCIE 16.45*** 4.09*** - 7.24*** - 3.41ns** 8.27*** GENSCIE 12.38*** 7.13*** 14.93*** 9.54*** 11.23*** 13.92*** 11.22*** PERSCIE -13.37*** - -11.73*** -10.15*** -5.74*** -7.74*** -6.21*** SCIEACT - -5.43*** -4.55*** -5.47*** - - -4.12***
Note. Fitted Model
nsp > 0.05. *p < 0.05. ** p < 0.01. *** p < 0.001
4. Discussion and Conclusion
Performance differs from country to country in the seven considered. ESCS is a strong factor associated with performance in all countries. XESCS is a very strong factor associated with performance in all countries with the exception of Finland. Boys are generally better than girls in scientific literacy performance. However, when we break down the scientific literacy into its three competency components, Explaining Phenomena Scientifically,
Identifying Scientific Issues and Using Scientific Evidence to draw conclusions, we see that boys are generally better
than girls in EPS, but girls are always (for the seven countries) better than boys in the ISI competency.
In general terms, countries with better performance have lower attitudes. But there are differences in this relation when we analyze separately the nine variables considered in the student questionnaire: (a) For all countries, three variables, the General value of science, Science self-efficacy and Enjoyment of science are positively associated with
performance; (b) A negative association between Personal value of science and performance was observed; (c) the association of Participation in non-school science activities with performance is either negative or non-significant.
The constellation of associated factors differs from country to country but a few of these factors stand out as cross-nationally valid. Knowledge of both kinds of factors can be useful for the improvement of teaching/learning systems. Cross-national factors can simplify general models while the country-specific factors can help identify and target local concerns.
Acknowledgements
This research was supported by the Portuguese Foundation for Science and Technology (contract number FSE/CED/83617/2008) and by the Institute of Education of the University of Lisbon.
References
Abell, S., & Lederman, N. (2007). Handbook of research on science education. Mahwah, NJ: Lawrence Erlbaum Associates.
American Association for the Advancement of Science (AAAS) (1989). Project 2061-Science for all Americans. Washington D.C.: AAAS.
American Association for the Advancement of Science (AAAS) (1993). Project 2061-Benchmarks for science
literacy. New York: Oxford University Press.
Bybee, R., McCrae, B., & Laurie, R. (2009). PISA 2006: An assessment of scientific literacy. Journal of Research
in Science Teaching, 46(8), 865-883. doi:10.1002/tea.20333
Freedman, M. (1997). Relationship among laboratory instruction, attitudes toward science, and achievement in science knowledge. Journal of Research in Science Teaching, 34(4), 343-357.
GAVE. (2007). PISA 2006 - Competências científicas dos alunos portugueses. Lisboa: GAVE.
Hurd, P.D. (1958). Science literacy: Its meaning for American schools. Educational Leadership, 16, 13-16.
HLM (Version 6.08) [Computer software and manual]. (2009). Lincolnwood: Scientific Software International, Inc. Lavonen, J., & Laaksonen, S. (2009). Context of teaching and learning school science in Finland: Reflections on
PISA 2006 results. Journal of Research in Science Teaching, 46 (8), 922-944.
Ministry of Education (New Zealand), Research Division (2009). A focus on science achievement and engagement. National Research Council (NRC) (1996). National Science Education Standards. Washington, D.C.: National
Academy Press.
Osborne, J., Simon, S., &Collins, S. (2003). Attitudes toward science. A review of literature and its implications.
International Journal of Science education, 25 (9), 1049-1079.
Organisation for Economic Co-operation and Development. (2007). PISA 2006: Science competencies for
tomorrow's world. Volume 1: Analysis. Paris: OECD Publishing.
Organisation for Economic Co-operation and Development. (2009a). PISA 2006: Technical report. Paris: OECD Publishing.
Organisation for Economic Co-operation and Development. (2009b). PISA data analysis manual: SPSS (2nd edition). Paris: OECD Publishing.
Papanastasiou, E. & Michalinos, Z. ( 2002). The effect of attitudes on science achievement: A study conducted among high school pupils in Cyprus, International Review of Education, 48(6), 469-484.