Private Equity vs. Strategic Acquirers: Who
Wins on the M&A Game in the UK?
Miguel Grilo Silva
152417046
Dissertation written under the supervision of Professor José Faias
Dissertation submitted in partial fulfilment of requirements for the MSc in
Finance, at the Universidade Católica Portuguesa, January 2019.
Private Equity vs. Strategic Acquirers: Who
Wins on the M&A Game in the UK?
Miguel Grilo Silva
152417046
Abstract:
This study investigates the post-deal performance of firms acquired by Private Equity versus Strategic Acquirers in the UK. We use a combination of counterfactual matching (controlling for self-selection) together with a differences-in-differences analysis to capture the marginal effect of Private Equity buyers and Strategic Acquirers towards their targets’ performance. For our sample of 56 Private Equity deals and 69 Strategic transactions, we do not find clear evidence that neither of both types of buyers outperforms the other in a broad extent. Notwithstanding, in measures related to profitability, such as the Gross Margin, our results suggest that Strategic Acquirers outperform Private Equity targets’ performance, which we attribute to higher synergy-related gains at a raw-material level, resulting from the complementarity between resources of both parties engaged in the transaction. Contrary evidence is found when analyzing efficiency gains and growth metrics, as our results suggest that Private Equity targets experience a higher decline in Working Capital-to-Sales, arising from better management practices, as well as superior Assets Growth, as a consequence of Private Equity’s role as a source of capital.
Keywords: Private Equity, Strategic Acquisitions, Deal Performance J.E.L. Classification: G24, G34
Capital de Risco ou Compradores Estratégicos:
Quem Ganha a Batalha de Fusões e Aquisições
no Reino Unido?
Miguel Grilo Silva
152417046
Sumário:
Este estudo investiga o desempenho de empresas adquiridas por fundos de capital de risco, em comparação com empresas adquiridas por compradores estratégicos, com sede no Reino Unido. Utilizamos uma combinação de emparelhamento com empresas do grupo de controlo (resolvendo o viés de auto-seleção), juntamente com uma análise de Diferenças-em-Diferenças para capturar o efeito marginal das empresas de Capital de Risco e adquirentes Estratégicos no desempenho das empresas adquiridas. Com a nossa amostra de 56 aquisições por fundos de Capital de Risco e 69 transações cujo comprador é uma empresa Estratégica, não encontramos sinais inequívocos de que um dos dois tipos de compradores tem um desempenho superior, num sentido amplo. Ainda assim, nas medidas relacionadas com a rentabilidade, como a Margem Bruta, os nossos resultados sugerem que as empresas compradas por adquirentes Estratégicos atingem um desempenho superior quando comparado com empresas detidas por fundos de Capital de Risco, o que atribuímos a maiores ganhos relacionados com sinergias verificados ao nível de matérias primas, dada a complementaridade entre os recursos de ambas as partes da transação. Obtemos o resultado oposto ao analisar ganhos de eficiência e medidas de crescimento, já que os nossos resultados sugerem que as empresas adquiridas por investidores de Capital de Risco experienciam uma maior redução do Fundo de Maneio em percentagem das vendas, fruto de melhorias nas políticas de gestão, bem como um acentuado crescimento dos ativos, o que advém do papel das empresas de Capital de Risco como provedoras de capital.
Palavras-chave: Capital de Risco, Aquisições Estratégicas, Desempenho da Transação
i
Acknowledgements
This thesis represents the end of an amazing and challenging journey, filled with countless occasions of learning, new experiences and great moments that I had a great pleasure to share with an outstanding group of colleagues.
First of all, I sincerely thank my supervisor, Professor José Faias, for his immense support and advice in every matter, for constantly guiding me back to the right track whenever I felt lost during this project, and for the opportunity to experience such an intense learning experience. I also thank Fundação para a Ciência e Tecnologia.
This project would not be possible without the invaluable resources provided by Nuno Raposo and Frederico Mendes, to whom I am also very grateful.
The support I had from my friends during this intense period, with whom I spent far more hours than I can count, definitely made this project much easier. I will always carry with me the warm memories of all the nights spent in Reuters Room, as well as those moments that are still yet to come. Bruno Alves, Hanna Nikanorova, Sofia Gomes, Pedro Venâncio, Jorge Santos, Miguel Cravo, Nuno Plácido and Sara Pereira, this would not have been possible without you.
I am also very grateful to Maria, for her constant support and for her innate ability to understand me, especially when I needed a break to clear my mind but could not see it, always taking care of me, as well as for making me a better person every day. I also owe you an apology for all the time I could not spend with you, but I promise that it will be recovered.
And at last, but not least, I owe my utmost gratitude to my Family, namely my sisters that put up with me, but especially to my Parents, the ones that, since day one, always gave me the tools, values and beliefs that I needed to succeed, and that made me the person that I am today. There are not enough words to thank you.
ii
Contents
1. Introduction ... 1
2. Data sources and sample construction ... 6
2.1 Data Sources ... 6
2.2 Measuring Interindustry Relatedness ... 7
2.3 Measuring Complementarity ... 8
3. Methodology ... 13
3.1 Performance measures and Matching characteristics ... 13
3.2 Matching Model ... 14
3.3 Differences in Differences ... 15
4. Results ... 18
4.1 Operational Performance ... 18
4.1.1 Profitability and Efficiency ... 18
4.2. Components of differentiated performance ... 21
4.2.1 Cost optimization ... 21 4.2.2 Growth ... 22 4.2.3. Efficiency ... 24 4.3 Findings Discussion ... 25 5. Conclusion ... 27 6. References ... 28 7. Appendix ... 32
iii
List of Figures
Figure 1 - Characteristics of the Final Sample ... 10
Figure 2 - Trends in Operating Performance ... 20
List of Tables
Table 1 - Summary Statistics ... 12Table 2 - Balancing Tests of Matched Samples ... 15
Table 3 - Interpretation of the coefficients of Equation (2) ... 16
Table 4 - DID Regression Estimates of the Differences in Profitability and Efficiency ... 19
Table 5– DID Regression Estimates of the Differences in Cost Structure ... 22
Table 6 – DID Regression Estimates of the Differences in Growth ... 23
Table 7– DID Regression Estimates of the Differences in Efficiency ... 25
Appendix
Appendix 1 - Variance Inflation Factors test for multicollinearity in our Matching model .... 32Appendix 2- Variables Definition ... 32
Appendix 3– DID Regression Estimates of the Differences in Profitability and Efficiency using 1-to-5 nearest neighbor matching ... 33
1
1. Introduction
On November 2016, Forbes issued an article named “Selling your business to Private Equity is not for everyone” that discussed why one should choose, or not, to sell your company to a Private Equity Group (PEG), rather than to a competitor (Strategic). The classical view is that, on an up-front basis, a competitor will give the entrepreneur a better deal, as they are available to pay more due to synergies and other scaling benefits. Inherently, the common opinion about Private Equity Groups is that they are mere financial players that will only contribute with liquidity and management expertise when needed and, thus, will be willing to pay less vis-à-vis those with a strategic perspective. Nevertheless, one must not neglect the Equity stake that the entrepreneur retains in either case. As the article states, “a PEG will acquire a percentage of the business (usually a majority stake) which allows the owner to take some chips off the table, but requiring them to remain on board to operate and grow the company with the PEG’s resources behind them for a future, more lucrative valuation and exit.” The purpose of this study is to address whose assets are of most value to the performance of target firms, thus enabling managers to make more informed decisions when faced with the possibility of selling their firm to either a PEG or a Strategic.
The global M&A market has been growing since the 2008-2009 crisis, reaching an aggregate announced deal value surpassing US$4.7 trillion in 2017, with more than 96,000 deals announced (Bureau Van Djik, 2018). Extensive research has been made about the post-acquisition performance of M&A deals, which is positively influenced by the similarity between both firms, perceived synergies and managerial involvement (Berger and Ofek, 1995; Houston et al., 2001; Healy et al., 1997).
Within the global M&A context, Private Equity accounted for over US$752 billion worth of deals, distributed across 23,000 announced transactions (Bureau Van Djik, 2018), an example of the representativeness of the Private Equity industry on the overall ownership control market, which has been persistent in the recent past. This is enhanced by current estimates that Private Equity firms are sitting on over US$1 trillion of “dry-powder”, readily waiting to be deployed (J.P.Morgan, 2018).
Private Equity firms are an increasingly driving force of the global M&A market (Cumming et al., 2007), hence the growing number of research dedicated to this topic (Kaplan and Strömberg, 2008), its performance (Franzoni et al., 2012), and its implications to the economy (Wright et
2
al., 2009; Bernstein et al., 2016). Moreover, the common belief that Private Equity relies on cutting jobs as a tool to enhance performance has also been subject to extensive scrutiny, with a common conclusion that it, in reality, creates jobs (Davis et al., 2014; Amess et al., 2013). Nevertheless, the vast majority of research is dedicated to the performance of the Private Equity firms and funds and its impact, and the performance of the Private Equity target companies remains largely neglected by researchers. We seek to contribute to the existing literature by further exploring this topic, namely regarding the areas where PEG have a more pronounced effect on the performance of their portfolio holdings.
There is evidence of potential for value creation in both Strategic and PEG acquisitions. Taking a step back, previous studies have shown that related diversification is associated with a superior performance, when compared with unrelated diversification (Palich et al., 2000; Singh and Montgomery, 1987), a result that is further enhanced when including strategic relatedness (Markides and Williamson, 1994). From that basis, in industry takeovers, researchers argue the existence of synergy gains, such as economies of scale and scope (Chatterjee, 1986; Singh and Montgomery, 1987), enhanced market power (Chatterjee, 1991), tax attributes (Hayn, 1989), among other sources of value. Nevertheless, sources of value destruction are also relatively consensual throughout literature, with main drives being tied to managers, namely regarding overconfidence (Roll, 1986), managerialism and private benefits (Marris, 1964), and managerial biases when choosing targets (Harford et al., 2012).
Moreover, Private Equity has also long been claimed to achieve superior performance regarding efficiency and profitability, either when compared to its pre-deal performance (Gaspar, 2012), a matched sample of non-bought firms (Wilson et al., 2012), and a sample of Strategic acquisitions (Fontoura, 2014). However, results differ across literature, with studies also concluding that “private equity returns are no higher than the returns to public equity” (Moskowitz and Vissing-Jørgensen, 2002). PEG target performance is usually tied to the alignment of management incentives with those from shareholders, benefits of increased debt, which reduces agency costs by disciplining management (while, at the same time, increasing tax shields), enhanced governance and monitoring, and pre-deal characteristics, such as operational inefficiencies and failed acquisitions (Fox and Marcus, 1992; Guo et al., 2011). Extensive research has been made about both Private Equity and Strategic Acquisitions on an individual basis. Notwithstanding, the comparison between both remains largely neglected, especially regarding their target’s performance. Studies similar to ours in the sense that compare
3
PEG and Strategic on a post-deal setting, mainly focus on employment and salaries effects (Amess et al, 2013; Davis et al., 2011), as well as the selling process of both types of targets (Fidrmuc et al., 2012). Hence, the purpose of this study is to compare the performance of firms bought by PEGs with companies acquired by Strategic players, analyzing if either type of acquirer outperforms the other.
The closest study to ours is Fidrmuc, Roosenboom, Paap and Teunissen (2012), in which the authors analyze the selling process of firms acquired by Private Equity compared to Strategic buyers. The authors find that “the primary decision within the whole selling process is the target firms’ decision concerning whether to sell the firm in an auction, controlled sale, or negotiation, which then affects the buyer type.” Our study, although with a different focus, is clearly complementary, as it provides managers with tools to make more informed decisions about the merits of each type of acquirer.
From an initial sample of over 800 deals, we reach our treated group of 125 transactions (56 PEG and 69 Strategic) that took place between 2009 and 2012, and in which the target is registered in the UK, and that was matched with the firm within the 35,000 companies of the control group that presents the most similar pre-deal characteristics, which intends to decrease any self-selection bias present in our sample. To enhance the preciseness of our sample, all non-PEG transactions were classified as Strategic or Unrelated, using a methodology that analyzes the potential for vertical integration, as well as the degree of overlap between each pair of firms’ buyers and suppliers, at an industry level. Hence, we only consider the ones classified as Strategic.
We analyze the performance of our sample firms between the year before the transaction and the fifth year after the deal (which corresponds to the average time taken to exit Private Equity-backed investments). Moreover, we do not limit our analysis to a simple comparison between PEG and Strategic targets, nor to a simple pre- and post-deal comparison. Hence, we adjust our measures of performance to also account for a comparison between our treated group and their matched counterfactuals, and only then analyze the differences between PEG and Strategic targets.
Our analysis is centered on measures of profitability and efficiency, following the related literature (Gaspar, 2012; Fontoura, 2014). The results suggest that neither of the two types of buyers significantly outperforms the other studied measures, but rather in specific areas of intervention. On broader analysis, we find that Strategic targets have a superior performance in
4
profit-related measures, such as the EBIT Margin (with the difference reaching up to 18.1% in the fifth year after the deal), whereas PEG targets exceed Strategics in measures related to efficiency, such as the Return on Assets (which outperforms that of Strategics by 14.0% in the period after the deal). These results are in line with previous research that found that related acquisitions can benefit from synergies to a greater extent (Moatti el at., 2015), while PEG contribute towards an improved efficiency of their target firms (Gaspar, 2012; Fontoura, 2014). To more accurately describe our results, and try to find possible explanations behind the differences in performance between both types of acquirers, as well as to assess the areas of greater impact, we further explore, with more detail, potential sources of value creation (Gaspar, 2012), accounting for the Cost Structure (Gross Margin and Labor Costs over Sales), Growth (Sales, Assets and Employment Growth) and Efficiency (Asset Turnover, Working Capital Over Sales, and Long-Term Debt over Assets). The evidence, although fragile, seems to confirm our initial hypothesis of a greater synergetic benefit within Strategic targets, as the Gross margin is 9.1% higher after the transaction, when compared with PEG targets, a difference that reaches 17% on the fourth year after the ownership change. Moreover, Labor Costs as a percentage of Sales present virtually no differences in changes between both types of acquirers, contradicting Amess et al. (2013) and Wilson et al. (2012), but supporting the evidence that synergies are experienced at a raw-material level. We also find evidence of differences in metric related to growth. Our results suggest that Assets of firms acquired by PEG grow 34% more, after the deal, than those acquired by Strategic players, with the difference reaching 49.9% and 45.8% in the third and fourth year after the transaction, respectively. This finding may be linked with the PEG role as a source of fresh capital (Berger and Udell, 1998), a role that has greater prominence during and after recessions (Wilson et al., 2012), which is the case for our timespan. Lastly, when accounting for Efficiency in capital utilization, our sample reports a clear outperformance of PEG targets in what concerns Working Capital management, as the Working Capital over Sales Ratio suggests an improvement of 7.9% after the deal took place, in comparison with Strategic acquirers. This difference is concentrated in the last years under analysis, being persistently above 10% following the third year after the ownership change. Our results are robust when increasing the size of the matching firms (through 1-to-5 nearest neighbor matching). However, additional tests suggest that the year of the transaction also plays a role in determining the target performance, both in individual and in comparative terms, raising the question that performance may be partly driven by a timing matter.
5
This work has several practical applications. First, by benchmarking the performance of firms bought by PEG with those acquired by Strategics, we increase the information available to shareholders and/or managers seeking to sell the majority of their firm, although wishing to maintain a minority stake with the purpose of appreciating its value to sell later in the future. Secondly, by employing a more thorough measure of relatedness between firms, we are enhancing the preciseness and similarity of our sample, while allowing for other venues of value creation. The geographical scope of our sample, besides focusing on a less scrutinized market, also avoids sample selection biases arising from the non-obligation of publicizing accounting data. Furthermore, by employing a more accurate model of operating performance, benchmarking against both a counterfactual and Strategic acquisitions, instead of simply comparing the post-deal PEG performance with the pre-deal data, we are able to better capture the impact of PEG and Strategic buyers towards their targets. This also allows to control for the issue of self-selection, as each of the treated firms is paired with the observation from the control group that is the most similar before the deal takes place. Lastly, the distinct set of accounting variables that we analyze allows a more precise search for sources of differentiated performance from both PEG and Strategics.
The remainder of our study is organized as follows. In section 2, we present our data sources and the steps towards the final sample. Section 3 discusses the methodology employed. Section 4 presents and discusses the results and, finally, Section 5 concludes our work.
6
2. Data sources and sample construction
Our sample comprises firms registered within the UK being acquired by PEGs or Strategics between 2009 and 2012. Both the beginning and ending date of the timeframe considered result of data constraints arising from the need of collecting pre and post-deal accounting data from the acquired entities, since the database only delivers the last 10 years of financial and accounting data for each firm. Moreover, and given its representativeness in the global M&A context, being the European country with both more and more valuable deals, accounting for 8% and 6% of the PE and M&A deals worldwide, respectively (Bureau Van Djik, 2018), the choice of the UK as the market to study lies on the legal requirement to present individual accounts for tax purposes, decreasing the propensity of having sample selection bias, as well as additional sample constraints.
2.1 Data Sources
We began by extracting all the transactions between 2009 and 2012, in which the target was registered in the UK, from SDC Platinum, a database that provides information regarding M&A deals. Upon extraction, a set of filters and criteria were immediately put into place. To enhance the preciseness of our sample, acquisitions of specific assets and/or business units that did not have individual financial statements were discarded. Moreover, to better capture the influence of the buyer in the performance of the target we require that the deal includes a change in the controlling shareholder, hence only considering deals in which the buyer purchases a majority stake. Lastly, to obtain clear measures of the effect of ownership change, firms subject to another change in control in the preceding or the following five years are excluded (which required extraction of additional transaction data from SDC Platinum). Hence, we got a preliminary sample of 840 transactions, of which 156 refer to PEG.
Accounting data was extracted from Bureau Van Dijk’s ORBIS, a database that conveys financial and accounting data from over 300 million firms worldwide, which represented the biggest sample constraint of this study, as it only delivers, at most, the last 10 years of accounting information available for each company. The need to collect at least one year of data before and five years after the transaction year to properly analyze the change-of-control effect (as integration and any policies implemented take time to yield results), together with the limited timeframe available, narrows the span of acquisitions able to be considered. The same information was retrieved for the control group, comprising over 35,000 firms located in the UK with accounting and financial data available.
7
The final step was to define which of the deals are classified as Strategic. We follow a similar approach to the methodology proposed by Fan and Lang (2000), with the improvements suggested by Fan and Goyal (2006), originally applied to the US. This methodology aims to evaluate both the vertical relatedness and the complementarity between industries. A more straightforward approach would have been to establish Relatedness between the industries of the acquirer and target through a comparison of the 2-, 3-, or 4-digit NACE code (Berger and Ofek, 1995; Barber and Lyon, 1996). Nevertheless, this measure would be insufficient to capture the degree of relatedness between industries, namely regarding vertical integration-driven acquisitions, as found by Montgomery (1999), Fan and Lang (2000) and Sambharya (2003). As a matter of example, the extraction of crude petroleum (NACE 06) and the manufacture of refined petroleum products (NACE 19) businesses would be classified as unrelated industries whereas, logically, they are not unrelated. Moreover, complementarity is defined as the degree of overlapping between each pair of industries and its buyers and/or suppliers.
2.2 Measuring Interindustry Relatedness
The classification algorithm starts by retrieving yearly data, between 2009 and 2012 from the Office for National Statistics, “the UK’s largest independent producer of official statistics and its recognized national statistical institute”, regarding the Input-Output Supply tables between industries (at a two- or three-digit NACE). Our focus lies on the matrixes that decompose the total output of each one of the 105 industries/sub-industries, dividing it by the industries to which it is supplied. An advantage of dealing with the UK tables, compared to the ones in the US, is that they present the raw material input costs separated from labor compensation costs, allowing for a more accurate analysis of the relevance of the source of inputs.
For each pair of industries, the table presents the amount of output from industry i that was sold during year t to industry j, here denoted as 𝛼𝑡𝑖𝑗. More than the absolute value of the transfers of
goods between industries, we are interested in how representative are the goods that industry j purchased from industry i as a percentage of the total raw material costs of industry j during year t. Thus, to construct the relatedness coefficient, we divide each element 𝛼𝑡𝑖𝑗 by the total
raw material inputs of industry j to obtain 𝑣𝑡𝑖𝑗, representing the dollar amount of output from industry i for each dollar industry j spends in raw materials.1 We then use the maximum of the
1 Fan and Lang (2000) instead divide each element 𝛼
𝑖𝑗 by the total output of industry j. We opted for this measure
8
two input requirement coefficients for the industry pair i and j, 𝑉𝑡𝑖𝑗 = 𝑀𝑎𝑥{𝑣𝑡𝑖𝑗 ; 𝑣𝑡𝑗𝑖}, to establish the vertical relatedness coefficient, 𝑉𝑡𝑖𝑗, for industries i and j, as applied by Fan and Goyal (2006), which can be interpreted as the opportunity for vertical integration. 2
2.3 Measuring Complementarity
The complementarity coefficient aims to capture the degree of overlap between the destination of each pair of industries i and j output. Using the same Input-Output Supply tables, we calculate the percentage of output that each pair of industries i and j supply to industry k during year t, obtaining 𝑏𝑡𝑖𝑘. Then, we build an automated tool that, taking each pair of industries i and j, calculates the correlation coefficient between 𝑏𝑡𝑖𝑘 and 𝑏𝑡𝑗𝑘 for all k except i and j, A high correlation coefficient denotes a meaningful overlap between the output destination industries of producers from industry i and j. Similarly to the analysis performed for the relatedness, the opportunity for complementarity can either be regarding an increased supplying power or to enhance the purchasing power. Hence, we also compute the correlation between each pair of industries’ set of relatedness coefficients, 𝑣𝑡𝑘𝑖 and 𝑣𝑡𝑘𝑗. A high correlation coefficient denotes a meaningful overlap between the input needs and origin industries of firms from industries i and j. The coefficient of complementarity, denoted by 𝐶𝑡𝑖𝑗, is attained by considering the
maximum between the two correlation coefficients,
𝐶𝑡𝑖𝑗 = 𝑀𝑎𝑥{𝑐𝑜𝑟𝑟(𝑏𝑡𝑖𝑘 , 𝑏𝑡𝑗𝑘) ; 𝑐𝑜𝑟𝑟(𝑣𝑡𝑘𝑖 , 𝑣𝑡𝑘𝑗)}. (1)
Following the threshold used by Fan and Goyal (2006), Matsusaka (1996) and McGuckin et al. (1991), we establish the relatedness cutoff point at a 5% level, implying that two industries are classified as vertically related if their coefficient of relatedness lies above 5%, meaning that over 5% of the raw material input needs come from the same industry. The same value is used to categorize each pair of industries as complementary, which indicates that two industries are categorized as complementary if their purchases origin or sales destination overlap at least 5%. Once all the computations are done, we now have three determinants of industry relatedness between the acquiring and target firms: they either (1) belong to the same industry (at a two-digit NACE code), (2) are in vertically related industries or (3) lie within complementary businesses. For the second and third criteria, Relatedness measurement is made at a year-level. Hence, we classify transactions as Strategic if at least one of these criteria is met.
2 Fan and Lang (2000) calculate the average of each pair of coefficients, however the vertical integration
9
Finally, we reach our final sample size of 69 Strategic and 56 PEG transactions. Our sample compares with those from several studies focused on the performance of the target in M&A and Private Equity deals (Bertrand and Zitouna, 2008; Fukao et al. 2008; Guo et al., 2011; Fidmurc et al., 2012; Amess et al., 2013; Fontoura, 2014).
In Figure 1 and Table 1, we present the distribution of the characteristics of our sample in the year before the transaction, namely regarding the yearly distribution of deals, firms size, efficiency, leverage and industry, as well as the origin of the acquirer, aiming to identify any
ex-ante differences between the targets of each type of acquirer.
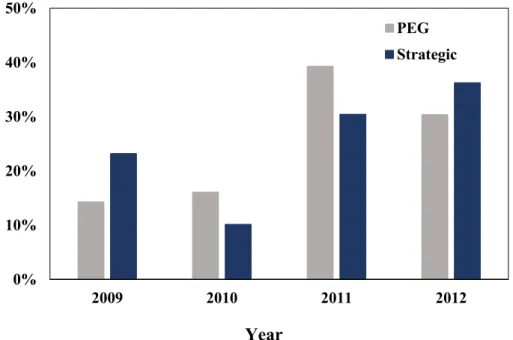
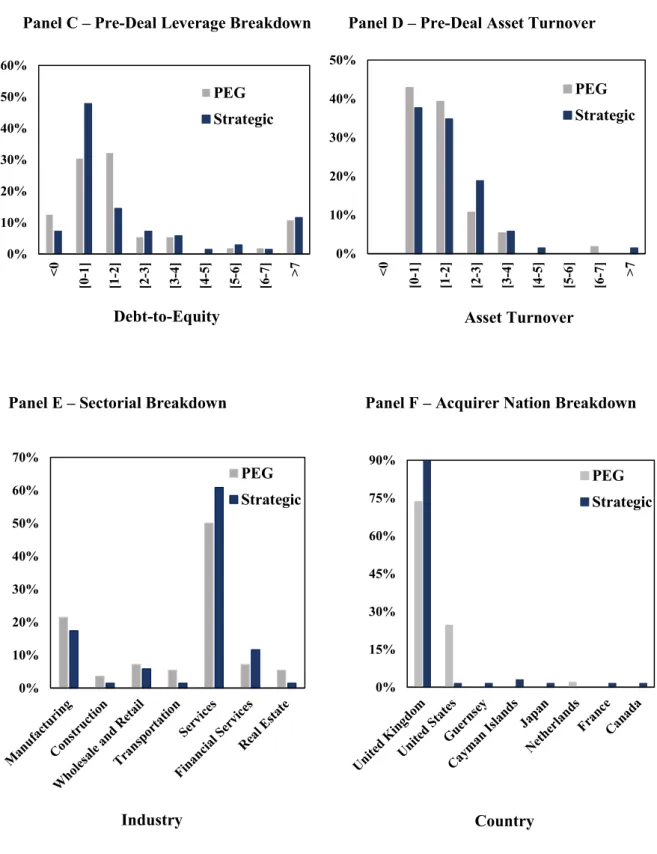
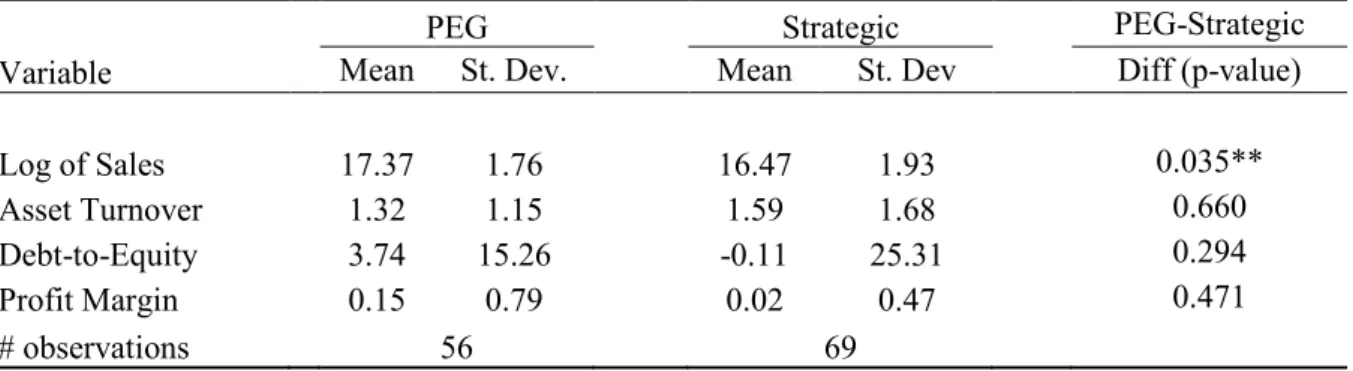
Panel A presents the yearly distribution of transactions within the period under scrutiny. We can observe a concentration of the transactions in the latter years of the timespan, which goes in line with the post-recession stage of the economy, although there are no clear differences between both types of acquirers. Panel B reports the targets’ breakdown regarding size (measured as Log of Sales) and suggests a PEG preference for larger targets, when compared to Strategic. This is confirmed by an analysis of Table A, which reports a significant difference (at a 5% level) between the average size of PEG and Strategic targets. Panel C shows the dispersion of our sample firms’ leverage before the acquisition (measured through the Debt-to-Equity Ratio) which, despite not showing any clear differences, indicates a positive Skewness for both acquirers, and higher Kurtosis in Strategic targets’ leverage. Table A also shows a lower average level of Strategic targets’ indebtedness before the transaction, raising the possibility for acquirers to further gear up their targets. We also assess the pre-deal efficiency (Asset Turnover) in Panel D, which suggests a PEG preference for less efficient firms. Panel E reports the sectorial distribution of our sample firms, showing a clear preference for the Services (non-financial), representing 50% of PEG and 61% of Strategic targets, and Manufacturing industries, comprising 21% and 17% of PEG and Strategic, respectively. Lastly, Panel F explores the geographic origin of the acquirer, clearly showing that the majority of the acquisitions are domestic for both types of acquirers (90% of Strategic and 74% of PEG), although PEG has a higher share of Cross-Border transactions, with US acquirers accounting for 25% of PEG deals within our transactions.
10
Figure 1 - Characteristics of the Final Sample
Figure 1 – Characteristics of the Final Sample
The graphs below provide a comparison between the characteristics of the final sample used in this study, further distinguishing between firms acquired by PEG (in grey) and those purchased by Strategic players (in blue). Panel A reports the yearly distribution of our sample’s deals. Panel B compares the percentage of firms within each bracket in terms of Log of Sales (natural logarithm of Sales). Panel C presents the breakdown of targets’ leverage, measured through the Debt-to-Equity ratio. Panel D provides the distribution of purchased firms’ efficiency, given by the Asset Turnover (Sales over Assets). Panels E and F compare the targets’ sectorial distribution and nation of the acquirer, respectively. Panel B, C and D’s metrics were measured in the year before the transaction took place. All panels present the distribution measured as a percentage of the total number of either PEG targets or Strategic players.
Panel A – Yearly Distribution of transactions
Panel B – Breakdown of Targets’ Size
0% 10% 20% 30% 40% 50% 2009 2010 2011 2012 PEG Strategic 0% 10% 20% 30% 40% 50% <11 [11-13] [13-15] [15-17] [17-19] [19-21] >21 PEG Strategic Year Log of Sales
11
Panel C – Pre-Deal Leverage Breakdown Panel D – Pre-Deal Asset Turnover
0% 10% 20% 30% 40% 50% 60% <0 [0 -1 ] [1 -2 ] [2 -3 ] [3 -4 ] [4 -5 ] [5 -6 ] [6 -7 ] >7 PEG Strategic 0% 10% 20% 30% 40% 50% <0 [0 -1 ] [1 -2 ] [2 -3 ] [3 -4 ] [4 -5 ] [5 -6 ] [6 -7 ] >7 PEG Strategic
Panel E – Sectorial Breakdown Panel F – Acquirer Nation Breakdown
0% 10% 20% 30% 40% 50% 60% 70% PEG Strategic 0% 15% 30% 45% 60% 75% 90% PEG Strategic
Figure 1 – Characteristics of the Final Sample (cont.)
Debt-to-Equity Asset Turnover
12
PEG Strategic PEG-Strategic
Variable Mean St. Dev. Mean St. Dev Diff (p-value)
Log of Sales 17.37 1.76 16.47 1.93 0.035** Asset Turnover 1.32 1.15 1.59 1.68 0.660 Debt-to-Equity 3.74 15.26 -0.11 25.31 0.294 Profit Margin 0.15 0.79 0.02 0.47 0.471 # observations 56 69
Table 1 - Summary Statistics
Table 1 – Summary Statistics
This table shows the summary statistics for our sample, measured one year before the deal. The column marked as “PEG” refers to the firms within our treated group that were acquired by Private Equity funds. The column labeled as Strategic refers to the firms within our treated group that were acquired by Strategic players. The column labeled “P-value” presents a standard t-test of the difference between means that compares, for each metric, the means measurable for PEG targets and Strategic targets. Log of Sales is defined as the natural logarithm of Operating Turnover, in Euros. Asset turnover is defined as Operation Turnover divided by Total Assets. Debt-to-Equity is defined as Total Liabilities divided by Total Shareholder Funds. Net Profit Margin is defined as Net Income divided by Operating Turnover. The symbols ***, **, * indicate statistical significance at a 1%, 5% and 10% level, respectively.
13
3. Methodology
According to Barber and Lyon (1996) “to assess whether a firm is performing unusually well or poorly, we must specify the performance we would expect in the absence of an event, thus providing a benchmark against which sample firms can be compared”.
Smart and Waldfogel (1994) developed and tested a general framework that aims to capture the effects of ownership change in corporate performance. A natural way, yet incomplete, would be the approach of using pre-transaction performance as comparison. However, such measure fails to capture factors, other than the corporate reorganization, that can have a meaningful impact on firm performance evolution (such as the business cycle stage and overall industry growth), and that would have occurred even in the absence of ownership change.
Thus, to assure the accurate detection of abnormal performance, one must place careful consideration in the election of the measure of performance under analysis, the comparison element (i.e. the development of the expected performance model) and finally the statistical test performed to assess the validity of results (Barber and Lyon, 1996).
3.1 Performance measures and Matching characteristics
Extensive research has been made on the determinants of both M&A (Rossi and Volpin, 2004; Bena and Li, 2014) and buyout activity (e.g. Axelson et al., 2013; Opler and Titman, 1993). The selection of performance measures to test the ownership change effect is affected by the limited scope of accounting variables available. Ideally, one would avoid any Earnings-related measure, as it is subject to manipulation and/or management, aggravated if the firm is in difficulties (Rosner, 2003), as well as the capital structure of the company (which, since are dealing with Private Equity transactions that usually incorporate debt, would distort the results). As such, we focus on the Earnings Before Income and Taxes (EBIT), and Earnings Before Interests, Taxes, Depreciations and Amortizations (EBITDA), with the latter not suffering from Depreciation-related biases. Nevertheless, we also use Operating Cash-Flow (OCF), defined as Net Income plus depreciations, to proxy the firms’ cash-generating ability.
Given the characteristics of our sample, and to properly compare these measures across firms, the variables need to be scaled, with the obvious denominators being Assets and Sales. The first divisor allows accounting for changes in capital utilization efficiency, whereas the latter solves the issue of misspecification between the valuation of the numerator, registered at cost, and denominator, measured at current value (Barber and Lyon, 1996; Megginson et al., 1994).
14
After considering both the performance indicators and the scaling variables, we choose those that are less subject change due to accounting bias/manipulation, namely EBITDA margin (EBITDA over Sales), EBIT margin (EBIT over Sales), OCF-to-Assets (OCF over Assets) and we also include ROA (Net Income divided by Assets).
3.2 Matching Model
The effect of an acquisition on the performance of the firm is defined as the difference between the firms’ outcome when acquired and the outcome that the firm would have attained if it had not been acquired (Bertrand and Zitouna, 2011). Nevertheless, it is not possible for a firm to be simultaneously observed as being acquired and non-acquired. Thus, extreme importance is placed in the selection of counterfactual (Amess et al., 2013; Cohn et al., 2014), as the accuracy of the test statistics is sensitive to small differences between the firms within the treated and control group, with findings suggesting that the most powerful models incorporate firms’ pre-event performance (Barber and Lyon, 1996).
The aim of this study is to assess the effect of ownership changes in the performance of the target firms, namely to determine whether the performance firms acquired by PEG differs from those acquired by Strategic firms. Studies with a similar purpose rely on Propensity Score Matching (PSM) to establish the counterfactual (Lechner, 2002; Amess et al., 2013; Cohn et al., 2014). However, in a recent study of King and Nielsen (2018), the authors found evidence that using PSM actually increases imbalance and inefficiency of the matched group, as it approaches a randomized experiment.
Thus, to match each of the treated group firms with its counterfactual from the more than 75,000 firm-year observations within the control group, we use the nearest neighbor matching. For each element from the treated group, this methodology determines the “nearest” (as measured by the Mahalanobis distance) through a weighted function of the covariates for each observation, thus establishing pairs including one treated firm and one observation from the counterfactual. Moreover, we force each observation to match exactly at an Industry and Year level. The covariates used in this study intend to assign matches based on size (Log of Sales), operational efficiency (Asset Turnover), profitability (Net Profit Margin) and potential to gear up (Debt-to-Equity Ratio), with all the characteristics being measured in the year before the transaction. Abadie and Imbens (2006, 2011) show that these matching estimators are not consistent when more than one continuous covariate is used. As we use four, this large sample bias is corrected using a linear function of the covariates.
15
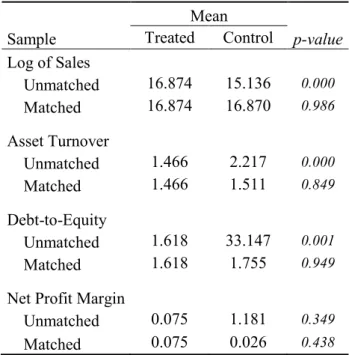
We also assess and determine that the variables included do not present signals of multicollinearity, through Variance Inflation Factors (VIF – results in Appendix A). It is also important to test if our matching model yielded the desired results, controlling for firm-specific, pre-deal differences, and obtaining a matched sample as close as possible to our treated group. Thus, we check whether the covariates (Log of Sales, Asset Turnover, Debt-to-Equity Ratio and Net Profit Margin) are balanced across both the treated and matched group. Results are presented in Table B and show that, indeed, our matching model significantly enhanced the balancing across samples, as shown by the outputs from the equality of means test (through standard t-tests) shown in the right column.
Mean
Sample Treated Control p-value Log of Sales Unmatched 16.874 15.136 0.000 Matched 16.874 16.870 0.986 Asset Turnover Unmatched 1.466 2.217 0.000 Matched 1.466 1.511 0.849 Debt-to-Equity Unmatched 1.618 33.147 0.001 Matched 1.618 1.755 0.949 Net Profit Margin
Unmatched 0.075 1.181 0.349 Matched 0.075 0.026 0.438
Table 2 - Balancing Tests of Matched Samples
3.3 Differences in Differences
Previous research has adopted different methodologies to assess the effect of events on the treated population. When there are successive observations for the same set of elements of our sample within a period of time, where t is the date of the event, the usual setting measures the change in a given indicator Y as the difference between the indicator in a subsequent period s and its value before the event, say in period t-1, or 𝛥𝑦𝑡−1;𝑡+𝑠 = 𝑦𝑡+𝑠− 𝑦𝑡−1 (Amess et al.,
2013). A relevant characteristic of those models, that yields more powerful test statistics, as suggested by Barber and Lyon (1996), is the inclusion of a comparison between the difference of performance of the treated and control observations instead merely assessing of the level of performance.
16
Although the matching model establishes pairs as similar as possible before the transaction (given our raw control group), there might exist some differences between each of the treated firms’ pre-acquisition characteristics and those of its counterfactual. In addition, we acknowledge that any change in performance might be related to external shocks, rather than the firm being acquired or not. Thus, we need to take into account the insufficiency of a mere temporal comparison while specifying the model to avoid external shocks and increase the accuracy of our results. Hence, to evaluate the average effect of acquisitions on target firms’ performance, we use difference-in-differences analysis (DID), a widely used method when studying acquisition-related events (Bena and Li, 2014; Lennox et al., 2016; Chen et al, 2016). The aim of this study is to compare the post-ownership change performance of PEG targets and Strategic Targets which, due to sample constraints, is not possible directly. Hence, we adapt the DID model to incorporate this indirect comparison. The model is specified as:
𝑦𝑖𝑡 = 𝛼 + 𝛽1𝑃𝑜𝑠𝑡𝑖𝑡+ 𝛽2𝑃𝐸𝑖 + 𝛽3𝑃𝑜𝑠𝑡𝑖𝑡∗ 𝑃𝐸𝑖 + 𝜀𝑖𝑡 (2)
Instead of regressing the absolute/nominal value of the performance indicators, we adjust the performance of each treated firm i by its counterfactual m, or 𝑦𝑖𝑡 = 𝑦𝑖𝑡− 𝑦𝑚𝑡. In this regression,
i is a firm index, t is a time index, and we control for the existence of time effects that impact
the performance evolution through the variable 𝑃𝑜𝑠𝑡𝑖𝑡, which takes a value of 1 for every performance metric observed after the transaction took place and 0 otherwise. 𝑃𝐸𝑖 is also a
dummy that captures the difference in adjusted performance between PEG and Strategic targets. As in any standard DID regression, the focus of our analysis is testing whether β3 is equal or
different from 0. Our β3 captures the interaction between the 𝑃𝐸𝑖 and 𝑃𝑜𝑠𝑡𝑖𝑡 variables, assessing the control-adjusted difference in performance between PE targets and Related targets, and its sign and significance show who is the best acquirer. Table C shows a brief description of the interpretation of each coefficient from our Equation (2)
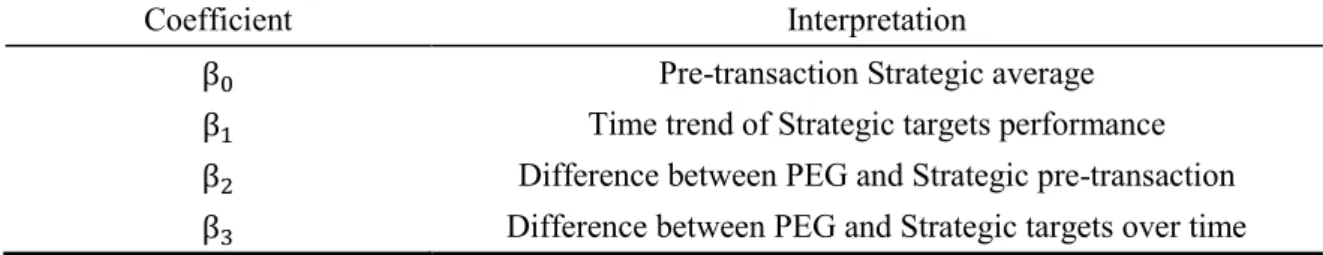
Table 3 – Interpretation of the coefficients of Equation (2)
Coefficient Interpretation
β0 Pre-transaction Strategic average
β1 Time trend of Strategic targets performance β2 Difference between PEG and Strategic pre-transaction
β3 Difference between PEG and Strategic targets over time
17
We acknowledge that, for both types of acquisitions, any change in performance may not be immediate, as any restructuring or new project still needs to be implemented before yielding the desired improvement, or performance might be managed, thus a single-year performance observation being possibly inaccurate. Hence, and to have a clearer view of the evolution of performance, we implement a second regression, defined as:
𝑦𝑖𝑡 = 𝛼 + ∑ 𝛽1𝑡𝑃𝑜𝑠𝑡𝑖𝑡 5 𝑡:𝑡≠0 + 𝛽2𝑃𝐸𝑖 + ∑ 𝛽3𝑡𝑃𝑜𝑠𝑡𝑖𝑡∗ 𝑃𝐸𝑖 5 𝑡:𝑡≠0 + 𝜀𝑖𝑡 (3)
where index t assumes every value between -1 and 5, except 0, the transaction year, which is used as performance benchmark. The coefficients β1𝑡 capture the difference between the
average performance at time t and the base period, t=0, controlling for time effects, and, as in equation (2), the focus of our analysis is testing whether any of the
β3𝑡 is equal or different from 0. Hence, our β3𝑡 estimates the interaction between the 𝑃𝐸𝑖 and 𝑃𝑜𝑠𝑡𝑖𝑡 variables, assessing the control-adjusted difference in performance between PEG targets
and Related targets over each year under analysis. We are mainly interested in the sign and significance of the β3𝑡 coefficients.
18
4. Results
4.1 Operational Performance
4.1.1 Profitability and Efficiency
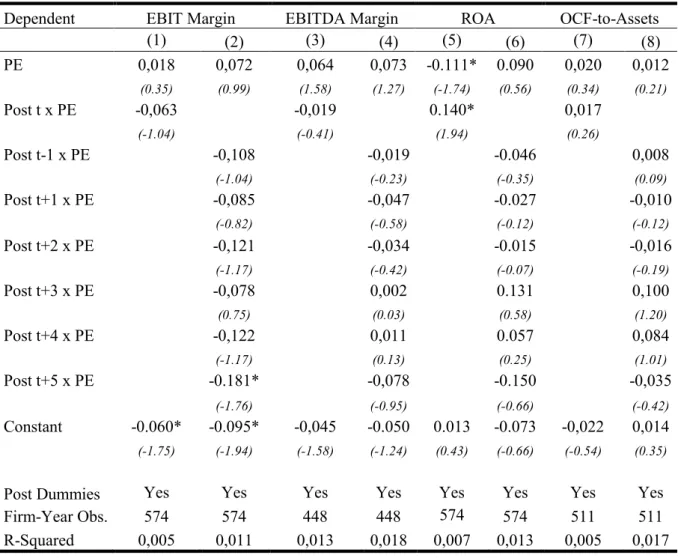
The focus of our primary analysis lies on changes in profitability and efficiency, as those are two of the sources of value creation in M&A (Krishnan and Park, 2002; Campa and Hernando, 2004; Lehto and Böckerman, 2008). Hence, to analyze if there are any operational performance differences between firms bought by PEG and those acquired by Strategics, we regress our DID equations (2) and (3) on four performance measures: EBITDA Margin (EBITDA over sales), EBIT Margin (EBIT over Sales), ROA (Net Income over Sales) and OCF-to-Assets (Net Income plus Depreciations over sales). The choice of these particular variables intends to decrease the probability of being manipulated by the management (Rosner, 2003). Results are presented in Table D.
Analyzing the columns (1) and (3) from Table D, our results from regression (2) suggest that PEG targets underperform vis-à-vis Strategics, with a yearly decline of 1.9% and 6.3% in terms of EBITDA and EBIT Margin, respectively (although neither of the coefficients is significant). Nevertheless, and even though the comparative PEG performance is negative, the results obtained suggest that PEG targets increase their profitability when compared to their matched counterfactuals, with a yearly increase of 6.4% and 1.8% regarding the EBITDA and EBIT, respectively. Considering columns (2) and (4), through a yearly analysis, we observe that the decline in profitability is not immediate, but rather progressive throughout the timespan considered, as our results suggest an underperformance of PEG targets of 18.1% in terms of EBIT Margin five years after the deal (significant at 10%), when compared to Strategics, which contradicts the results obtained by Cressy et al. (2007).
Contrary evidence is suggested by the analysis of efficiency measures, as results reported in columns (5) and (7) indicate that PEG targets register an post-transaction outperformance of 1.7% and 14.0% in terms of OCF-to-Assets and ROA (with the latter being significant at 10%), respectively. The PE coefficients for these two variables yield contradicting results: it suggests that PEG targets underperform its counterfactuals by 11.1% in terms of ROA (significant at 10%), whereas indicates that OCF-to-Assets increases by 2%.
19
Dependent EBIT Margin EBITDA Margin ROA OCF-to-Assets
(1) (2) (3) (4) (5) (6) (7) (8) PE 0,018 0,072 0,064 0,073 -0.111* 0.090 0,020 0,012 (0.35) (0.99) (1.58) (1.27) (-1.74) (0.56) (0.34) (0.21) Post t x PE -0,063 -0,019 0.140* 0,017 (-1.04) (-0.41) (1.94) (0.26) Post t-1 x PE -0,108 -0,019 -0.046 0,008 (-1.04) (-0.23) (-0.35) (0.09) Post t+1 x PE -0,085 -0,047 -0.027 -0,010 (-0.82) (-0.58) (-0.12) (-0.12) Post t+2 x PE -0,121 -0,034 -0.015 -0,016 (-1.17) (-0.42) (-0.07) (-0.19) Post t+3 x PE -0,078 0,002 0.131 0,100 (0.75) (0.03) (0.58) (1.20) Post t+4 x PE -0,122 0,011 0.057 0,084 (-1.17) (0.13) (0.25) (1.01) Post t+5 x PE -0.181* -0,078 -0.150 -0,035 (-1.76) (-0.95) (-0.66) (-0.42) Constant -0.060* -0.095* -0,045 -0.050 0.013 -0.073 -0,022 0,014 (-1.75) (-1.94) (-1.58) (-1.24) (0.43) (-0.66) (-0.54) (0.35)
Post Dummies Yes Yes Yes Yes Yes Yes Yes Yes
Firm-Year Obs. 574 574 448 448 574 574 511 511
R-Squared 0,005 0,011 0,013 0,018 0,007 0,013 0,005 0,017
Table 4 - DID Regression Estimates of the Differences in Profitability and Efficiency
Decomposing the results within the post-deal timespan, one can observe, in columns (6) and (8), an unexpected trend, with efficiency differences remaining statistically unchanged in the two years after the deal, overperforming in the two following years by between 8-10% and, in the fifth year, suffering a significant decrease, underperforming those acquired by Strategics by 3.5% in terms of OCF-to Assets and 15% in what concerns the ROA (although the coefficient
Table 4 – DID Regression Estimates of the Differences in Profitability and Efficiency This table presents results for the comparison between the post-deal operational performance between PEG targets and firms acquired by Strategic players. We use as profitability measures EBIT Margin (defined as EBIT over Operational Turnover) and EBITDA Margin (defined as EBITDA over Operating Turnover). Moreover, we use ROA (Net Income over Total Assets) and OCF-to Assets (defined as Net Income plus Depreciations, over Total Assets). PE is a dummy that takes the value of 1 when the acquirer is a Private Equity fund, and 0 otherwise. Post Dummies take the value of 1 if the observation relates to a period after the year of the deal, and 0 otherwise. Post t-1 up to t+5 dummies take the value of 1 for observation related to the year before the deal, up to 5 years after the deal, and 0 in any other case. Variables Post t-2 x PE until Post t+5 x PE are the interaction Variables between PE and Post dummies. T-stats are presented within brackets below each coefficient. The symbols ***, **, * indicate statistical significance at a 1%, 5% and 10% level, respectively.
20
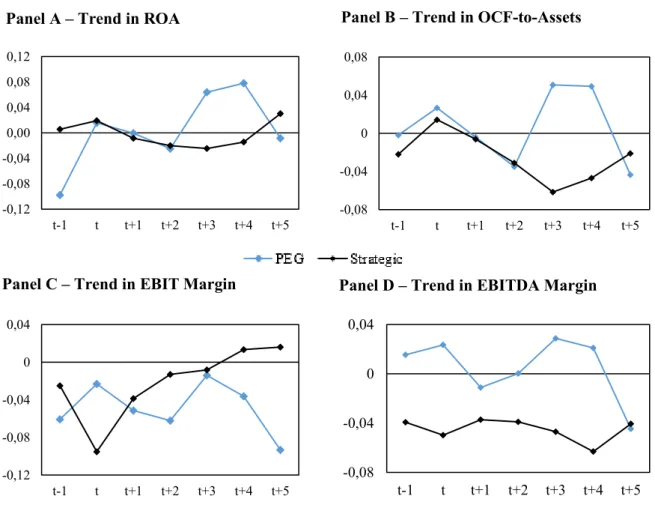
is not significant). These results are in line with those from Wright et al. (1996) in the sense that show a large improvement in performance starting in the third year, and with Wilson et al. (2012). Figure 2 shows the trend in profitability and efficiency metrics around and before the deal.
Figure 2 - Trends in Operating Performance
The PEG targets underperformance in profitability may arise from Strategics’ synergies, such as cost savings resulting from economies of scale and increased bargaining power (Moatti et al., 2015). Nevertheless, the greater underperformance of PEG targets in terms of EBIT when compared to the EBITDA, suggests higher depreciation charges vis-à-vis Strategic targets (Bernstein et al., 2017). -0,12 -0,08 -0,04 0,00 0,04 0,08 0,12 t-1 t t+1 t+2 t+3 t+4 t+5 -0,12 -0,08 -0,04 0 0,04 t-1 t t+1 t+2 t+3 t+4 t+5
Figure 2 – Trends in Profitability and Efficiency
This figure presents trends in profitability (EBIT Margin and EBITDA Margin), as well as in efficiency (ROA and OCF-to-Assets) between the year before the transaction, t-1, and five years after the year, t+5. Year t presents the year of ownership change. All measures are adjusted by the counterfactual, thus reflecting the evolution of “excess performance” of PEG targets and firms acquired by Strategic players. Metrics are obtained by calculating the difference between the average performance of each subsample in each year and the average performance of their peers for the same year.
Panel A – Trend in ROA Panel B – Trend in OCF-to-Assets
Panel C – Trend in EBIT Margin Panel D – Trend in EBITDA Margin
-0,08 -0,04 0 0,04 0,08 t-1 t t+1 t+2 t+3 t+4 t+5 -0,08 -0,04 0 0,04 t-1 t t+1 t+2 t+3 t+4 t+5
21
We also employed robustness tests to check for the validity of these results, by matching each firm from our sample with the five nearest neighbors from the control group. Neither the signs nor the significance of coefficients materially changed (Appendix 2).
4.2. Components of differentiated performance
Given the contradicting results yielded by the operational performance analysis, we further explore, with more detail, potential sources of value creation and/or destruction. Hence, to complement the previous analysis, we present the results from the same two regressions that relate PEG and Strategic targets’ value creation. Following Gaspar (2012), we consider Costs Management, Efficiency and Growth as sources of differentiated target performance.
4.2.1 Cost optimization
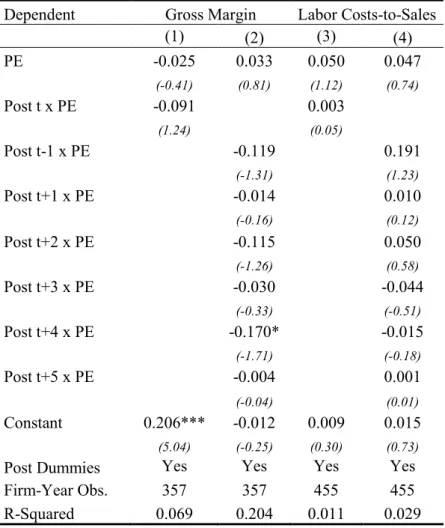
Albeit very incomplete as a proxy for all sources of expenses, the decomposition of cost optimization is made through the analysis of the Gross Margin (defined as Sales minus COGS, divided by Sales) and Labor Costs-to-Sales (Total Labor Costs over Sales)3. Table E presents
the results of fitting regressions (2) and (3) on the two dependent variables outlined above. The coefficients reported in columns (1) and (2) suggest that the Gross Margin of PEG targets decreases 9.1% after the deal, relative to Strategic targets, an underperformance that reaches as much as 17% in the fourth year after the deal (significant at 10%). These results indicate the existence of synergies, such as economies of scale and increased purchasing power at a raw-material level, inherent to related acquisitions (Moatti et al., 2015), altough contradicting previous studies (Gaspar, 2012).
Moreover, no significant differences are found in columns (3) and (4), with respect to Labor Costs-to-Sales results and trends for the period after the deal, although it is noteworthy to mention that PEG targets’ Total Employee Costs cover 19.1%. more as a percentage of Sales than those from Strategic targets’, in the year before the transaction (although not significant). This may indicate that PEG have an opportunistic behavior of purchasing inefficiently managed corporations (Amess et al., 2013), although we cannot exclude the existence of subsidiaries and parent companies of all targets to or from which employees might have shifted after the deal (Wilson et al., 2012).4
3 Other relevant variables, such as Selling, General and Administrative (SG&A) costs are not available. 4 Due to data limitations, we are not able to test this hypothesis.
22 Dependent Gross Margin Labor Costs-to-Sales
(1) (2) (3) (4) PE -0.025 0.033 0.050 0.047 (-0.41) (0.81) (1.12) (0.74) Post t x PE -0.091 0.003 (1.24) (0.05) Post t-1 x PE -0.119 0.191 (-1.31) (1.23) Post t+1 x PE -0.014 0.010 (-0.16) (0.12) Post t+2 x PE -0.115 0.050 (-1.26) (0.58) Post t+3 x PE -0.030 -0.044 (-0.33) (-0.51) Post t+4 x PE -0.170* -0.015 (-1.71) (-0.18) Post t+5 x PE -0.004 0.001 (-0.04) (0.01) Constant 0.206*** -0.012 0.009 0.015 (5.04) (-0.25) (0.30) (0.73)
Post Dummies Yes Yes Yes Yes
Firm-Year Obs. 357 357 455 455
R-Squared 0.069 0.204 0.011 0.029
Table 5– DID Regression Estimates of the Differences in Cost Structure
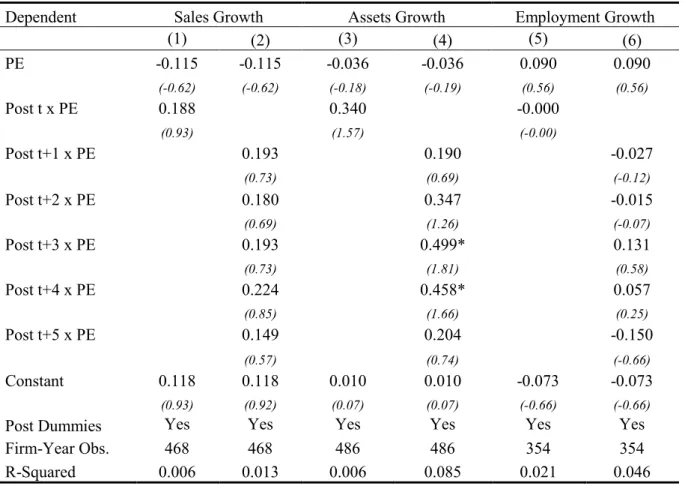
4.2.2 Growth
To capture sources of growth of acquired firms, we define the dependent variables Sales Growth (specified as Sales in year t divided by Sales in transaction year, minus one) and Assets Growth (Assets in year t divided by Assets in transaction year, minus one), as well as Employment Growth (Number of Employees in year t over Number of Employees in the transaction year, minus one) as a proxy for size (Gaspar, 2012; Amess et al., 2013).
Table 5 – DID Regression Estimates of the Differences in Cost Structure
This table presents results for the comparison between the post-deal cost structure between PEG targets and firms acquired by Strategic players. We use as cost measures Gross Margin (defined as Operational Turnover minus Costs of Goods Sold, over Operational Turnover) and Labor Costs-to-Sales (defined as Total Employee Costs divided by Operating Turnover). PE is a dummy that takes the value of 1 when the acquirer is a Private Equity fund, and 0 otherwise. Post dummies take the value of 1 if the observation relates to a period after the year of the deal, and 0 otherwise. Post t-1 up to t+5 dummies take the value of 1 for observation related to the year before the deal, up to 5 years after the deal, and 0 in any other case. Variables Post t-2 x PE until Post t+5 x PE are the interaction Variables between PE and Post dummies. T-stats are presented within brackets below each coefficient. The symbols ***, **, * indicate statistical significance at a 1%, 5% and 10% level, respectively.
23
We regress all three variables in an adaptation of Equations (2) and (3), where we exclude all observations from the transaction year, thus eliminating the need of maintaining variables Post t-1 and Post t-1 x PE, which are dropped. The results are shown in Table F.
Dependent Sales Growth Assets Growth Employment Growth
(1) (2) (3) (4) (5) (6) PE -0.115 -0.115 -0.036 -0.036 0.090 0.090 (-0.62) (-0.62) (-0.18) (-0.19) (0.56) (0.56) Post t x PE 0.188 0.340 -0.000 (0.93) (1.57) (-0.00) Post t+1 x PE 0.193 0.190 -0.027 (0.73) (0.69) (-0.12) Post t+2 x PE 0.180 0.347 -0.015 (0.69) (1.26) (-0.07) Post t+3 x PE 0.193 0.499* 0.131 (0.73) (1.81) (0.58) Post t+4 x PE 0.224 0.458* 0.057 (0.85) (1.66) (0.25) Post t+5 x PE 0.149 0.204 -0.150 (0.57) (0.74) (-0.66) Constant 0.118 0.118 0.010 0.010 -0.073 -0.073 (0.93) (0.92) (0.07) (0.07) (-0.66) (-0.66)
Post Dummies Yes Yes Yes Yes Yes Yes
Firm-Year Obs. 468 468 486 486 354 354
R-Squared 0.006 0.013 0.006 0.085 0.021 0.046
Table 6 – DID Regression Estimates of the Differences in Growth
In columns (1) and (3), we find some overperformance of PEG targets’ Assets Growth, with the size of firm increasing by 34% more than Strategic targets (even though the significance is fragile), accompanied by an outperformance of 18.8% in Sales. An analysis of column (4) shows that the assets increase occurs mainly until the third and fourth year, with Total Assets
Table 6 – DID Regression Estimates of the Differences in Growth
This table presents results for the comparison between the post-deal growth estimates between PEG targets and firms acquired by Strategic players. We use as growth metrics Sales Growth (defined as Operational Turnover in year t divided by Operational Turnover in the transaction year), Assets Growth (defined as Total Assets in year t divided by Total Assets in the transaction year) and Employee Growth (defined as Number of Employees in year t divided by Number of Employees in the transaction year). PE is a dummy that takes the value of 1 when the acquirer is a Private Equity fund, and 0 otherwise. Post dummies take the value of 1 if the observation relates to a period after the year of the deal, and 0 otherwise. Post t+1 up to t+5 dummies take the value of 1 for observation related to the year after the deal, up to 5 years after the deal, and 0 in any other case. Variables Post t x PE until Post t+5 x PE are the interaction Variables between PE and Post dummies. T-stats are presented within brackets below each coefficient. The symbols ***, **, * indicate statistical significance at a 1%, 5% and 10% level, respectively.
24
growing 49.9% and 45.8% more (both significant at 10%), respectively, despite its relative increase diminishing in the last year under analysis. A possible explanation for these results may be the improved access to cash resources provided by PEG (Berger and Udell, 1998), especially during/after a recession (Wilson et al., 2012), as well as the investment in innovation (Lerner et al., 2011). Notwithstanding, we must not neglect the role of PEG as providers of capital and liquidity, which is a key growth constraint (Beck and Demirguc, 2006). Observing columns (5) and (6), we find no differences in terms of Employee Growth in PEG targets compared to Strategics, which contradicts the decrease found by Gaspar (2012). Nevertheless, our results suggest an increase in the Labor force of 9% after the transaction, although not significant (consistent with Davis et al., 2013; Amess et al., 2013) when compared to the counterfactual.
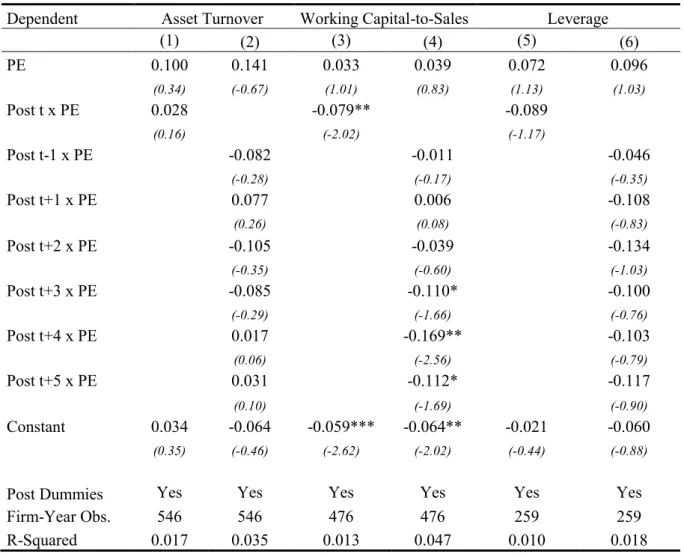
4.2.3. Efficiency
The last focus of our analysis deals with the efficiency in capital utilization. We define Asset Turnover as Assets over Sales, Working Capital-to-Sales as Inventory plus Receivables minus Payables, over Sales, and Leverage as Long-Term Debt over Total Assets. The results of fitting equations (2) and (3) in these variables are shown in Table G.
The coefficients reported in columns (3) and (4) suggest a significant increase in working capital management performance within PEG targets, which results in a Working Capital-to-Sales ratio 7.9% lower when compared with Strategics (significant at 5%), which is in line with the results obtained by Gaspar (2012). This increased performance is concentrated in the last three years under analysis, registering a difference as large as 17% in the penultimate year (significant at 5%), suggesting PEG bring enhanced inventory management and receivables collection capabilities to their targets5.
It is also noteworthy to point out that, in columns (5) and (6) PEG targets present lower level of long-term financing in their balance sheets, when compared with Strategics, although the level of indebtedness exceeds that of its peers. This missed opportunity to lever up might explain part of the PEG targets’ underperformance vis-à-vis its peers (Desbriéres and Schatt, 2002).
25 Dependent Asset Turnover Working Capital-to-Sales Leverage
(1) (2) (3) (4) (5) (6) PE 0.100 0.141 0.033 0.039 0.072 0.096 (0.34) (-0.67) (1.01) (0.83) (1.13) (1.03) Post t x PE 0.028 -0.079** -0.089 (0.16) (-2.02) (-1.17) Post t-1 x PE -0.082 -0.011 -0.046 (-0.28) (-0.17) (-0.35) Post t+1 x PE 0.077 0.006 -0.108 (0.26) (0.08) (-0.83) Post t+2 x PE -0.105 -0.039 -0.134 (-0.35) (-0.60) (-1.03) Post t+3 x PE -0.085 -0.110* -0.100 (-0.29) (-1.66) (-0.76) Post t+4 x PE 0.017 -0.169** -0.103 (0.06) (-2.56) (-0.79) Post t+5 x PE 0.031 -0.112* -0.117 (0.10) (-1.69) (-0.90) Constant 0.034 -0.064 -0.059*** -0.064** -0.021 -0.060 (0.35) (-0.46) (-2.62) (-2.02) (-0.44) (-0.88)
Post Dummies Yes Yes Yes Yes Yes Yes
Firm-Year Obs. 546 546 476 476 259 259
R-Squared 0.017 0.035 0.013 0.047 0.010 0.018
Table 7– DID Regression Estimates of the Differences in Efficiency
4.3 Findings Discussion
PEG targets’ underperformance at the EBIT Margin level and the overperformance in ROA outlined in Section 4.1.1 present contradictory results in analyzing if PEG have superior performance when compared to Strategic acquirers. Hence, it is natural that we enquire i) the possible explanations behind it and ii) the areas of greater under- and overperformance of PEG.
Table 7 – DID Regression Estimates of the Differences in Efficiency
This table presents results for the comparison between the post-deal efficiency metrics between PEG targets and firms acquired by Strategic players. We use as measures Asset Turnover (defined as Operational Turnover over Total Assets), Working-Capital-to-Sales (defined as Receivables plus inventories minus payables, over Sales) and Leverage (defined as Long-Term Debt over Total Assets). PE is a dummy that takes the value of 1 when the acquirer is a Private Equity fund, and 0 otherwise. Post dummies take the value of 1 if the observation relates to a period after the year of the deal, and 0 otherwise. Post t-1 up to t+5 dummies take the value of 1 for observation related to the year before the deal, up to 5 years after the deal, and 0 in any other case. Variables Post t-2 x PE until Post t+5 x PE are the interaction Variables between PE and Post dummies. T-stats are presented within brackets below each coefficient. The symbols ***, **, * indicate statistical significance at a 1%, 5% and 10% level, respectively.
26
Results get even more ambiguous as our sample indicates a 34% higher growth of PEG targets’ assets in comparison with Strategics targets’, which inherently points to an even superior performance in terms of net income besides the 14.0% ROA. Moreover, our data also suggests that Sales of firms acquired by PEG also have a higher increase than those purchased by Strategics, which should, in theory, decrease the weight (as a percentage of sales) of any fixed charges present above the EBIT Margin, such as some SG&A costs (although we acknowledge that the higher increase in Assets might induce higher depreciation charges). Thus, we are left with interest costs and tax expenses as possible explanations for the differences in performance, which we cannot properly analyze due to data constraints. Regarding interest expenses, the lower level of leverage of PEG targets, together with the enhanced access to better credit conditions of PE-backed firms (Ivashina and Kovner, 2011), may result in lower interest rate spreads vis-à-vis strategic-backed enterprises. Furthermore, Badertscher et al. (2013) suggest that corporate tax avoidance is larger in PE-backed firms when compared with other privately held enterprises, which might also help explain our ambiguous results.
Further exploring the particular sources of value both from PEG and Strategic Buyers discussed in sections B, C and D, our evidence is consistent with the Strategic targets’ superior benefit from synergies, allowing for costs savings that generate a higher Gross Margin, thus enhancing profitability at the EBIT level. Notwithstanding, this overperformance is diminished by enhanced capabilities of PEG in terms of efficiency, namely regarding working capital management, resulting in lower Working Capital-to-Sales, and growth, driven by superiorly increasing the asset base.
We also test and find that our results are robust to an increase in the matched sample, by performing 1-to-5 nearest neighbor matching (Appendix 2). However, when running our DID regressions across subsamples characterized by the transaction year, we find evidence (as shown in Appendix 3) that the under and overperformance results are not persistent across all the transaction years, thus raising the issue of performance being partly explained by a matter of timing in acquisitions.