Quantitative Equity Portfolio Management Strategy:
A Combination of Fundamental Value and
Risk-managed Momentum
Thomas Dey
Dissertation written under the supervision of Professor
Corrêa Guedes
Dissertation submitted in partial fulfilment of requirements for the
MSc in International Finance, at the Universidade Católica
Title Quantitative Equity Portfolio Management Strategy: A Combination of Fundamental Value and Risk-managed Momentum
Author Thomas Dey
Abstract
This dissertation examines return predictability from B/M and Momentum for US stocks for the period 1970-2015. Particularly, it investigates whether a simple fundamental screening (F-Score) within the high B/M quintile helps separating winners (financially undistressed firms) from losers (financially distressed firms). Finally, it identifies whether a simple 50-50 combination of HML (High-Minus-Low) and risk-adjusted WML (Winners-Minus-Losers) portfolios generates significant abnormal returns (alpha) for the full sample and sub-sample periods. In accordance with the literature, Fama-MacBeth cross-sectional regressions reveal that Momentum and B/M offer significant and persistent return predictive ability. Conflicting with previous evidence (Piotroski 2000), no return predictability in the cross-section of firms is detected for the interaction term between the F-Score and B/M. Return improvements from conditioning the high B/M quintile on high F-Scores are reduced to the 1976-1996 sample period of Piotroski (2000). Contrary, the target volatility momentum adjustment (Barroso & Santa-Clara 2015) does yield significant risk-return improvements, duplicating the Sharpe-Ratio from the Raw WML portfolio, reducing the maximum drawdown and improving the third and fourth moments of the return distribution. The 50-50 HML and WML* (target vol-atility WML) portfolio strategy significantly outperforms the CRSP market-value weighted portfolio and the S&P500 from 1970-2015, although the outperformance was strongest from 1970-2000. Ultimately, both the pure HML - WML* and the HML_F-Score - WML* com-binations (50-50) generated highly statistically significant abnormal monthly returns of 0.8% when setting the Carhart Four-Factor Model as the relevant asset-pricing model benchmark.
Título Quantitative Equity Portfolio Management Strategy: A Combination of Fundamental Value and Risk-managed Momentum
Autor Thomas Dey
Abstrato
Èsta tese analisa a previsibilidade de retornos de ações através de B/M e Momentum nos EUA no período 1970-2015. Particularmente, investiga se uma estratégia de triagem por da-dos fundamentais (F-Score; Piotroski 2000) no quintil B/M superior contribui a separar ações de empresas com balanços financeiros sólidos (‘Winners’) de empresas com balanços finan-ceiros fracos (‘Losers’). Finalmente, a tese identifica se uma estratégia simples de uma com-binação 50-50 de portfólios de HML (High-Minus-Low) e WML (Winners-Minus-Losers) com ajustamento de risco genera um retorno anormal (alpha). De acordo com a literatura, regressões de Fama-MacBeth revelam que Momentum e B/M possuem capacidade signifi-cativa e persistente de previsões de retornos. Em contraste com Piotroski (2000), não conse-gue-se identificar previsibilidade significativa de retornos na cross-section de ações em relação á interação entre o F-Score e B/M. Ganáncias de triagens por F-Score no quintil B/M superior reduzem-se ao período da amostra original de Piotroski (2000). Pelo contrário, o ajustamento de WML á volatilidade constante (Barroso & Santa-Clara 2015) produz melhorias significantes de retorno e risco: duplica o Sharpe-Ratio da WML simples, reduz a perda máxima num mes, e melhora os terceiros e quartos momentos da distribuição de retor-nos mensuais. A estratégia 50-50 HML e WML* (ajustado por volatilidade) supera signifi-cativamente os retornos dos portfólios de mercado CRSP e S&P500 de 1970 á 2015, mesmo que o melhor desempenho tivesse tido lugar entre 1970-2000. Finalmente, tanto a com-binação HML-WML* quanto a comcom-binação HML_F-Score-WML* generaram retornos anormais de 0.8% por més (altamente significativos) em relação ao Carhart Four-Factor Model.
Acknowledgements
This dissertation required a great amount of effort and dedication. Undoubtedly, the major challenge was to get familiar with how to tackle an empirical research project with large databases and to develop the necessary programming skills to carry out the required calculations within a quantitative portfolio management context. I am thankful for the support I received from several people along the way in order to compose this dissertation.
First, I would like to express my gratitude towards my supervisor, Professor Corrêa Guedes. Thank you for your patience, availability and the constructive feedback which was indispensable as a wise guidance for consistently structuring an empirical disser-tation.
Additionally, I am thankful to Católica Lisbon School of Business & Economics to preparing me for this dissertation during my first year of studies at Master level by providing an intense curriculum that combined theoretical concepts and practical (com-putational) implementations in countless groupworks. Also, I appreciate the around-the-clock availability of the Finance Laboratory, which enabled me to work on my dis-sertation at any time. Further, I am thankful to Fundação para a Ciência e Tecnologia (FCT) for their support.
Last, but not least, I would like to express my gratefulness towards my fellow students, especially Mr Simon Schmidt, who shared with me invaluable functional programming skills in R and inspiring conversations on my balcony at late hours.
Table of contents
List of Figures & Tables ... III List of Abbreviations ... IV
1 Introduction ... 1
2 Literature Review ... 2
2.1 Aim of Literature Review ... 2
2.2 Risk Factors, Pricing Anomalies and the Efficient Market Hypothesis ... 2
2.3 Value ... 3
2.3.1 Definition of Value ... 3
2.3.2 Cross-sectional B/M Return Predictability for US Stocks ... 4
2.3.3 Theoretical Explanations of the Value Effect ... 5
2.3.3.1 Rational Explanations of the Value Effect ... 5
2.3.3.2 Behavioural Explanations of the Value Effect ... 6
2.3.4 Financial Performance Signals: Composite F-Score ... 7
2.4 Momentum ... 7
2.4.1 Definition of Momentum ... 7
2.4.2 Cross-sectional Momentum Return Predictability for US stocks ... 8
2.4.3 Theoretical Explanations of the Momentum Effect... 8
2.4.3.1 Rational Explanations of the Momentum Effect ... 8
2.4.3.2 Behavioural Explanations of the Momentum Effect ... 10
2.4.4 Target Volatility Momentum Strategy ... 11
2.5 Interaction between Value and Momentum ... 12
3 Data and methodology ... 12
3.1 Research design ... 12
3.2 Sample selection & Methodology ... 14
3.3 Calculation of returns and firm characteristics ... 15
3.4 Descriptive Statistics of the Sample ... 16
4 Cross-sectional regressions of returns on stock characteristics ... 18
4.1 Cross-sectional Regressions: F-Score and B/M ... 18
4.2 Cross-Sectional Regressions: Beta, Size, B/M and Momentum ... 21
5 Portfolio Construction ... 24
5.1 Portfolio Sorts conditional on B/M, F-Score and Momentum ... 24
5.3 Value & Risk Adjusted Momentum Combination ... 27
5.4 Performance across sub-samples ... 29
5.5 Critical Review of the Methodology ... 30
6 Conclusion ... 31
Appendix ... 32
List of Figures & Tables
Figure 1: Momentum Weights and Cum. Returns ... 26
Figure 2: Full Sample Period Combined Portfolio Returns ... 28
Table 1: Descriptive Sample Statistcs ... 17
Table 2: Cross-sectional regressions of returns on B/M and F-Score ... 19
Table 3: Cross-sectional regressions of returns on Beta, Size, B/M and Momentum ... 22
Table 4: Monthly Market-Adj. Returns to B/M, F-Score and Intersection Portfolios ... 24
Table 5: Monthly Market Adj. Returns to Momentum Portfolios ... 25
Table 6: Volatility Target Momentum vs. Raw Momentum ... 26
Table 7: Combined HML (& F-Score) and Momentum Portfolio Returns ... 27
Table 8: Cahart Four-Factor Model (CF4M) Risk-Adjusted Abnormal Returns ... 29
List of Abbreviations
APT Arbitrage Pricing Theory
B Book value of equity (per share) B/M Book-to-market equity
bps basis points (100 basis points≙ 1%) C4FM Carhart Four-Factor Model
CAPM Capital Asset Pricing Model EMH Efficient Markets Hypothesis
FF3FM Fama & French Three-Factor Model
HML High-minus-low (with respect to book-to-market equity)
HML_F-Score High B/M and High F-Score minus Low B/M and low F-Score portfolio
M Market value of equity (per share) MOM Momentum
NASDAQ National Association of Securities Dealers Automated Quotations NYSE New York Stock Exchange
OLS Ordinary Least Squares P/E Price-to-earnings
SMB Small-minus-big (with respect to market capitalization) WML Winners-minus-losers (long-short) portfolio
1 Introduction
A considerable body of research reveals that US (and other developed market) stock (and other asset classes) returns exhibited significant and persistent value and momentum premia over the last decades. The question whether momentum and value effects can be explained within a risk-based asset-pricing framework on the one hand, or a behavioural framework on the other hand, is of practical relevance for the theoretical (empirical) motivation and the risk-adjusted performance evaluation of a portfolio strategy that aims to capture value and momen-tum premia. Both effects, for instance, could be caused by irrational behavior of market partic-ipants. However, if this was the case, one would expect momentum returns to have diminished since the industry became aware of such an easily implementable strategy. If this reasoning was true, the persistent momentum effect would cast doubt on the Efficient Market Hypothesis (EMH), a central paradigm to the behavior of asset prices.
The research aims and contributions of this dissertation are twofold. First, using a sample of all US common and preferred shares returns and financial statement data from the CRSP and Compustat database for the period 1964-2015, the cross-sectional return predictability of firm characteristics – with a focus on value, a fundamental score (F-Score) and momentum – ac-cording to the Fama-Macbeth methodology is studied. This exercise is of a replicating nature in the sense that it tries to confirm the abundant evidence in the literature on the value and momentum effects over time. Additionally, I try to identify whether simple fundamental data scores improve value returns. Secondly, the dissertation contributes to the literature by investi-gating whether a combination of fundamentally screened value and risk-managed momentum portfolios is able to generate abnormal returns, which cannot simply be described by a linear combination of the well-known value and momentum portfolios. This exercise further com-prises checks on robustness, economic significance and practical implementability of the strat-egy. Therefore, the dissertation is able to provide an investment strategy for (institutional) value and momentum investors in the US equity segment with ability to short-sell stocks.
2 Literature Review
2.1 Aim of Literature Review
The aim of this chapter is to summarise and discuss in detail the literature on value and momentum factors. From the equity portfolio management perspective, it is partic-ularly important to examine the persistence of factors or anomalies across time, as well as to provide theoretical explanations in a risk-based and behavioural framework for their existence. The next section provides a distinction between risk factors and anom-alies; a comprehensive review of the literature – in a chronological order where appro-priate – follows. For the sake of this dissertation, reviews of empirical results refer to US stocks only.
2.2 Risk Factors, Pricing Anomalies and the Efficient Market Hypothesis
The portfolio strategy developed in this paper relies on exploiting the predictability of returns by factors or anomalies, which can be underlying firm characteristics of a stock (value) or relative magnitudes of past returns (momentum), among others. Alt-hough this dissertation does not intend to cover the dispute about the validity of the Efficient Market Hypothesis (EMH), an initial outline concerning the terms factors, anomalies and market efficiency in the context of asset pricing is appropriate.
Fama (1970) denoted efficient markets as those in which prices always fully reflect available information according to ‘some model of equilibrium’, while leaving the na-ture of that model unspecified. Multi factor models as presented by Ross (1976) within the Arbitrage Pricing Theory (APT) framework state that the price of an asset is related to its sensitivity to one or more factors and their corresponding risk premia. An anom-aly, as specified by Tversky and Kahnemann (1968), is a behaviour whose deviation from the normative model is too widespread to be ignored. Accordingly, in the finance literature price behaviours that cannot be reconciled with conventional asset pricing models are termed anomalies. Therefore, in comparison to a risk factor, an anomaly does not form part of the right-hand side of a multi-factor asset pricing equation and provides no compensation for systematic risk. However, the abundance of reported anomalies in the literature does not necessarily imply the rejection of the Efficient Mar-ket Hypothesis. The latter is a joint hypothesis stating that marMar-kets are informationally
efficient and prices behave according to the true equilibrium asset pricing model. Con-sequently, a rejection of the joint null hypothesis provides no isolated information con-cerning either part of the hypothesis; therefore, a conclusion concon-cerning the validity of the EMH on the grounds of this joint hypothesis test is misleading.
The outline above clarifies that the term market (price) anomaly makes no explicit, positive statement about the EMH. If a return anomaly can be attributed to compensa-tion for bearing systematic risk, i.e. it is a risk factor rather than an anomaly and can be rationally motivated within asset-pricing theory, the underlying asset pricing model may be inappropriate, which need not be an indication of market inefficiency (Jegadeesh 2011). However, if a return anomaly can only be explained by behavioural models, a market inefficiency might be present. At a minimum, a return anomaly sug-gests that a price (or return) behaviour is inconsistent with existing asset pricing theo-ries (Schwert 2003). The differentiation between risk factors and anomalies as sources of returns is important concerning the expected persistence of portfolio returns, since anomalies are expected to be traded away in the long-run.
2.3 Value
2.3.1 Definition of Value
The ‘value effect’ refers to the empirical relationship between stock returns and val-uation ratios of a stock. The general idea of a ‘value stock’ is that it seems to be cheap based on some specified attribute(s) (Chan et al. 1995). Although the are many proxy variables for the ‘value effect’, this dissertation only covers the most popular one.
Rosenberg et al. (1985) define the ‘book/price’ strategy as a strategy that buys stocks with high book value of common equity (B) per share in relation to market price per share (M). Fama and French (1992) denominate this ratio as book-to-market (B/M):
𝐵𝑜𝑜𝑘 − 𝑡𝑜 − 𝑚𝑎𝑟𝑘𝑒𝑡𝑡 =
𝐵𝑜𝑜𝑘 𝑉𝑎𝑙𝑢𝑒 𝑜𝑓 𝐶𝑜𝑚𝑚𝑜𝑛 𝐸𝑞𝑢𝑖𝑡𝑦𝑡−1
𝑀𝑎𝑟𝑘𝑒𝑡 𝑉𝑎𝑙𝑢𝑒 𝑜𝑓 𝐶𝑜𝑚𝑚𝑜𝑛 𝐸𝑞𝑢𝑖𝑡𝑦𝑡, (1)
where t denotes the year. In order to avoid look-ahead bias with accounting data, the B of December for year t-1 is used to compute the book-to-market ratio in June of year
as ‘value’ stocks. The value portfolio (high-minus-low or HML) is a zero-investment strategy that buys high B/M and shorts low B/M stocks (Fama & French 1995).
2.3.2 Cross-sectional B/M Return Predictability for US Stocks
Rosenberg et al. (1985) find that the ‘book/price’ strategy delivers statistically sig-nificant abnormal returns for US stocks traded on NYSE1 and/or NASDAQ Stock
Ex-change for the period from 1980 to 1984. Following the cross-sectional regression ap-proach of Fama & MacBeth (1973), Fama & French (1992) regress the cross-section of NYSE, AMEX and NASDAQ stock returns on several firm characteristics hypothe-sized to explain expected returns. The t-statistics of time-series average slopes indicate whether the characteristics explain the cross-section of returns. They find that the aver-age slope (0.5%) from simple regressions of monthly returns on the natural logarithm of book-to-market for their sample between July 1963 and December 1990 is highly significant, given the t-statistic of 5.71. Importantly, they show that the B/M coefficient remains highly significant (t-statistic of 4.44) after controlling for the ‘size effect’. For their sample of NYSE, NASDAQ and AMEX listed stocks from 1963 to 1991, Fama & French (1993) find that the B/M mimicking portfolio explains common variation in the cross-section of returns. Likewise, in a sample of NYSE and AMEX traded stocks for the period 1968-1991, Chan et al. (1995) find a persisting positive relationship be-tween B/M sorted portfolios and returns, adjusting for selection bias. More recent up-dates confirm the existence of a Value premium in US (and international) stock returns (Fama & French 2012, Asness, Moskowitz and Pedersen 2013).
In comparison to aforementioned findings, Pontiff & Schall (1997) find mixed evi-dence for the relationship between book-to-market ratios and future market returns for DIJA and S&P500 listed stocks for the period from 1920 to 1993. The predictability varies across sub-sample periods and stock exchanges. While significant for monthly and annual returns from 1926 to 1959 (DIJA), the return predictability of B/M abates from 1959 to 1994. Whereas the return predictability of B/M for S&P500 in comparison to DIJA listed stocks is better from 1959 onwards, they cannot reject the null hypothesis of no return predictive ability. These findings are in accordance with the ones from Kothari and Shanken (1997), who find no return predictive ability of B/M for DIJA
listed stocks for the subperiod from 1963-1991. Fama & French (2015) report that the value effect (HML) disappears after including profitability and investment factors (among others) into the Fama & French three-factor model (FF3M); they also provide a theoretical explanation of why B/M is just a noisy proxy for ‘profitability’ and ‘investment’.
2.3.3 Theoretical Explanations of the Value Effect 2.3.3.1 Rational Explanations of the Value Effect
The literature about (rational) explanations of the ‘value effect’ is abundant; rather than covering all explanations, sections 2.3.3.1 and 2.3.3.2 aim at providing an over-view of the most commonly discussed ones.
Fama & French (1992) suggest that B/M could proxy the relative financial distress of a firm, thereby building upon the idea of Chan and Chen (1991), who report that firms with high B/M are likely to have lost market value due to both poor performance and poor prospects, and therefore exhibit higher cost of capital, i.e. higher expected returns. Fama & French (1992) further postulate that B/M provides a separation of firms concerning various measures of economic fundamentals and thus reflects the relative prospects of firms. Indeed, Chen & Zhang (1998) confirm that value stocks are riskier in terms of financial distress, high leverage and uncertainty of future earnings. Yet, if book-to-market as a proxy for value is a common risk factor in stock returns, it must be driven by a related common risk factor in shocks to expected earnings. Stock prices equal discounted expected future dividends, which are a function of earnings, so that expected earnings shocks to B/M must precede return shocks to B/M. However, French & Fama (1995) find no evidence that the B/M factor in stock returns follows the B/M factor in earnings, which represents a puzzle.
The aforementioned puzzle is intensified by Griffin & Lemmon (2002), who find that among extremely, financially distressed firms the difference in returns between high and low B/M stocks is abnormally large in relation to the difference in returns between high and low B/M stocks for firms that are less financially distressed. This implies that B/M contains information other than, or beyond, financial distress. Similarly, Campbell et al. (2008) report evidence that distressed portfolios have low returns, but high
loadings on HML (High-minus-low), the Fama-French value risk factor, i.e. a portfolio that is long high B/M and short low B/M stocks. This finding challenges the proposition that B/M proxies financial distress and, further, it provides evidence against a rational (risk-based) explanation of the book-to-market premium and the value effect (Griffin & Lemmon 2002), since the former is a proxy for the latter.
2.3.3.2 Behavioural Explanations of the Value Effect
Relying on experimental evidence that many investors are prone to overreaction, i.e. they overweight recent information and underweight base rates, De Bondt & Thaler (1987) find evidence in favour of the hypothesis that stock prices temporarily depart from underlying fundamentals. Investors extrapolate past earnings growth (negative or positive) too far into the future, thus are overly pessimistic (optimistic) about high (low) B/M stocks. Consequently, contrarian investors tend to outperform the market if they invest disproportionately into ‘unglamorous’ value stocks. Interestingly, Fama & French (1992) acknowledge the plausibility of the overreaction hypothesis, stating that B/M could capture the mean-reversion behaviour of irrational markets. Lakonishok et al. (1994) test a contrarian model – measuring the relationship between past growth in sales, earnings and cash flows and expected future performance as implied by price multiples – and find that differences in expected future growth rates between high and low value stocks are linked to past growth, and are overestimates of the actual future growth differences. Remarkably, they find no evidence in support of the proposal by Fama & French (1992) to incorporate value as a risk factor into asset-pricing models.
Building upon the mispricing argument of Lakonishok et al. (1994), Griffin & Lem-mon (2002) argue that the value effect is most likely to occur in firms with high degrees of information uncertainty. After sorting stocks into quintiles according to financial distress, they find that the difference in abnormal earnings announcement returns be-tween high and low B/M stocks is greatest for stocks of the highly-distressed quintile. These stocks are also the most difficult to value, which supports the argument that mis-pricing is positively related to information uncertainty (difficulty to value a stock).
Lakonishok et al. (1992) hypothesize an agency problem. Institutional investors might prefer growth stocks, since they are easy to justify due to good performance in
the past. Contrary to value stocks, they are unlikely to become financially distressed in the medium term and therefore seem to be a solid investment. According to the Noise Trader Risk model of De Long et al. (1990a), rational investors have shorter horizons than are required for value strategies to consistently pay off. The risk of prices moving further away from fundamentals due to trading activities of noise traders is imposed on rational arbitrageurs, who cannot arbitrage the mispricings away (liquidity constraints, time horizon and risk of increasing mispricings).
2.3.4 Financial Performance Signals: Composite F-Score
Piotroski (2000) claims that accounting-based fundamental analysis is able to shift the return distribution from high B/M portfolios to the right by excluding financially distressed firms. He presents a simple aggregate score of several accounting measures to identify firms with strong prospects within the high B/M quintile. The idea is built upon the finding that high B/M portfolio returns rely on the strong performance by relatively few stocks that compensate for the poor performance of many stocks (Ros-enberg et al. 1984; Fama & French 1992; Lakonishok et al. 1994). Discarding poor stocks increases annual returns by 7.5% between 1976 and 1996. However, this benefit is concentrated in small-and medium sized firms.
2.4 Momentum
2.4.1 Definition of Momentum
The ‘momentum effect’ refers to the evidence that stocks that performed the best (worst) for the last 12 months continue to perform the best (worst) over the next three to 12 months (Jegadeesh, 2011). Since evidence emerged that stock returns exhibit short-term reversal (Jegadeesh 1990; Lehmann 1990), the following definition of the momentum portfolio has gained acceptance in the literature:
𝑟𝑊𝑀𝐿,𝑡 = ∑ 𝑤𝑖 𝑊,𝑖,𝑡𝑟𝑖,𝑡− ∑ 𝑤𝑖 𝐿,𝑖,𝑡𝑟𝑖,𝑡 , (2)
where WML denotes ‘winners minus losers’, ∑ 𝑤𝑖 𝑊,𝑖,𝑡𝑟𝑖,𝑡 (∑ 𝑤𝑖 𝐿,𝑖,𝑡𝑟𝑖,𝑡) is the value (or
equally) weighted return of the highest (lowest) decile/quintile/third based on monthly stock returns from 𝑡 − 12 to 𝑡 − 1 (Carhart 1997; Fama & French 2012).
2.4.2 Cross-sectional Momentum Return Predictability for US stocks
For US stocks, Jegadeesh (1990) reports (highly) significant positive autocorrelation for (one-month) twelve-month lagged returns. More importantly, for the period 1934-1987 the CRSP monthly returns on a zero-investment strategy of extreme decile port-folios based on (autocorrelation-) predicted returns are statistically and economically significant. Jegadeesh & Titman (1993) provide evidence on returns of several specifi-cations of zero-cost, ‘winner minus losers’ portfolios, all of which are positive and sta-tistically significant. Interestingly, the abnormal performance of the zero-investment portfolios is attributable to the the buy side (‘winners’), and risk-adjusted returns re-main significant after accounting for conservative estimates (0.5% one-way) transac-tion costs.
Generally, research of large data sets (Fama & French 2012; Asness et al. 2013) de-livers evidence in favour of statistically significant momentum returns for US stocks. Contrary, Cakici & Tan (2013) find no significant momentum returns for US stocks, a finding that equally applies to big and small stocks. An explanation of why they could not find momentum returns previously reported in the literature for US stocks is not provided.
2.4.3 Theoretical Explanations of the Momentum Effect 2.4.3.1 Rational Explanations of the Momentum Effect
A sizeable body of research states that momentum profits arise because winner stocks are riskier than loser stocks. This section focuses on explanations in which riskiness of momentum profits is reported to vary across macroeconomic states and time.
Sagi & Seasholes (2006) hypothesize that if one is able to identify winners with rel-atively high autocorrelated returns, profits from a momentum strategy can be enhanced. They find that firms with valuable growth options have higher return autocorrelation, and – importantly – provide around 10% higher momentum profits per year. The reason is that growth options are riskier, and firms that performed well in the past are more likely to exploit their growth options. Eventually, higher risk should come with higher returns, which could explain the momentum effect. Additionally, if firms are more likely to exercise their growth options during up markets than during down markets,
autocorrelation of returns is higher during up markets, which explains why momentum profits are procyclical. This idea builds upon the reasoning of Johnson (2002), who states that because of the convexity of equity prices in relation to expected growth, stock returns exhibit higher sensitivity to changes in expected growth rates when the latter are high.2 Therefore, stocks with higher sensitivity to industrial production – a
common hypothesized risk factor for equities – should have higher growth rates and higher expected returns in times of increasing industrial production (expansions). In-deed, Liu & Zhang (2008) find that winner stocks have temporarily higher growth rates. Expanding the arguments of Sagi & Seasholes (2006), Kim et al. (2014) argue that leverage and growth options are the drivers of the relative riskiness of winner and loser stocks, and hence time-varying momentum profits. Recent winners (equity apprecia-tion) are more likely to decrease financial leverage and increase the value of growth options than recent losers. During expansions, growth options have a higher effect than leverage, so that riskier winners should have higher expected returns. During reces-sions, growth options are less relevant than the leverage effect, so that now riskier losers should exhibit higher expected returns. Therefore, momentum returns could be moti-vated by a procyclicality premium.
A counterargument is the evidence of momentum profits in other asset classes, where the convexity argument does not apply (Daniel & Moskowitz 2013). Thus, there are further time-varying risk explanations of momentum strategies. Daniel & Moskowitz (2013) argue that momentum portfolios exhibit negative skewness and occasional (per-sistent) crashes. They find that the beta of the momentum strategy depends on whether the market recently experienced a rally or a decline: following a market crash, the mo-mentum portfolio is long small beta stocks, i.e. stocks that crashed less than the market, and short high beta stocks. If the market rebounds, the short side of the portfolio (high beta stocks) outperforms the long side (small beta stocks). The fact that a hedging strat-egy based on ex-ante betas does not improve momentum performance, supports this explanation as a systematic source of risk. Barroso & Santa-Clara (2015) find that risks
2 See convexity of bonds as a comparable effect: The absolute price change for the same basis point
to momentum investing are concentrated in third and fourth moments of the return dis-tribution. However, they claim to significantly improve momentum returns by a target volatility scaling scheme, thereby reviving the momentum puzzle.
2.4.3.2 Behavioural Explanations of the Momentum Effect
Although evidence points towards the existence of serial correlation in stock returns, it remains controversial whether underreaction or delayed overreaction are the under-lying force (Jegadeesh 2011).
Underreaction
Barberis et al. (1998) show how a conservatism bias, meaning that investors rela-tively underweight new information to form their expectations, enables momentum profits, since prices will adjust slowly to new information and only once prices fully incorporate all available information, return predictability is removed. Another source for underreaction is the disposition effect (Shefrin & Statman 1985), which suggests that investors sell winners too early and hold to losers too long. Grinblatt & Han (2005) provide evidence that the disposition effect creates underreaction to public information and thus a spread between stock prices and fundamentals in such a way that past win-ners tend to be undervalued and past losers tend to be overvalued, which creates mo-mentum profits.
Delayed Overreaction
De Long et al. (1990b) developed the idea of overreaction, where rational speculators anticipate positive feedback trading of the market. Thus, when receiving good news about a stock, rational speculators trade on these news knowing that their trades will induce further buying activity. In combination with representative heuristics (Tversky & Kahneman 1974), investors extrapolate recent earnings growth too far into the future, leading to winners’ prices overshooting their fundamentals in the short-term, and finally to return reversals in the long-term (De Bondt & Thaler 1987; Barberis et al. 1998). Jegadeesh & Titman (1993) provide evidence (return reversals after 1y) supporting the idea that momentum profits are due to delayed overreaction to firm-specific infor-mation.
A major critic about behavioural explanations refer to the following argument: if be-havioural models were true, arbitrageurs should have traded away the momentum anomaly since its publication. However, momentum portfolios are formed by small and illiquid stocks, which are expensive to trade, so limits of arbitrage in terms of transac-tion costs, risk aversion or leverage (see Noise Trader Risk of De Long et al 1990) may justify momentum’s persistence as a behavioural anomaly (Liu 2012). Evidence about transaction costs being substantial enough to eliminate momentum profits is mixed.
2.4.4 Target Volatility Momentum Strategy
Although momentum historically provided higher sharpe ratios than value for in-stance, its return distribution is negatively skewed and leptokurtic, resulting in rare but large crashes. Barroso & Santa-Clara (2015) claim that by scaling the long-short mo-mentum portfolio by its realized volatility over the past 6 months, improves the Sharpe ratio from 0.53 to 0.97 by reducing the excess kurtosis (negative skewness) from 18.24 (-2.47) to 2.68 (-0.42) for US stock returns from 1926-2011. Also, the maximum draw-down is improved significantly (from -96-96% for raw momentum to -45.20% for risk-managed momentum). The volatility forecast and scaled returns, respectively, are cal-culated as follows: 𝜎̂𝑊𝑀𝐿,𝑡2 = 21 ∑ 𝑟 𝑊𝑀𝐿,𝑑𝑡−1−𝑗 2 /126 125 𝑗=0 (3) 𝑟𝑊𝑀𝐿∗,𝑡 = 𝜎𝑊𝑀𝐿−𝑡𝑎𝑟𝑔𝑒𝑡 𝜎̂𝑊𝑀𝐿,𝑡 𝑟𝑊𝑀𝐿,𝑡, (4)
where WML is a long-short momentum portfolio, 𝜎̂𝑊𝑀𝐿,𝑡2 the corresponding 1-month
variance forecast, 𝑟𝑊𝑀𝐿,𝑑𝑡−1−𝑗
2 the squared daily returns from the previous 6 months,
𝜎𝑊𝑀𝐿−𝑡𝑎𝑟𝑔𝑒𝑡 an arbitrary (monthly) target volatility level, 𝑟𝑊𝑀𝐿,𝑡 monthly returns from raw momentum and 𝑟𝑊𝑀𝐿∗,𝑡 monthly returns from risk-managed momentum.
Time-varying weights different from one are applied to long and short portfolios to scale returns to the target volatility level while leaving momentum a self-financing strategy.
2.5 Interaction between Value and Momentum
There is substantial evidence of negative correlation between momentum and value returns across countries and asset classes in the literature (Cakici & Tan 2013; Asness et al. 2013). Building upon Brunnermeier & Pedersen (2009), they explain this rela-tionship through global components of liquidity and macroeconomic risk factors on which value and momentum have opposite factor loadings. Since evidence about global liquidity / funding risk is controversial (Asness 2013), a simple explanation will be presented here.
Momentum stocks are popular trades, as buying past winners seems to be a prudent choice and investors might be prone to extrapolating earnings potentials. In compari-son, value stocks reflect contrarian views. Liquidating sell-offs will put higher price pressure on ‘crowded’ momentum stocks, as investors try to liquidate at the same time, while contrarian investments are less affected (Pedersen 2009). Finally, for rational as-set-pricing models, the value and momentum combination premium presents another puzzle unsolved.
3 Data and methodology
3.1 Research design
The first part of the research is aimed at identifying whether the factors presented in section 2 are able to explain the cross-section of returns over time. Therefore, Fama-MacBeth regressions (Fama & Fama-MacBeth 1973) are run for the cross-section of returns on the individual firm characteristics at each period. Specifically, the cross-sectional regressions for 𝑖 = 1,2, . . , 𝑛 firms per time period 𝑡 to be estimated are the following:
𝑟𝑖,𝑡+1 = 𝛽0+ 𝛽1,𝑡𝐹1,𝑖,𝑡+ 𝛽2,𝑡𝐹2,𝑖,𝑡 + ⋯ + 𝜖𝑡
⋮
𝑟𝑛,𝑇 = 𝛽0+ 𝛽1,𝑇−1𝐹1,𝑁,𝑇−1+ 𝛽2,𝑇−1𝐹2,𝑁,𝑇−1+ ⋯ + 𝜖𝑇, (5)
where 𝐹1are the corresponding market betas, 𝐹2 the natural logarithms of market
refers to Momentum. Regressing the lead-lagged returns 𝑟𝑖,𝑡+1 on the firm
characteris-tics, significant beta coefficients – i.e. their averages over time – would point towards the ability of the corresponding factor to predict cross-sectional returns, and empirically motivate a portfolio strategy based on these factors. A simple t-test of the time series of 𝛽0… 𝛽5 is performed to test the significance of each factor’s predictability, where
the null hypothesis and the test-statistic are the following, respectively (Fama & Mac-Beth 1973):
𝐻0: 𝛽𝑖 = 0, and (6)
𝑡 − 𝑠𝑡𝑎𝑡𝑖𝑠𝑡𝑖𝑐 = 𝛽̅𝑖
(𝜎̂𝛽𝑖⁄√𝑇) . (7)
As Fama & Babiak (1968) note, interpreting the t-statistics under the normality as-sumption likely leads to overestimation of the significance levels, since distributions of stock returns are widely reported as leptokurtic (Fama 1965; Blume 1970; Taylor 2007). In order to obtain valid hypothesis tests of the Ordinary Least Squares (OLS) estima-tors, Newey-West Heteroscedasticity and Autocorrelation (HAC) robust standard er-rors are used when computing regression equation (5). Heteroscedasticity occurs in cross-sectional data if the variance of the error term is not constant (𝑉𝑎𝑟(𝜀𝑖) ≠ 𝜎2, for
all 𝑖 = 1,2, . . , 𝑛) across the observations of the explanatory variables (here: firm char-acteristics) and is a violation of the Classical Linear Regression Model (CLRM; Wooldridge 2009). Contrary, for the computation of the t-statistics (7) to assess whether the average coefficients over time are different from zero or not (two-sided t-test), no robust standard errors are needed, since the Central Limit Theorem (CLT) applies (Wooldridge 2009).
The second part of the study is related to the construction and evaluation of a portfolio strategy that invests into a combination of value and momentum factors, taking into account fundamental information and risk management adjustments. It will be tested whether excess returns (above the risk-free rate) are significant across quintile and Long/Short portfolios, and most importantly, whether the ultimate portfolio is able to deliver abnormal returns (alpha) in relation to the Carhart (1997) extension of the Fama & French (1993) three-factor model (FF3FM). This four-factor model (C4FM) is cho-sen, since the inclusion of Momentum (MOM) increases the explanatory power of the
FF3FM by adding the - so far not explained - momentum effect to the commonly ac-cepted FF3FM as an asset pricing model. Hence, the time-series regression to estimate risk-adjusted returns from the portfolio strategy is as follows:
𝑅𝑡 = 𝛼 + 𝛽1𝑅𝑀𝑅𝐹𝑡+ 𝛽2𝑆𝑀𝐵𝑡+ 𝛽3𝐻𝑀𝐿𝑡+ 𝛽4𝑀𝑂𝑀𝑡+ 𝜖𝑡, (8)
where 𝑅𝑡 denote portfolio returns in excess of the risk-free rate, 𝑅𝑀𝑅𝐹𝑡 the market
return in excess of the risk-free rate, 𝑆𝑀𝐵𝑡 the size factor, 𝐻𝑀𝐿𝑡 the value factor and
𝑀𝑂𝑀𝑡 the momentum factor, respectively.3 If, and only if the portfolio returns 𝑅𝑡
can-not simply be replicated by a linear combination of the value and momentum factors, equation (8) will report a significant risk-adjusted return (𝛼). Filtering high B/M stocks according to their F-Scores and adjusting momentun for volatility targets, I expect the portfolio returns 𝑅𝑡 to be distinct from a simple linear combination of value and
mo-mentum portfolios. Again, Newey-West HAC standard errors are used to obtain valid inferences from OLS estimators, yet the underlying reason is that autocorrelation of residuals is likely to be present in the time-series regression (8) (Wooldridge 2009).
3.2 Sample selection & Methodology
For the years 1963-2015, common and preferred stock price and financial statement data is collected from CRSP and COMPUSTAT. The original sample is split up in two different ways to study value and F-Score effects on the one hand, and momentum ef-fects on the other hand. Size breakpoints from Kenneth & French database are applied on both samples, cutting off the lowest size (Market Value of Equity) quintile of stocks. In order to guarantee liquidity, only stocks with prices higher than USD5 are retained in the samples. Also, observations of zero returns are excluded from the samples. Fi-nally, all firm characteristics (except for F-Score) and returns are winsorized.
Cross-sectional Regressions of Returns on F-Score and Value
Since audited financial statements are only provided once a year, monthly returns are accumulated for the 1, 3, 6, 9 and 12 months after publication of annual reports, which
3 These factors are considered systematic risk factors rather than firm specific characteristics. The
re-turns from their long/short portfolios are provided by the Kenneth R. French database (see URL in footnote 4).
is assumed to have taken place five months after fiscal year end (Piotroski 2000). There-fore, for studying the cross-sectional predictability of returns according to B/M and F-Score measures (section 4.1), cumulative (cum.) returns are only calculated following a month when financial statements were issued. Other observations are dropped. This methodology avoids regressing cum. returns on F-Scores at times when no new (au-dited) accounting data arrived. After applying the filters, 31,174 observations of 3,700 stocks for annual returns remain in the sample.
Cross-sectional Regressions of Returns on Beta, Size, Value and Momentum
1-month, 3-month, 6-month, 9-month and 12-month (cum.) returns are regressed on momentum (and the remaining firm characteristics for reasons of completeness) across firms to study the predictability of returns throughout the sample. The different cumu-lative periods allow for an analysis of the persistence or decay pattern of the momentum (and value) effect throughout the sample. All monthly observations are kept in the da-taset, which is formed by 570,846 monthly returns of 4,628 stocks.
The portfolio construction in section 5 is based on the latter sample. Market returns are value-weighted returns from the CRSP database, while risk factor returns (RMRF, HML, SMB and MOM in equation 8) come from the Kenneth R. French data library4.
3.3 Calculation of returns and firm characteristics
Returns are holding period returns, thus include dividend payments and adjustment factors accounting for equity issuances, stock splits, etc. Since 1963 is the first year of returns observations and 60-month rolling windows are used to calculate market betas5,
1968 is the first year with returns to be studied.
Momentum is defined as the cumulative return from months 𝑡 − 12 to 𝑡 − 2 in order to avoid 1-month return reversals, a common procedure in the literature (Asness et al. 2013). Book value of equity (B) is calculated at fiscal year end plus 5 months to avoid look-ahead bias. It is defined as the book value of stockholders’ equity, plus deferred
4 URL: http://mba.tuck.dartmouth.edu/pages/faculty/ken.french/data_library.html [accessed at
30/06/2016].
5 Specifically, a time series regression with 60-months rolling window is estimated for each stock return
taxes and investment credit, minus the book value of preferred stock6. Market value of
equity is calculated as shares outstanding times share price. The natural logarithm of B/M is used. Likewise, size refers to the natural logarithm of the market value of equity.
Building upon the potential explanations for the value premium, a composite F-Score (Piotroski 2000) between a total of 0 and 9 according to binary indicators (=1, if good score, and 0 otherwise) of nine financial measures is identified:
𝐹𝑆𝐶𝑂𝑅𝐸 = 𝐹𝑅𝑂𝐴+ 𝐹∆𝑅𝑂𝐴+ 𝐹𝐶𝐹𝑂+ 𝐹𝐴𝐶𝐶𝑅𝑈𝐴𝐿 + 𝐹∆𝑀𝐴𝑅𝐺𝐼𝑁+ 𝐹∆𝑇𝑈𝑅𝑁+ 𝐹∆𝐿𝐸𝑉𝐸𝑅 + 𝐹∆𝐿𝐼𝑄𝑈𝐼𝐷+ 𝐹EQ_OFFER, (9) where 𝐹𝑅𝑂𝐴 = 1, if return on assets is positive; 𝐹∆𝑅𝑂𝐴 = 1, if return on assets increased
from previous year; 𝐹𝐶𝐹𝑂 = 1, if cashflow from operations scaled by total assets is
pos-itive; 𝐹𝐴𝐶𝐶𝑅𝑈𝐴𝐿 = 1, if cashflow from operations exceeds net income before
extraordi-nary items; 𝐹∆𝑀𝐴𝑅𝐺𝐼𝑁 = 1, if gross profit divided by total sales increased from previous
year; 𝐹∆𝑇𝑈𝑅𝑁 = 1, if sales turnover (sales scaled by total assets) increased from previous
year; 𝐹∆𝐿𝐸𝑉𝐸𝑅 = 1, if total debt scaled by total assets decreased from previous year;
and 𝐹𝐸𝑄_𝑂𝐹𝐹𝐸𝑅 = 1, if no additional shares were issued in a year.
3.4 Descriptive Statistics of the Sample
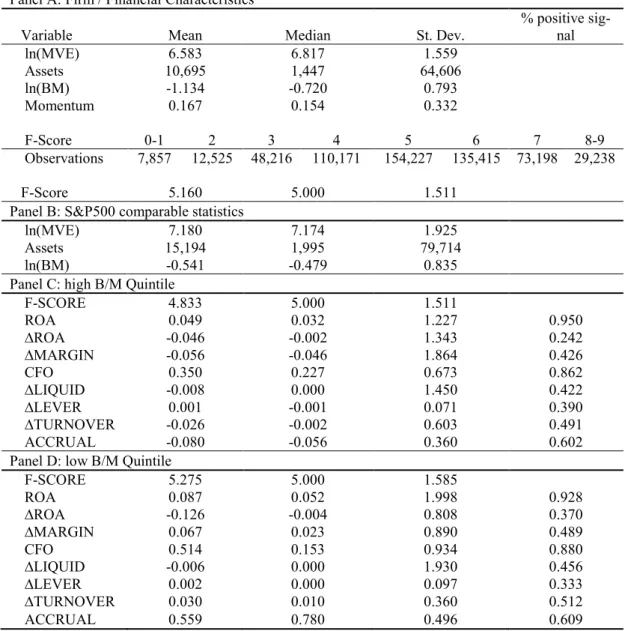
Table 1 presents descriptive sample statistics of the firm characteristics (Panel A) and compares them to the S&P500 benchmarks (Panel B) where appropriate. As shown in Panel A, the average F-Score is 5.160 with a standard deviation of 1.511. Thus, firms designated “fundamentally strong” should exhibit at least a F-Score of 8 (Piotroski 2000). The sample average natural logarithm of B/M ( -1.134) is significantly lower than the S&P500 average over the same period (Panel B), suggesting that the sample is relatively tilted towards value stocks. Likewise, Total Assets and Market Value of Eq-uity are lower for the sample than for the S&P500, since only the lowest size quintile from the CRSP & Compustat database is excluded. Panel C and Panel D show that – on average – fundamentals seem to be stronger for low B/M stocks, such that F-Scores,
6 See a more detailed definition with partial steps how to calculate the componentes when facing limited
data availability: http://mba.tuck.dartmouth.edu/pages/faculty/ken.french/Data_Library/varia-ble_definitions.html [accessed 30/06/2016].
Return on Assets (ROA) and Operating Cash Flow are higher in the low B/M quintile. This is consistent with evidence from Fama & French (1995), who report that high B/M portfolios contain relatively more poor performing stocks.
Table 1: Descriptive Sample Statistcs
Panel A: Firm / Financial Characteristics
Variable Mean Median St. Dev. % positive sig-nal
ln(MVE) 6.583 6.817 1.559 Assets 10,695 1,447 64,606 ln(BM) -1.134 -0.720 0.793 Momentum 0.167 0.154 0.332 F-Score 0-1 2 3 4 5 6 7 8-9 Observations 7,857 12,525 48,216 110,171 154,227 135,415 73,198 29,238 F-Score 5.160 5.000 1.511
Panel B: S&P500 comparable statistics
ln(MVE) 7.180 7.174 1.925
Assets 15,194 1,995 79,714
ln(BM) -0.541 -0.479 0.835
Panel C: high B/M Quintile
F-SCORE 4.833 5.000 1.511 ROA 0.049 0.032 1.227 0.950 ∆ROA -0.046 -0.002 1.343 0.242 ∆MARGIN -0.056 -0.046 1.864 0.426 CFO 0.350 0.227 0.673 0.862 ∆LIQUID -0.008 0.000 1.450 0.422 ∆LEVER 0.001 -0.001 0.071 0.390 ∆TURNOVER -0.026 -0.002 0.603 0.491 ACCRUAL -0.080 -0.056 0.360 0.602
Panel D: low B/M Quintile
F-SCORE 5.275 5.000 1.585 ROA 0.087 0.052 1.998 0.928 ∆ROA -0.126 -0.004 0.808 0.370 ∆MARGIN 0.067 0.023 0.890 0.489 CFO 0.514 0.153 0.934 0.880 ∆LIQUID -0.006 0.000 1.930 0.456 ∆LEVER 0.002 0.000 0.097 0.333 ∆TURNOVER 0.030 0.010 0.360 0.512 ACCRUAL 0.559 0.780 0.496 0.609
Table 1 presents descriptive statistics of the sample of common and preferred stock from CRSP & Compustat Databases. Panel A reports mean, median and standard deviations for market capitalizations (ln(MVE)), total assets (Assets in thousand USD), Book-to-market (ln(B/M) and Momentum (t-12 to t-2). Also, it reports the frequencies of observations per month and F-Score rank. Panel B reports the same measures (less Momentum) for the S&P500 for the same period as the sample. Panel C and Panel D compare F-Scores and the underlying financial measures between high and low B/M quintiles of the sample.
4 Cross-sectional regressions of returns on stock characteristics
4.1 Cross-sectional Regressions: F-Score and B/M
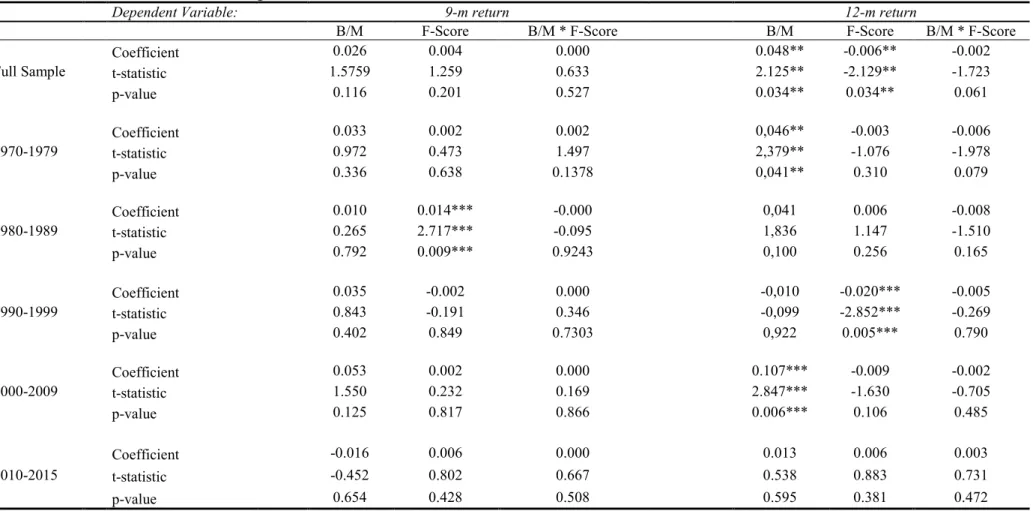
Table 2 reports averages of the OLS estimates, test-statistics from two-sided t-tests and the corresponding p-values from the cross-sectional regressions of 1-month, 3-month, 6-3-month, 9-month and 12-month (cum.) returns on the B/M, F-Score and their interaction term at each time period (financial reporting month) from January 1970 to December 2015. The interaction term is a simple multiplication of B/M and F-Scores. If the B/M (value) effect is stronger for financially healhy (high F-Score) than unhealthy (low F-Score) firms, the interaction term should have a positive (and significant) sign. This would be evidence in favour of the hypothesis that high B/M sorts include un-healthy firms and if excluding them, returns from high B/M portfolios can be signifi-cantly increased.
Puzzingly – and contrary to the results in section 4.2 – B/M is only significant for 3-months and 12-3-months cum. returns following financial statement publications. This finding is inconsistent with the abundant evidence of the B/M effect in the literature (Fama & French 1993; Fama & French 2012; Asness et al. 2013). Likewise, the F-Score is insignificant for all but the 12 months cum. return periods following financial state-ment publications. Its negative coefficient contradicts with the results presented by Pi-otroski (2000), who reports that F-Scores significantly improve the returns from high B/M portfolios for 1-year and 2-year returns following the signals.7 The insignificant
interaction term suggests that the F-Score does not help separating winners from losers among high B/M stocks.
A potential explanation for the results in Table 2 is related to limited data availability. After dropping return observations when no financial statements were issued, the sam-ple size is significantly reduced for each cross-sectional regression. The significantly lower t-statistics for B/M in this section compared to the t-statistics reported in section 4.2 undermine the methodology applied here.
Table 2: Cross-sectional regressions of returns on B/M and F-Score
Dependent Variable: 1-m return 3-m return 6-m return
B/M F-Score B/M * F-Score B/M F-Score B/M * F-Score B/M F-Score B/M * F-Score
Full Sample Coefficient -0.004 0,003 0,001 0.010** 0.001 -0.001 0.022 0.001 0,001 t-statistic -0.334 0,828 0.988 2.1254** 0.723 -0.969 1.643 0.357 0,547 p-value 0.739 0,409 0.324 0.034** 0.470 0.333 0.101 0.721 0,585 1970-1979 Coefficient -0.007 0,009 0.002 -0.006 0.003 0.003 0.047 0.003 -0,003 t-statistic -0.926 0,662 1.497 -0.439 1.377 1.025 1.572 0.826 -1,536 p-value 0.357 0,525 0.1378 0.662 0.172 0.309 0.122 0.412 0,159 1980-1989 Coefficient 0.002 0,020 -0.000 0.006 -0.003 -0.001 0.011 0,006* 0,008** t-statistic 0.341 2,237 -0.095 0.841 -1.251 -0.358 0.387 1.761* 2,327** p-value 0.734 0,052 0.9243 0.402 0.214 0.721 0.699 0.082* 0,045** 1990-1999 Coefficient -0.002 0,008 0.000 0.012 0.001 0.002 0.001 0.003 0,000 t-statistic -0.414 0,536 0.346 1.346 0.328 0.714 0.026 0.519 -0,013 p-value 0.680 0,597 0.7303 0.181 0.743 0.477 0.978 0.605 0,990 2000-2009 Coefficient 0.004 0,000 0.000 0.031*** 0.004 -0.002 0.062** -0,002 0,002 t-statistic 0.492 0,060 0.169 3.005*** 1.524 -1.182 2.335** -0.455 0,797 p-value 0.623 0,952 0.866 0.003*** 0.131 0.24 0.022** 0.650 0,429 2010-2015 Coefficient -0.005 -0,004 0.000 -0.014 0.001 0.003 -0,027 0.001 0,004 t-statistic -0.602 -0,684 0.667 -0.624 0.246 0.647 -0.938 0.118 1,469 p-value 0.550 0,523 0.508 0.536 0.807 0.521 0.354 0.907 0,155
Table 2 Continued: Cross-sectional regressions of returns on B/M and F-Score
Dependent Variable: 9-m return 12-m return
B/M F-Score B/M * F-Score B/M F-Score B/M * F-Score
Full Sample Coefficient
0.026 0.004 0.000 0.048** -0.006** -0.002 t-statistic 1.5759 1.259 0.633 2.125** -2.129** -1.723 p-value 0.116 0.201 0.527 0.034** 0.034** 0.061 1970-1979 Coefficient 0.033 0.002 0.002 0,046** -0.003 -0.006 t-statistic 0.972 0.473 1.497 2,379** -1.076 -1.978 p-value 0.336 0.638 0.1378 0,041** 0.310 0.079 1980-1989 Coefficient 0.010 0.014*** -0.000 0,041 0.006 -0.008 t-statistic 0.265 2.717*** -0.095 1,836 1.147 -1.510 p-value 0.792 0.009*** 0.9243 0,100 0.256 0.165 1990-1999 Coefficient 0.035 -0.002 0.000 -0,010 -0.020*** -0.005 t-statistic 0.843 -0.191 0.346 -0,099 -2.852*** -0.269 p-value 0.402 0.849 0.7303 0,922 0.005*** 0.790 2000-2009 Coefficient t-statistic 0.053 1.550 0.002 0.232 0.000 0.169 0.107*** 2.847*** -1.630 -0.009 -0.002 -0.705 p-value 0.125 0.817 0.866 0.006*** 0.106 0.485 2010-2015 Coefficient -0.016 0.006 0.000 0.013 0.006 0.003 t-statistic -0.452 0.802 0.667 0.538 0.883 0.731 p-value 0.654 0.428 0.508 0.595 0.381 0.472
The table presents OLS estimates, t-statistics and p-values across the full sample and sub-periods for the cross-sectional regressions of 1-month, 3-month, 6-month, 9-month and 12-month returns on the corresponding B/M (natural logarithm of book-to-market ratio), F-Scores (Piotriski 2000) and an interaction term between B/M and F-Score. Coefficients are the averages over time of the full sample and sub-period OLS estimates, respectively. T-statistics come from two-tailed t-tests with the null hypothesis that the coefficients are equal to zero. *, ** and *** designate significance of the coefficients at the 10%, 5% and 1% level.
4.2 Cross-Sectional Regressions: Beta, Size, B/M and Momentum
Table 3 shows that across the full sample and sub-periods, momentum seems to be strongest at predicting 3-months (t-statistic= 6.500) to 9-months (t-statistic= 5.664) cum. returns following the signal. The general finding - namely that momentum’s re-turn predictability has been highly significant from 1970-2015 for US stocks - is in line with Asness et al (2013), Jegadeesh (2011) and Fama & French (2012). Specifically, the fact that return predictability from momentum is highest for 3-to-9-months returns coincides with Jegadeesh (2011), who suggests that momentum profits arise because of delayed reaction to firm specific information. Apart, the only sub-period where mo-mentum predicts negative returns (for 3-to-6-months cum. returns) is 2000-2009, a pe-riod that includes one of the two most severe momentum crashes, i.e. the strong market rebound in 2009 (Barroso & Santa-Clara 2015).
Likewise, evidence from return predictability through B/M signals confirms the find-ings in the literature (Fama & French 2012; Asness et al. 2013). It tends to increase in significance for longer return periods (e.g. 9-months with a t-statistic of 5.431) follow-ing the signal. Although return predictability is significant across time, for the period 2010-2015 the sign of the coefficients changed. This finding is difficult to reconcile with evidence in the literature, since I am not aware of a paper that analyses value premia across the sub-periods specified here.
Remarkably, size is a highly significant predictor of returns across sub-sample peri-ods. The sign (negative) of the coefficient is in line with previous research on the size effect (Fama & French 2012). However, the statistical significance and economic mag-nitude of the coefficients present a puzzle, as the literature suggests that the size effect disappeared since the 1980s (van Dijk 2011). Finally,
Appendix 1 compares 10-year rolling beta estimates from cross-sectional regressions of 1-month returns on Market Beta, Size, Value and Momentum.
Table 3: Cross-sectional regressions of returns on Beta, Size, B/M and Momentum
Dependent Variable: 1-m return 3-m return 6-m return
Beta Size B/M Mom Beta Size B/M Mom Beta Size B/M Mom
Full Sample Coefficient 0.000 -0.001*** 0.001*** 0.008**** 0.000 -0.003*** 0,003*** 0.018*** 0.003 -0.007*** 0.006*** 0.029*** t-statistic -0.295 -3.482*** 3.701*** 5.102*** 0.188 -6.315*** 4.306*** 6.500*** 0.757 -8.867*** 5.227*** 6.643*** p-value 0.768 0.000*** 0.000*** 0.000*** 0.851 0,000*** 0.000*** 0.000*** 0.449 0.000*** 0.000*** 0.000*** 1970-1979 Coefficient -0.002 0.002** 0.002** 0.011*** -0.003 0.004*** 0.005*** 0.023*** -0.001 -0.009*** 0.009*** 0.038*** t-statistic -0.715 1.906** 2.534** 3.173*** -0.656 -2.885*** 2.837*** 3.172*** -0.125 -4.310*** 3.557*** 3.594*** p-value 0.476 0.059** 0.013** 0.002*** 0.513 0.000*** 0.005*** 0.000*** 0.901 0.000*** 0.001*** 0.000*** 1980-1989 Coefficient -0.003 -0.001 0.002** 0.010*** -0.009* -0.004*** 0.004*** 0.025*** --0.019** 0.010*** 0.006*** 0.047*** t-statistic -1.204 -1.394 2.136** 2.655*** -1.758* -3.515*** 2.668*** 3.816*** -2.528** -4.940*** 2.742*** 4.560*** p-value 0.231 0.166 0.035** 0.009*** 0.081* 0.001*** 0.009*** 0.000*** 0.013** 0.000*** 0.007*** 0.000*** 1990-1999 Coefficient 0.005* -0.000 0.002* 0.013*** 0.020*** -0.002 -0.004* 0.037*** 0.043*** -0.001 0.008** 0.061*** t-statistic 1.709* -0.294 1.826* 4.541*** 3.012*** -1.411 -1.666* 6.139*** 4.375*** -0.691 2.505** 6.019*** p-value 0.090* 0.770 0.070* 0.000** 0.003*** 0.161 0.098* 0.000*** 0.000*** 0.491 0.014** 0.000*** 2000-2009 Coefficient 0.000 -0.002** 0.002 -0.003 0.000 -0.005*** 0.005*** -0.012** 0.002 -0.010*** 0.009*** -0.029*** t-statistic 0.059 -2.464** 1.651 -0.843 0.027 -4.972*** 2.706*** -2.129** 0,.319 -7.899*** 3.664*** -3.490*** p-value 0.953 0.015** 0.101 0.401 0.979 0.000*** 0.008*** 0.035** 0.751 0,000*** 0.000*** 0.001*** 2010-2015 Coefficient -0.001 -0.001 -0.001 0.005 -0.003 -0.002*** -0.002 0.014*** -0.007 -0.003** -0.003 0.027*** t-statistic -0.404 -1.062 -0.746 1.598 -0.713 -2.988*** -1.176 2.891*** -1.032 -2.515** -1.604 4.889*** p-value 0.687 0.292 0.458 0.115 0.478 0.004*** 0.244 0.005*** 0.306 0.014** 0.114 0.000***
Table 3 Continued: Cross-sectional regressions of returns on Beta, Size, B/M and Momentum
Dependent Variable: 9-m return 12-m return
Beta Size B/M Mom Beta Size B/M Mom
Full Sam-ple Coefficient 0.006 -0.010*** 0.008*** 0.029*** 0.011* -0.017*** 0.010*** 0.022*** t-statistic 1.299 -9.925*** 5.431*** 5.664*** 1.822* -12.844*** 5.036*** 3.605*** p-value 0.195 0,000*** 0.000*** 0.000*** 0.069* 0.000*** 0,089*** 0.000*** 1970-1979 Coefficient 0.001 -0.015*** 0.012*** 0.041*** 0.001 -0.023*** 0.012** 0.037** t-statistic 0.092 -5.835*** 3.025*** 3.573** 0.128 -7.468*** 2.291** 2.471** p-value 0.927 0.000*** 0.003*** 0.001*** 0.898 0.000*** 0.024** 0.015** 1980-1989 Coefficient -0,036*** -0.015*** 0.007** 0.055*** -0.055*** -0.021*** 0.009** 0.048*** t-statistic -4.011*** -5.565*** 2.479** 4.477*** -5.333*** -5.937*** 2.376** 3.625*** p-value 0.000*** 0.000*** 0.015** 0.000*** 0.000*** 0.000*** 0.019** 0.000** 1990-1999 Coefficient 0.078*** -0.003 0.010** 0.063*** 0.121*** -0.015*** 0.012** 0.049*** t-statistic 5.398*** -1.139 2.554** 5.490*** 6.092*** -4.505*** 2,376** 3.600*** p-value 0.000*** 0.257 0,012** 0.000*** 0.000*** 0.000*** 0.019** 0.000*** 2000-2009 Coefficient 0.004 -0.015*** 0.013*** -0.043*** 0.007 -0.022*** 0.017*** -0.050*** t-statistic 0.473 -9.023*** 4.714*** -4.198*** 0.745 -10.245*** 5.573*** -3.998*** p-value 0.637 0.000*** 0.000** 0.000*** 0,.458 0.000*** 0.000*** 0.000*** 2010-2015 Coefficient -0.010 -0.005*** -0.006** 0.031*** -0.012 -0.008*** -0.008** 0.029*** t-statistic -1.179 -2.907*** -2.095** 4.688*** -1.230 -4.877*** -2.429** 3.227*** p-value 0.241 0.005*** 0.040** 0.000*** 0.223 0.000*** 0.018** 0.002***
The table presents OLS estimates, t-statistics and p-values across the full sample and sub-periods for the cross-sectional regressions of 1-month, 3-month, 6-month, 9-month and 12-month returns on the corresponding market betas, size (natural logarithm of market capitalization), B/M (natural logarithm of book-to-market ratio) and momentum (previous t-12 to t-1 cum. monthly returns). Coefficients are the averages over time of the full sample and sub-period OLS estimates, respectively. T-statistics come from two-tailed t-tests with the null hypothesis that the coefficients are equal to zero. *, ** and *** designate significance of the coefficients at the 10%, 5% and 1% level.
5 Portfolio Construction
5.1 Portfolio Sorts conditional on B/M, F-Score and Momentum
Table 4 presents equally-weighted market-adjusted average monthly returns from B/M, Score and Intersection sorts. In the following, the portfolio that is long high F-Score stocks within the high B/M quintile and short low F-F-Score stocks within the low B/M quintile is referred to as HML_F-Score. This is a necessary deviation from Piotro-ski (2000) – who goes long high F-Score and high B/M stocks and shorts low F-Score and high B/M stocks – in order to conserve the HML exposure and benefit from the negative correlation between HML and Momentum (Asness et al. 2013)
Results from Panel A are in line with the literature (Fama & French 2012, Asness et al. 2013), i.e. the high B/M portfolio outperforms the low B/M portfolio. For the pure F-Score portfolios (Panel B), no significant return differences arise. Panel C shows that average monthly market adjusted returns from the high B/M quintile (0.44%) are not significantly improved by selecting only stocks with F-Scores of 8 or higher (0.52%). Comparing the HML_F-Score portfolio with the HML portfolio, the standard deviation of the former (Panel C) is almost double the standard deviation of the latter (Panel A), while average monthly returns are not significantly higher. Although these results are not directly comparable to Piotroski (200), who studies annual returns, Panel D shows that identifying high F-Score firms within the high B/M quintile only yields higher re-turns for the 1976-1996 sample period of Piotroski (2000). This could be a possible explanation for the conflicting results, namely the insignificant cofficients of the F-Score and its interaction term with B/M in the cross-sectional regressions (section 4.1) and the lack of value added through F-Score screening within the high B/M quintile for the full sample period.
Table 4: Monthly Market-Adj. Returns to B/M, F-Score and Intersection Portfolios
Panel A: Pure B/M Sorted Portfolios
B/M Quintile 1st 2nd 3rd 4th 5th 5th - 1st mean 0.19% 0.11% 0.23% 0.32% 0.44% 0.25% st. dev. .71% .72% 0.69% 0.66% 0.65% 0.36% n 50 50 50 50 50 100 t-statistic (𝐻0: 𝜇 > 0) 0.63 0.36 0.79 1.14 1.56* 1.61*
Panel B: Pure F-Score Sorted Portfolios
Table 4 presents average equally-weighted market-adjusted monthly returns from B/M portfolios (Panel A), F-Score portfolios (Panel B), intersection portfolios (Panel C) and 1976-1996 high B/M and high (all) F-Score portfolios (Panel D), their medians and standard deviations. Also, the average portfolio size (number of stocks) is reported (n); whereas a maximum size of 50 is imposed on portfolios of sizes larger than 50. *,** and *** designate whether the true mean return is significantly greater than zero at 10%, 5% and 1% significance levels, respectively.
Results from Table 5 confirm the results from the cross-sectional regressions in sec-tion 4.2 and the literature on momentum (Fama & French 2012; Asness et al. 2013): high momentum portfolios outperform low momentum portfolios. Returns from the long-short (10th - 1st decile) portfolio are significantly greater than market returns (t-statistic of 4.29). Since monthly returns from the long-short momentum portfolio are negatively skewed (-0.05) and exhibit an excess kurtosis of 2.12, a risk management adjustment is introduced before combining momentum and value portfolios.
Table 5: Monthly Market Adj. Returns to Momentum Portfolios
Table 5 presents average equally-weighted market-adjusted monthly returns from Momentum decile portfolios, their medians and standard deviations across the sample period. Also, the average portfolio size (number of stocks) is reported (n). *,** and *** designate whether the true mean return is signifi-cantly greater than zero at 10%, 5% and 1% significance levels, respectively.
mean 0.31% 0.28% 0.28%
st. dev. 0.67% 0.65% 0.64%
n 133 698.97 72.589
t-statistic
(𝐻0: 𝜇 > 0) 1.09 1.01 0.92
Panel C: Intersections between F-Score and B/M Portfolios
B/M 1st Quintile 5th Quintile 5th BM & F>=8 F-Score F-Score <=3 F-Score >=8 - 1st BM & F<=3
mean 0.23% 0.52% 0.29% st. dev. 0.74% 0.70% 0.61% n 31.05 44.38 75.43 t-statistic (𝐻0: 𝜇 > 0) 0.81 1.61* 0.86 Panel D: 1976-1996: B/M 5th Quintile
all F-Scores F-Score >=8
mean 0.44% 0.73% st. dev. 0.06% 0.06% n 286.49 15.92 t-statistic (𝐻0: 𝜇 > 0) 1.61* 1.98** MOM Decile 1st 2nd 3rd 4th 5th … 8th 9th 10th 10th - 1st mean -0.39% -0.20% -0.03% 0.09% 0.11% … 0.48% 0.52% 0.74% 1.13% st. dev. 0.78% 0.66% 0.62% 0.61% 0.62% … 0.66% 0.70% 0.81% 0.57% n 50 50 50 50 50 … 50 50 50 100 t-stat -1.08 -0.668 -0.09 0.33 0.37 … 1.58* 1.60* 1.98** 4.29***
5.2 Constant Volatility Momentum Adjustment
A variance forecast as defined in section 2.4.4 is used to scale momentum portfolio returns to an annualized volatility of 12% (Barroso & Santa-Clara 2015). Therefore, daily momentum returns from the Kenneth & French Database are used to calculate the variance from daily returns of the previous six months and the scaling factor for each month. Consistent with the findings from Barroso & Santa-Clara (2015), this adjust-ment for the WML portfolio almost duplicates the Sharpe-Ratio; however, contrary to Barroso & Santa-Clara (2015) the benefits do not only come from reducing the maxi-mum drawdown, but also from increasing the maximaxi-mum return. The standard deviation reduction (from 32% to 19%) is similar to the achievements from Barroso & Santa-Clara (2015) (from 27.53% to 16.95%).
Table 6: Volatility Target Momentum vs. Raw Momentum
Portfolio Max Min Mean St. Dev. Skewness Kurtosis Exc. Sharpe Ratio
WML (Raw) 0.32 -0.81 0.135 0.32 -0.05 2.12 0.451
WML* 0.53 -0.35 0.303 0.19 0.15 1.16 0.81
Table 6 compares average equally-weighted monthly returns from raw and risk-managed Momentum decile portfolios. Mean returns, st. deviations and Sharpe Ratios are annualized figures.
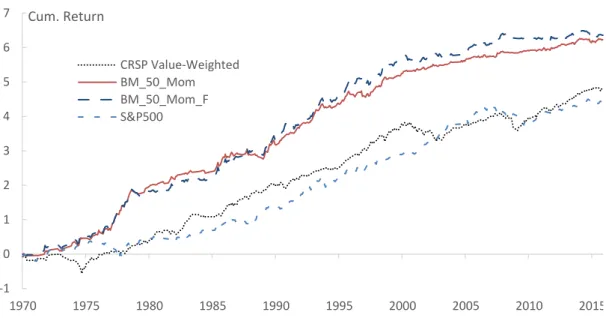
Figure 1 (Panel A) presents the exposure to the high-low momentum portfolio result-ing from the weights in the long and short legs across time. As shown in Panel B, the benefit from the scaled momentum strategy stems from the low exposure during the momentum crash when the market rebounded in early 2009. Since then – in the absence from momentum crashes – the performance of both strategies is fairly similar.
Figure 1: Momentum Weights and Cum. Returns
Panel A: Momentum Weights across Full Sample Period
0 1 2 3 4 5 1970 1975 1980 1985 1990 1995 2000 2005 2010 2015
Panel B: Cum. Returns of Raw Momentum and Volatility Target Momentum
Figure 1 (Panel A) presents the weights of the scaled momentum strategy, interpreted as the exposure (1= full exposure to momentum) to the high-low momentum portfolio across the full sample period. Panel B compares cumulative monthly returns (indexed at 0% as of Jan 2000) of Raw Momentum with Target Volatility Momentum Portfolios for the years 2000-2015, including the momentum crash in 2009.
5.3 Value & Risk Adjusted Momentum Combination
In this section, market-adjusted returns to the universal portfolio strategy, i.e. the combination of value and momentum factor portfolios is presented. An analysis of risk-adjusted returns through a time-series regression on the CF4M (equation 8) follows.
Table 7 presents (exc. Market) returns and first moments from 50-50 combinations of HML and WML* (target volatility Momentum) portfolios. Although the F-Score sort within the high B/M quintile (HML_F-Score) improves monthly returns (Table 4), the Sharpe-Ratio from the pure HML and WML* combination is higher. The first reason Table 7: Combined HML (& F-Score) and Momentum Portfolio Returns
Table 7 compares average equally-weighted monthly returns from 50-50 HML (B/M) and WML* (risk-managed Momentum) combined long-short portfolios. The first portfolio combines WML* with the pure HML (B/M) portfolio, while the second combines WML* with the high B/M and high F-Score intersec-tion minus the low B/M and low F-Score (HML_F-Score) intersecintersec-tion long-short portfolio. Mean returns, st. deviations and Sharpe Ratios are annualized figures.
is the lower standard deviation of HML in comparison to HML_F-Score, and the second reason is the higher negative correlation between HML and WML* (-0.454) than be-tween HML_F-Score and WML* (-0.201). Figure 2 graphically shows cumulative
-0.5 0 0.5 1 1.5 2 2000 2002 2004 2006 2008 2010 2012 2014 WML* WML
Portfolio Max Min Mean
Mean (Exc.
Market) Dev. Skewness St. Kurtosis Exc. Sharpe Ratio 0.5 x HML + 0.5 x
WML* 0.182 -0.149 0.162 0.041 0.142 0.261 1.704 0.841
0.5 x HML_F-Score