M
ASTER OF
S
CIENCE IN
A
CTUARIAL
S
CIENCE
M
ASTERS
F
INAL
W
ORK
I
NTERNSHIP
R
EPORT
PROFITABILITY STUDY OF THE ANNUITIES OF EY
-
INSURANCE
E
LIF
Y
UCAL
M
ASTER OF
S
CIENCE IN
A
CTUARIAL
S
CIENCE
M
ASTERS
F
INAL
W
ORK
I
NTERNSHIP
R
EPORT
PROFITABILITY STUDY OF THE ANNUITIES OF EY
-
INSURANCE
E
LIF
Y
UCAL
S
UPERVISORS:
P
ROF.
O
NOFREA
LVESS
IMÕESJ
OÃOB
ARATAiii
P
ROFITABILITY
S
TUDY OF THE
A
NNUITIES OF
EY-I
NSURANCE
E
LIFY
UCALS
UPERVISORS:
P
ROF.
O
NOFREA
LVESS
IMÕESJ
OÃOB
ARATAM
ASTER IN:
A
CTUARIALS
CIENCEA
BSTRACTThis study aims to evaluate the profitability of the life annuities in the insurance company where the internship took place by concentrating on finding the best mortality table for the company portfolio to quote the price for the new annuity businesses and reserving for the ones already sold.
The project is based on real data that was intentionally transformed for the purpose of this text because of confidentiality reasons. The distortion conceals reality in an appropriate manner and has obviously no effects on the methodologies applied.
Data concerns immediate and immediate reversible life annuities for four years, since these products comprise the most significant part of the company population of policy holders.
The best mortality table for this data is 108.95% of GKF95 table, by least square fitting. In order to forecast the future mortality, the Gompertz-Makeham mortality model was applied and there were no systematic evolution through time for the future mortality. A Sensitivity analysis was performed to show the effects of different scenarios on mathematical reserving. Finally, a profit testing revealed that the technical bases for the annuities are not enough to cover the liabilities. 108.95% of GKF 95 table can be assumed as the initial table and 104.29% of GKF 95 table can be assumed to hold extra reserve, in order to guarantee an adequate mathematical reserve.
K
EYWORDS:
Annuities, Pricing, Reserving, Mortality, Forecasting, Modelling, Gompertz-Makeham Law, Sensitivity analysis, Profit testingiv
A
NÁLISE DAR
ENTABILIDADE DASR
ENDASC
OMERCIALIZADAS PELAC
OMPANHIAEY-
INSURANCEE
LIFY
UCALO
RIENTADORES:
P
ROF.
O
NOFREA
LVESS
IMÕESD
R.
J
OÃOB
ARATAM
ESTRADO EM:
A
CTUARIALS
CIENCER
ESUMOEste trabalho procura analisar a rentabilidade obtida com a venda de anuidades e produtos anuais renováveis, na seguradora Vida onde decorreu o estágio. As questões relacionadas com os desvios observados na mortalidade e a necessidade de encontrar um modelo de sobrevivência mais ajustado à experiência da companhia foram aspetos de crucial importância. Procurou assim encontrar-se bases técnicas mais adequadas para o cálculo de prémios e reservas, tanto para os produtos já em comercialização, como para novos produtos que venham a ser lançados, pois também a taxa de juro e as despesas foram afloradas, ainda que brevemente.
Por motivos de confidencialidade de dados, procedeu-se a uma distorção dos valores reais. Isto não teve obviamente qualquer consequência do ponto de vista das metodologias e técnicas aplicadas no estudo. Estavam disponíveis dados para um
período de quatro anos, na sua maioria relativos a rendas imediatas e rendas imediatas reversíveis.
Com base nisso, foi possível detetar que a tábua de mortalidade mais adequada será 108.95% da GKF95, o que talvez permita eliminar a maior parte dos desvios. Em complemento, foi ainda feita uma análise de sensibilidade, com diferentes cenários, para se estudar o efeito sobre o nível das reservas das diferentes possibilidades consideradas. Um exercício final de profit testing revelou que as responsabilidades continuam insuficientemente cobertas, pelo que trabalho adicional é necessário para resolver o problema.
P
ALAVRAS-C
HAVE:
Anuidades, Prémios, Reservas, Mortalidade, Lei de Gompertz-Makeham, Análise de Sensibilidade, Profit Testing1 INDEX 1. INTRODUCTION ... 1 1.1. Objective ... 1 1.2. Layout ... 1 2. THEORETICAL ASPECTS ... 3 2.1. Life Annuities ... 3
2.1.1. Annual Life Annuities ... 3
2.1.1.1. Whole Life Annuities ... 4
2.1.1.2. Temporary (Term) Annuities ... 4
2.1.2. Life Annuities Payable m Times a Year ... 4
2.1.3. Deferred Annuities ... 5
2.1.4. Guaranteed Annuities ... 5
2.1.5. Increasing Annuities... 5
2.1.6. Joint Life and Last Survivor Annuities ... 5
2.1.7. Reversionary Annuities ... 6
2.2. Technical Basis and Pricing ... 7
2.2.1. Mortality Assumptions ... 7
2.2.2. Assumptions for the Rate of Interest ... 8
2.2.3. Expense Assumptions ... 8
2.3. Mathematical Reserving ... 9
2.4. Sensitivity Analysis ... 10
2.5. Profit Testing... 10
3. MARKET OVERVIEW AND EY-INSURANCE ... 11
3.1. Portuguese Annuity Market ... 11
3.2. Annuity Pricing Assumptions Used in Life Assurance in Portugal ... 13
2
3.3.1. Life Expectancy ... 16
3.4. Overview of the Company Portfolio ... 17
4. COMPANY STUDY ... 20
4.1. Mortality Study ... 20
4.1.1. Static Modelling ... 20
4.1.2. Dynamic Modelling ... 22
4.1.2.1. Gompertz-Makeham Distribution ... 22
4.1.2.2. Forecasting the Future Mortality Trend ... 23
4.2. Sensitivity Analysis ... 25
4.2.1. Successive Sensitivity Analysis... 25
4.2.1.1. Mortality Effect ... 25
4.2.1.2. Rate of Interest Effect ... 26
4.2.1.2.1. Fixed Rate of Interest ... 27
4.2.1.3. Expenses Effect ... 28
4.2.2. Simultaneous Sensitivity Analysis ... 29
4.2.2.1. The Combined Effects of Mortality and Interest ... 29
4.3. Profit Testing... 30
5. CONCLUSION ... 33
5.1. Future Studies ... 34
REFERENCES ... 35
APPENDIXES ... 39
APPENDIX A – MATHEMATICS OF THE LIFE ANNUITIES ... 40
APPENDIX B – GOMPERTZ-MAKEHAM FORECASTING METHOD ... 44
APPENDIX C – TABLES... 46
APPENDIX D – FIGURES ... 50
3
LIST OF TABLES
Table 1: Fitted percentages of some selected mortality tables to company population ... 21 Table 2: Difference between the real and expected number of deaths based on GKF95 table . 22 Table 3: Difference between the real and expected number of deaths based on PERM/F 2000
table ... 22 Table 4: Differences (%) between the current mathematical reserve and the required amount
according to the fitted percentages of selected mortality tables ... 26 Table 5: Differences (%) between the current mathematical reserve and the required amount
under various scenarios for the rate of interest ... 28 Table 6: Technical expense assumptions for immediate life annuities ... 28 Table 7: Differences (%) between the current mathematical reserve and the required amount
under different combinations of mortality and interest (ages 50-105) ... 29 Table 8: Differences (%) between the current mathematical reserve and the required amount
under the usual mortality/rate of interest scenarios (ages 50-105) ... 30 Table 9: The result of profit testing on company portfolio by assuming the technical
assumptions ... 31 Table 10: Profitability analysis under the technical assumptions of life annuities for data set . 31 Table 11: Profitability analysis under the fitted mortality tables with technical rates of interest
... 31 Table 12: Estimated coefficients for Gompertz-Makeham forecasting method ... 45 Table 13: Mathematical reserves and variations (%) for the traditional life insurance companies in Portugal ... 46 Table 14: Mathematical reserves and variations (%) for the life insurance companies in
Portugal selling their products through banks ... 47 Table 15: The technical assumptions for the life insurance companies in Portugal in terms of
4
Table 16: The technical assumptions of the group annuity products in EY-Insurance ... 49 Table 17: Differences (%) between the current mathematical reserve and the required amount
5
LIST OF FIGURES
Figure 1: Distribution of the number of the insurance companies by sale channels in Portugal12
Figure 2: Life insurance population (0-100 years) ... 15
Figure 3: Evaluation on the number of 100+ ages insured people in Portugal ... 15
Figure 4: Distribution of the number of the policyholders among annuity products ... 17
Figure 5: Total age distribution of the EY-Insurance group annuity portfolio ... 18
Figure 6: Mathematical reserve distribution of life annuity products ... 19
Figure 7: Fitted Gompertz-Makeham estimation to the weighted average of historical company data for the 65-90 ages ... 23
Figure 8: One year forecasting for company mortality distribution and estimation by Gompertz-Makeham model………24
Figure 9: Comparison of one year forecasted company population and fitted mortality table GKF95 ... 24
Figure 10: Life expectancy at birth in Portugal: Total and by sex ... 50
Figure 11: Life expectancy at 65 years old in Portugal: Total and by sex ... 50
Figure 12: The age distribution of the EY-Insurance for the deferred and deferred reversible life annuity portfolio ... 50
Figure 13: The age distribution of the EY-Insurance for the immediate and immediate reversible life annuity portfolio ... 51
Figure 14: The distribution of the 3 basic assumptions of whole portfolio in terms of their weight on the total mathematical reserve ... 51
Figure 15: The fitted percentages to the weighted average experienced annuitant data of EY-Insurance for the age period of 50-105 ... 51
Figure 16: The fitted percentages to the weighted average experienced annuitant data of EY-Insurance for the age period of 65-90 ... 52
6
Figure 17: Fitted Makeham estimation to the weighted average experienced annuitant data for the 50-105 ages ... 52
7
ACKNOWLEDGEMENT
First, I would like to thank to my supervisors, Prof. Onofre Alves Simões and João Barata,for their attention and help throughout the project. I would like to thank to Emmanuel Lesueur, Elisa Gaião and Prof. João Andrade e Silva for helping me out whenever I needed, and to my colleague Isabel Farinhafor her advices and encouragement.
Finally, I would also like to thank to my entire family, especially to Alp Ozgunes, and my good friends for their patience, support and encouragement while working on this final work.
1
1. INTRODUCTION
Life insurance companies selling annuities collect and invest annuities premiums. Then they use the proceeds of investment to pay the annuitants until the end of the contract (whole life or term). Naturally, if the annuitant is not alive to get the insurance benefit, the company holds the remaining amount. On the other hand, if the annuitant lives more than expected, the company has to pay the benefit as long as the annuitant survives.
A major purpose for actuaries is to estimate for how long annuitants will be receiving the benefits, so that the firm can better determine their duration and the rate of interest and expenses to be applied for different kinds of policies. (Williams, 1986).
1.1. Objective
The project basically aims to determine the best actuarial mortality table assumption for the annuitants, in order to have a good fit for the existing population. We will further try to determine the effects of different scenarios from the current technical basis and study the profitability of the life annuity products under consideration.
1.2. Layout The layout of this report is as follows.
The second chapter starts with the theoretical definitions of life annuities business and continues with the technical basis for the pricing of life annuities. After this mathematical reserving, sensitivity analysis and profit testing will be defined.
The third chapter contains the analysis of the Portuguese life insurance market, the Portuguese population and an overview of the EY-Insurance portfolio, in terms of age distribution and the mathematical reserve distribution. The project is based on real
2
confidentiality reasons. The distortion conceals reality in an appropriate manner and has obviously no effects on the methodologies applied.
The main chapter is Chapter 4 and it consists of a study of the mortality to be used for the calculations of premiums and provisions related to the annuities. The mortality study includes deterministic and stochastic table studies to define the best approach for the company population. Under a sensitivity analysis, the effects of the appropriate mortality tables and of the chosen rates of interest on current reserve will be discussed. Finally, the expenses of the annuities will be considered but there will be no suggestions about this topic since they are fixed by the administration and are not covered by the project. Chapter 4 closes with a profit testing to study the profitability of life annuities.
Chapter 5 contains a summary of the key achievements of the work developed and some final thoughts, alongside with a few suggestions for possible further works.
3
2. THEORETICAL ASPECTS 2.1. Life Annuities
An annuity is a contract where an annuitant pays a premium to a life assurance company, who then converts the stock of wealth into a steady income stream to the annuitant while a given life survives. (Cannon, 2006).
Annuities have different characteristics and valuations are important to calculate the premiums, policy values, and mathematical reserves.
In the following chapters, only the theoretical definitions of life annuities will be explained. The mathematical formulations can be found in Appendix A.
2.1.1. Annual Life Annuities
An annual life annuity has only one payment each year, if the annuitant is still alive in the date of payment.
Life annuities may be temporary (term), in which case they generate a flow of payments for a limited time period and conditional on the annuitant being alive in the date of payment. In this case, the term regular payments are made until either the annuitant dies or the end of the term, whichever comes sooner. Life annuities may also be whole-life, paying a periodic benefit as long as the annuitant lives.
Payments can occur at the end of each payment period (immediate/ordinary annuity), or alternatively they can occur in advance (annuity due). Moreover, the annuity may be deferred when the stream of payments begins at some point in the future with the condition of the annuitant being alive. So, it is theoretically possible for the company that there will be no payment.
The other possible annual life annuity products are defined below (cf. Dickson et al. 2009).
4
2.1.1.1. Whole Life Annuities
An annuity is called annual whole life annuity due if it makes payments at the beginning of each year as long as the policyholder is still alive. The annuity is a whole life immediate annual annuity if payments are made at the end of each year during the life of annuitant.
The difference between the EPV (Expected Present Value) of a whole life annuity–due and the EPV of a whole life immediate annuity is the first payment (see Appendix A, Section 1.3).
2.1.1.2. Temporary (Term) Annuities
An annuity is called an annual term annuity due if it is valid for some specified period; it means that the annuity makes payments at the beginning of each year until the end of the term or the end of year of death, which one happens earlier.
If the term annuity requires payments to be made at the end of each year among the term period, it is called as an annual immediate term annuity.
The difference between the EPV of an immediate annual term annuity and the EPV of an annual term annuity due is the first payment of the annuity due and the last payment of the immediate annuity (see Appendix A, Section 1.4).
Annual annuities are not so common as monthly paid annuities.
2.1.2. Life Annuities Payable m Times a Year
If the whole life annuity makes payments at the beginning of each 1/m of the year, it is a whole life annuity due payable m times a year. If payments are made at the end of the 1/m of the year, then it is called a whole life annuity payable m times a year in arrears. In the same way we can define term life annuities payable m times a year (see Appendix A, Sections 2.3 and 2.4).
5
Again, the EPVs of the term annuities payable m times a year in advance and in arrears can be related as already explained (see Appendix A, Section 2.2).
2.1.3. Deferred Annuities
As already defined, deferred annuities are life annuities which have the first payment at some specified future time. That period is called the deferment period. The EPV of the benefit of this kind of annuities can be calculated through the combination of the EPVs of whole life and term annuities (see Appendix A, Section 3.1).
2.1.4. Guaranteed Annuities
A guaranteed annuity promises to pay the benefit for some specified period even if the annuitant dies before the end of that period. Furthermore, a guaranteed annuity can be payable m times a year as well (see Appendix A, Section 4).
2.1.5. Increasing Annuities
Non-level annuities are annuities where the amounts of the payments may increase/decrease arithmetically, geometrically or in any other way.
In an “Arithmetically increasing annuity due” the amount of the benefit at time is where S is the first benefit payment and j is the increase rate. It can be paid for some specified term and then is called arithmetically increasing term annuity due (see Appendix A, Section 5.1).
A “Geometrically increasing annuity” considers the effect of inflation over time. It pays at time (see Appendix A, Section 5.2,
2.1.6. Joint Life and Last Survivor Annuities
An annuity is called as joint life annuity ( ), if it pays for two heads during the period that both are alive.
6
If the annuity pays until the end of the second death, it is called a last survivor annuity ( .
The EPV of the last survivor annuity benefit can be calculated by using the EPV of joint life annuity and the EPV of the annuity benefits for each head (see Appendix A, Section 6.1).
Similar to the classical life annuities, joint life annuities can be temporary joint life annuities in advance or temporary joint life annuities in arrears. Furthermore, these two kinds can be payable m times a year (see Appendix A, Section 6).
2.1.7. Reversionary Annuities
These are also annuities on two lives, (x) and (y). The life (x) is called the counter, the failing life or the first head, and the life (y) is called the annuitant or the second head. The simplest form of reversionary annuity starts paying on the death of (x), if (y) is still alive, and continues paying during the lifetime of (y).
A reversionary annuity in arrear starts paying at the end of the year of death of (x), and continues to pay annually until the end of life of (y) (see Appendix A, Section 7.1). If the reversionary annuity is determined for a specified term (during the first head’s life there is a fixed term), the annuity behaves exactly like a deferred annuity. If the death of (x) happens within the term period, the payment starts at the end of the year of death of (x) and continues during the lifetime of (y). If the death event happens after the specified term, there is no payment to (y) (see Appendix A, Section 7.2). The conditions of payment can say that payments will begin on the death of (x) and continue until some specified term or the lifetime of (y), whichever event occurs first (see Appendix A, Section 7.3).
7
Reversionary annuities may be payable m times a year and written for some specified term (see Appendix A, Section 7.4 and 7.5).
2.2. Technical Basis and Pricing
Annuities have started to be a vital aspect of the current retirement system around the world, especially in Europe. Because of this, providing an annuity is an issue of increasing importance to individuals, groups and policy-makers. (Davidoff, 2003). Life assurers are increasingly enthusiastic about selling these kind of products but in order to price them, three basic elements must be taken into consideration;
1. Mortality 2. Interest rate 3. Expenses
It is very important to use adequate best-estimate actuarial assumptions to calculate appropriate premiums for new contracts and reserves for existing ones. DWP and Inland Revenue (2002) mention that “Annuities make sure that people continue to receive an income from their savings no matter how long they live” in their consultative work.
2.2.1. Mortality Assumptions
Mortality assumptions have very significant effects on annuity pricing. While selecting these assumptions, proper attention must be given to the mortality table used. The table should fit the future mortality and reflect the characteristics of the annuitants’ expected population at the same time.
Moreover, a higher expectation of life can be expected for the voluntary annuitants than for the ones who are subject to compulsory annuity purchase (Moore, 2009).
8
2.2.2. Assumptions for the Rate of Interest
The future rate of return on the investments is another critical assumption for pricing annuities. The uncertainty about future rates of return becomes very high, since the durations of contracts can be very long in the case of life annuity business. In order to hedge the interest rate risk, diversification between interest rates in different investment periods may be taken into account but as a result of it the annuity products become too expensive. That means policyholders have to pay higher premiums and shareholders have to provide more capital.
That is why actuaries should adopt conservative assumptions for rate of interest in order to calculate the premiums. (Daykin, 2002).
2.2.3. Expense Assumptions
In addition to making assumptions about the future mortality and the rate of interest, the expense assumptions should be considered. If there are commissions for the agents or financial advisers and initial or administrative costs, they have to be taken into account while pricing annuities.
Costs consist of acquisition costs (usually denoted by alpha), settlement costs (beta), administrative costs (gamma) and annuity payment costs (delta).
Acquisition costs are paid to agents and intermediaries only one time, and are a percentage of the insured amount. Settlement costs, which are a percentage of the gross premium, are taken each time of the premium payment by assurer. Administrative costs are about the insurer’s business operations (management and similar) and are a percentage of the insured amount during the insurance period. Annuity payment costs are requested from the client each time the benefit is paid by
9
insurer to cover other kinds of costs, such as paper, IT, communication ext. (Jakovcevic, 2004).
2.3. Mathematical Reserving
Mathematical reserve is the difference between PV (present value) of all future liabilities of the insurer from annuity contracts and PV of all future liabilities of policyholders from those contracts. (Insurance Act, 2002).
The mathematical reserve methodology is not difficult to perform, but the actuary needs to make prudent assumptions for the portfolio in terms of the future mortality experience of the annuitants, the adopted rate of interest and the future administering expenses of the contracts.
The difficulties about the mortality assumptions may arise from lack of reliable annuitant data on the population because the annuitants’ population is sometimes significantly different from the general population. The experiences of the developed annuity markets show that annuitants are likely to have a higher expectation of life. So, it is very important for the insurers to be conservative about what might happen in the future when setting the appropriate reserves. (Daykin, 2002).
The interest rate assumption is mostly dependent on the investments which are held to cover the future liabilities.
Expenses should be taken into consideration in the mathematical reserve evaluation, in order to cover all expected future administration costs and thus helping the company to keep solvent.
In addition to holding mathematical reserves, it is very important to hold extra capital to protect the insurer from other unexpected situations. (Daykin, 2002).
10
2.4. Sensitivity Analysis
The sensitivity analysis is used to simulate what would be the responsibilities of the company for different scenarios on the basis of variation in the prices and reserves. These analyses give unique values for each combination of parameter assumptions but reality can be instable because of the randomness of the inputs like the return on investments or the best estimate mortality.
2.5. Profit Testing
The insurance companies have to ensure that the products they are selling are profitable. In order to determine the profit and loss of the company for certain type of insurance products, they use profit testing.
11
3. MARKET OVERVIEW AND EY-INSURANCE 3.1. Portuguese Annuity Market
In Portugal, the life insurance business is supervised by “Instituto de Seguros de Portugal - ISP”. ISP aims to ensure that the insurance sector is functioning in the way that is supposed to and that participants are well protected. Between 1984 and 1994, technical rules, such as actuarial basis in order to calculate the premiums, reserves and some other technical practices, had to be approved and regulated by this supervisory authority.
In 1986, Portugal became a Member State of the European Community, and the insurance sector had to adapt to the new framework which came with the membership. After the “Single Insurance Progress” in 1994, the insurance sector in Portugal had to be more competitive in their national market since any other company authorized in any member-state could have business anywhere in the European Union. (Barros et al. 2003).
The Portuguese Association of Insurers (“Associação Portuguesa de Seguradores” - APS) started to publish a report about the market overview in Portugal in 2007. According to their last report the number of insurance companies in Portugal has increased up to 87 from 72 during the period 2007-2010 and around 40% of them are companies centralized in other countries.
Moreover, with respect to the yearly report from Financial Department of EY-Insurance (“Gabinete de Planeamento e Controlo de Gestão” – DFA, 2013), 63% of the global insurance market in Portugal belongs to the life insurance sector but only 8.4% of the market remains in the life insurance sector after excluding the financial (saving) products, in terms of premiums. Annuities represent 0.5% of the life business again
12
except financial products. Besides, the Portuguese life insurance companies, who sell annuities, carry out the 47% of the global annuity sector.
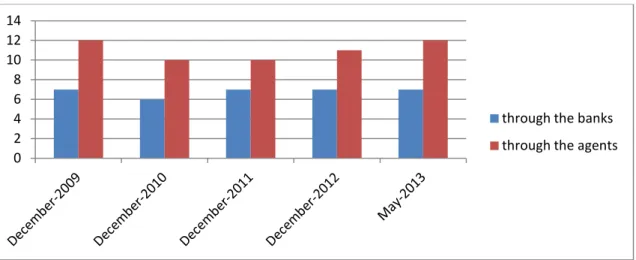
In Portugal, there are two main sale channels for life insurance companies: banks and agents. In other words, insurance companies can use the banks or agents’ network and brokers to sell their products. The agents’ network can use exclusive or multibrand agents. Annuities are normally sold by brokers or agents network.
Figure 1: Distribution of the number of the insurance companies by main sale channel in Portugal, Source: DFA
There were 19 life insurance companies in 2009, which were selling life annuities; only seven of them sold their products traditionally, the other ones sold their products through banks. Although there were some pulling out of the market or getting into the market during the years of 2009-2012, the number of the companies was still 19 in 2013.
As criteria for the insurance companies, the mathematical reserve stands for the important part of liabilities in the balance sheet. It basically represents the investment of premium savings that is necessary to meet the responsibilities for annuitants. (Kozarevic, 2010). 0 2 4 6 8 10 12 14
through the banks through the agents
13
Besides, it must be specified that having high mathematical reserve upon the market does not show the profitability of the company, it only shows the size of the portfolio that insurance companies have.
“EY-Insurance” has the biggest portfolio among the other life insurance companies, according to the size of mathematical reserves. After EY-Insurance, “J-Insurance” has the second biggest portfolio and the “G-Insurance” has the third one in the annuity market.
Moreover, “D-Insurance” has the biggest positive variation and “H-Insurance” has the biggest negative variation on their mathematical reserves among the others during the years of 2009-2013 (see Appendix C, Table 13).
The comparison between the other insurance companies which have the partnership or relationship with banks in order to sell insurance products in Portugal, can be seen in Appendix C, Table 14.
3.2. Annuity Pricing Assumptions Used in Life Assurance in Portugal After July 1994 (Single Insurance Progress), for technical purposes related to the actuarial bases, life insurance business was classified either as individual or group assurance. Term and whole life policies were classified as death risk contracts, and pure endowment contracts and annuities were classified as life risk contracts. Besides, the concept for “annuities”, which were the annuities purchased from life insurance companies including the annuities purchased from pension schemes, was changed by excluding the annuities purchased by pension schemes. This changing brought some problems regarding mortality data of annuitants. The companies, which were only allowed to use the French table PF-60/64 until 1994 in order to price the annuities, including the annuities purchased by pension schemes, could now choose the
14
mortality tables according to their own criteria. The only condition was being able to justify adequately the choice of the mortality tables used in their insurance products, according to the provisions in the new framework. But, it is still very hard to find the ideal solution for this problem because the lack of adequate data makes it almost impossible to develop mortality tables from the mortality experience of the population. (Barros et al. 2005).
Currently, the life insurance companies tend to use the mortality tables from the other countries in their premium and reserve calculations based on their assumptions. Table 15 in Appendix C shows the mortality table and interest rate assumptions of the Portuguese life insurance companies for annuities, information available in the annual reporting of each company. The most common mortality tables used in the life business in Portugal are the French mortality table TV 73-77 and the Swiss mortality table GKF-95. Portuguese life assurance companies prefer to use female mortality tables, since the life expectancy for females is higher than for males (see section 3.3.1) and it is illegal to use different mortality tables for males and females, by the Portuguese legislation.
3.3. Portuguese Population
Since 2006, ISP collects the Portuguese population data in terms of life insurance with the help of insurance companies. In the following graph, it is easy to see that the most dense age period for the life insurance business is 35-75 years. In Portugal, life insurance products consist mostly of financial (saving) products and people are willing to buy this kind of products when they start working. But annuity products are preferable when clients reach old ages and believe that they are going to live long.
15
Figure 2: Life insurance population (0-100 years) Source: ISP
Furthermore, annuity holders show greater life expectancy than whole life insurance population, as already mentioned. That is why it wouldn’t be correct to consider only the life insurance population or the whole population while pricing the annuities. In order to understand the annuity population better, the maximum age distribution would be a good indicator because the maximum life age is important to price the whole life and deferred annuities.
Figure 3: Evaluation on the number of 100+ ages insured people in Portugal Source: ISP
Figure 3 shows the number of the oldest old people (>100) in the life insurance population of Portugal and it proves that the number of the people living more than 100 years is increasing. 0 20000 40000 60000 80000 100000 0 20 40 60 80 100 120 2006 2007 2008 2009 2010 2011 2006 2007 2008 2009 2010 2011 0 500 >100
16
3.3.1. Life Expectancy
Mortality improvements (longevity) have an obvious impact on the cost of annuity benefits. To ignore those improvements could endanger the financial stability of the insurer.
Based on all demographic databases, historical trends show that average life time has increased gradually during the last century (Pordata, 2013). This has obvious benefits for the individuals but life insurance companies potentially face financial risks if people on average live longer than expected because they have to pay benefits longer than anticipated. (Bravo et al.2009).
According to the IMF (2012) report “Life expectancy at birth ( ) is most often used to discuss longevity, although the measure most relevant for longevity risk is life expectancy at 65 ( ).”
In Portugal, life expectancy at birth increased from 60.7 (66.4) years in 1960 to 76.7 (82.6) years in 2011 for the male (female) population. The whole population records 64.1 years in 1960 and 79.8 years in 2011 (see Appendix D, Figure 10).
As a consequence, the number of surviving up to older ages (75+) has significantly increased from 2.68% of the whole Portuguese population in 1960 to 9.11% in 2011. Additionally, oldest ages show a reduction on mortality and growing future gains in life expectancy.
In Portugal, life expectancy at age 65 raised from 12.2 (14.6) years in 1970 to 16.9 (20.2) years in 2010 for the male (female) population (see Appendix D, Figure 11). At the same time, it can be observed that the age of maximum mortality gradually shifted towards older ages. (Pordata, 2013).
17
In Bravo et al. 2009, “According to the United Nations, in 2050, 27% of the European population will be older than 65 years and 10% will be older than 85 years.”
The annuities market is categorized either as voluntary or compulsory market. In the voluntary market, individuals wouldn’t buy an annuity if they knew that they would have low life expectancy. That situation proves the potential reason for the higher life expectancy in the voluntary market than in the compulsory market. It is called as an adverse selection problem in the market (Cannon, 2006).
3.4. Overview of the Company Portfolio
In this section, only the group annuity portfolio will be studied, since the individual portfolio is of a very small significance.
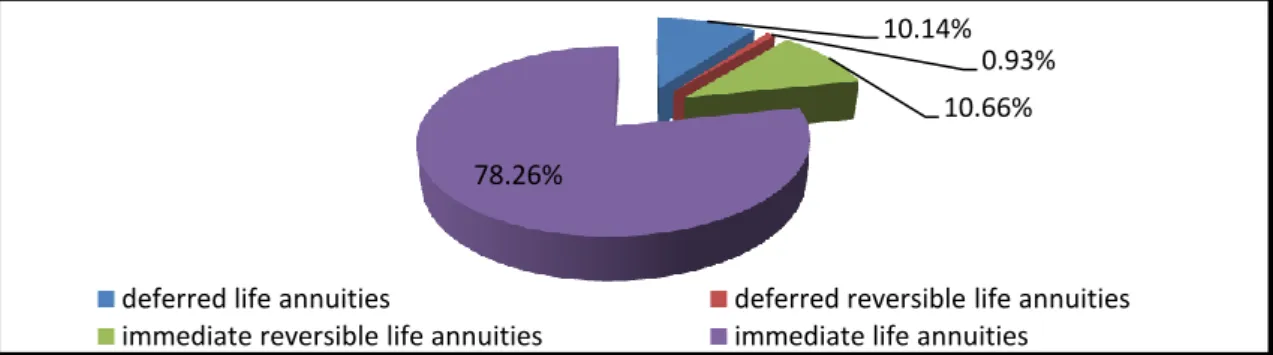
Group portfolio has the four basic kinds of products: immediate life annuities, deferred life annuities, immediate reversible life annuities and deferred reversible life annuities (See Table 16 in Appendix C to check the product code numbers and their respective assumptions).
Figure 4: Distribution of the number of the policyholders among annuity products Source: EY-Insurance database
The previous graph shows the distribution of the products in terms of the number of policyholders. It can be clearly said that immediate annuities are the vital products for the company, in terms of the preferences of policyholders.
10.14% 0.93% 10.66% 78.26%
deferred life annuities deferred reversible life annuities immediate reversible life annuities immediate life annuities
18
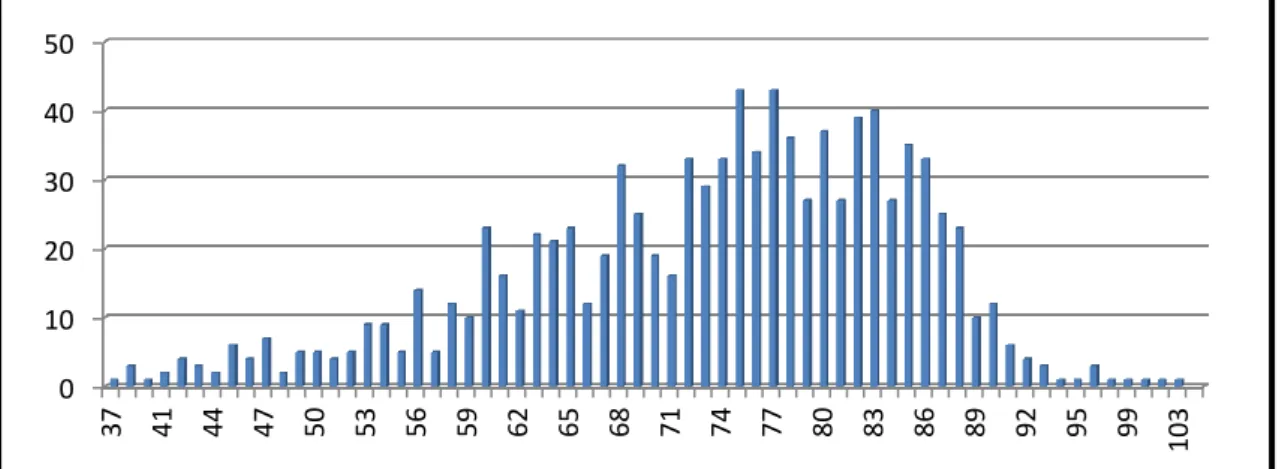
Figure 5: Total age distribution of the EY-Insurance group annuity portfolio, Source: EY-Insurance database
When the age distribution on the EY-Insurance portfolio is checked, it shows expected differences from the age distribution of the life insurance Portuguese population. This happens because the average age of the people who have life annuities in Portugal is higher than the average age for the ones who purchase other kinds of life products. That is why the density of the number of the people in our portfolio is shifted to the older ages, 65-90 years.
The age distributions of the EY-Insurance annuitant population and the preferences of the policyholders (the number of the annuitants in each product) can be observed in Figure 12 and Figure 13 in Appendix D.
From the reserving point of view, Kozarevic (2010) supports that “The primary purpose of the company is the settlement of future liabilities under the basis on the insurance contract and coverage of possible losses”.
EY-Insurance calculates the mathematical reserves by pricing all individual and group annuities each year and compensates the difference, if the account of the annuitant is less than it is supposed to be, to protect itself from being insolvent.
0 10 20 30 40 50 37 41 44 47 50 53 56 59 62 65 68 71 74 77 80 83 86 89 92 95 99 103
19
Figure 6: Mathematical reserve distribution of life annuity products Source: EY-Insurance database
Figure 6 shows how the mathematical reserve is divided by the four kinds of life annuities in question - see Appendix D, Figure 14, for a complementary analysis. Due to the comparatively much bigger number of policyholders and amount of mathematical reserve of the immediate annuities, the deferred annuities will not be included in the following assumptions study, to see the real effect of the assumptions on the mathematical reserve. Moreover, the “deferred life annuities” and the “deferred reversible life annuities” will be evaluated as the “immediate life annuities” or “immediate reversible life annuities” just after the deferment period. So, working on immediate and immediate reversible life annuities somehow covers the mortality assumption study for deferred and deferred reversible life annuities as well.
2.06% 3.64%
43.91% 50.39%
Deferred life annuities Deferred reversible life annuities Immediate life annuities Immediate reversible life annuities
20
4. COMPANY STUDY 4.1. Mortality Study
The basic element of the pricing and mathematical reserve calculations for annuities is perhaps the mortality model assumed.
This section aims to find the best approach for the mortality table by using only immediate life annuities and immediate reversible life annuities, as explained.
The mortality table that is chosen for the purpose of having a good approximation to the future mortality may be a static table or of a dynamic kind table:
Static life tables give the mortality for fixed periods (do not consider the generation effect), like the existing mortality tables (TV, GKF, PF...) or the Portuguese life tables from APS.
In dynamic life tables, mortality depends also on the current year (generation) alongside with age (Kainhofer, 2005).
4.1.1. Static Modelling
Based on historical data and experienced judgement, the trend for the future development of mortality can be estimated. Since there is no suitable market data about Portuguese annuitants, company data will be used in each case of comparisons. There are historical annuitant data for EY-Insurance since 2009.
In order to find the best existing mortality table for the company data, least square error fitting is used. The least square error approach is used to find continuous differentiable quantities instead of absolute values, by minimizing the sum of the squares of the residuals (Weisstein, 2012).
The average starting age of immediate life and immediate reversible life annuity consumers in EY-Insurance is 50 years and the maximum life time is 105 years. Since
21
the densest age period is 65-90, both age periods will be considered in an attempt to gain a better understanding of the population in question.
Table 1: Fitted percentages of some selected mortality tables to company population Source: EY-Insurance database
In Table 1, the percentages of the fittings between the company data and some selected mortality tables by least square fitting for the most dense age period of the data (65-90) and the whole age span can be seen. The Swiss mortality table GKF 95 is the best mortality table for the company, see Appendix D, Figure 15 and Figure 16; it is the only one to show a mortality distribution similar to that of the population, all the others overestimate the number of deaths, and this can be very dangerous. If the company used 100% of the GKF 95 mortality table, the total result for the years of 2009-2012 would be the following;
Age 50-105 Age 65-90
Mortality
Tables TOTAL TOTAL
PF 60/64 67.96% 66.95% PM 60/64 45.99% 44.35% GKF 70 75.18% 73.35% GKM 70 48.19% 46.70% GKF 80 87.18% 84.57% GKM 80 47.52% 45.38% TV 73/77 68.94% 67.80% TD 73/77 46.65% 44.85% TV 88/90 93.01% 93.23% TD 88/90 58.36% 56.96% GRF 80 98.43% 97.28% GRM 80 72.72% 70.78% GKM 95 62.38% 59.12% GKF 95 108.85% 104.29%
22
Total number of people
Total expected number of deaths
Total real number of deaths
Total difference (real – expected)
3567 143.3 156 12.7
Table 2: Difference between the real and expected number of deaths based on GKF95 table Source: EY-Insurance database
At the request of the company, PERM/F 2000 Spanish mortality table was also considered in the hope that Portugal and Spain would experience similar mortality patterns.
The mortality study was made in Spain to search a new mortality table to be used in life insurance. The collected population data is organized as mortality tables for each year of birth from 1884 to 2001. Each generation has its own life table and the calculations need to be implemented for each of them in every pricing of new account or mathematical reserves for the existing ones.
Total number of people Expected number of deaths Real number of deaths
Total difference (real – expected)
3567 94 156 62
Table 3:Difference between the real and expected number of deaths based on PERM/F 2000 table Source: EY-Insurance database
As a result it is clear that the PERM/F 2000 tables underestimate the mortality in the company. GKF 95 table remains the best fit for the population in EY-Insurance.
4.1.2. Dynamic Modelling
Time is very important when mortality is to be forecasted. Dynamic mortality modelling is an approach which uses both the age and the year. An attempt was made in this domain, with the Gompertz-Makeham Law.
4.1.2.1. Gompertz-Makeham Distribution
The Gompertz-Makeham is a distribution that traditionally gives very good approximations to the distributions of human mortality (Norström, 1997).
23
where t is time in years, x is the age and , and are estimated parameters: and are time varying parameters and independently extrapolated; is the slope parameter and its value varies among population. (Saddiqi, 2008).
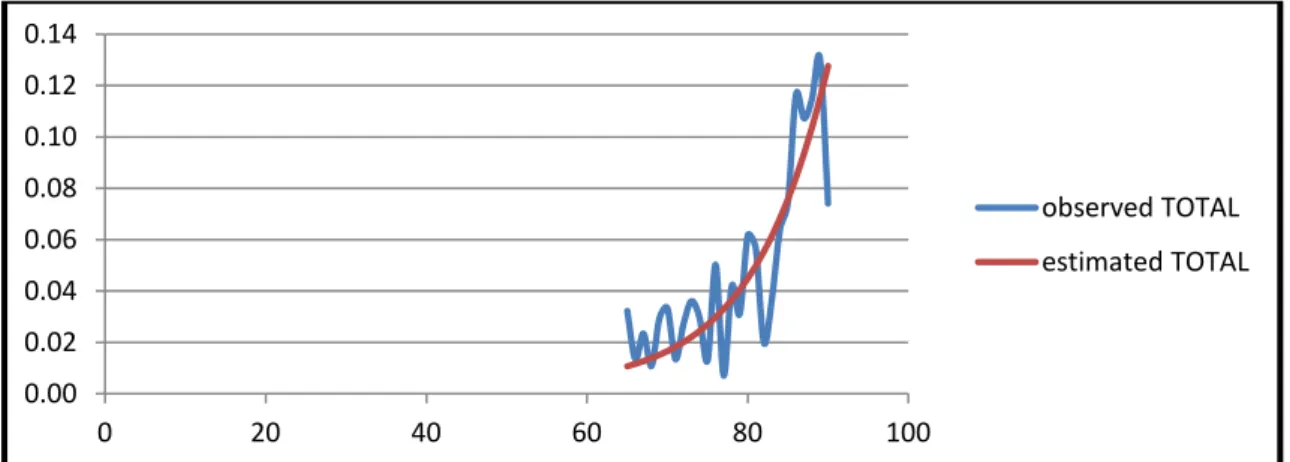
Figure 17 in Appendix D shows the estimation for ages 50-105 in EY-Insurance by Gompertz-Makeham, using OLS and Excel. The graph demonstrates that the mortality curve is clearer for the age group 65-90 and the fit is not good for older ages. The detailed analysis for 65-90 is then more interesting.
Figure 7: Fitted Gompertz-Makeham estimation to the weighted average of historical company data for ages 65-90
Source: EY-Insurance database
The estimated plot shows good smoothing for the weighted average of the historical company data with the standard deviation of 3.472% between them.
4.1.2.2. Forecasting the Future Mortality Trend
In 2008, Swiss Re conducted a study to construct annuity mortality tables for Portugal, by comparing the whole Portuguese population with annuitant populations from some other countries already available. Since they had a large amount of data from the whole Portuguese population it was possible to detect the time effect on mortality.
0.00 0.02 0.04 0.06 0.08 0.10 0.12 0.14 0 20 40 60 80 100 observed TOTAL estimated TOTAL
24
EY-Insurance has only four years of historical data and after following the same process as Swiss Re, there was no evidence that the variability among different years resulted from a systematic evolution pattern - the period is too short.
In the hope that it would be easier to find a pattern effect, if there is one, the study was done only for the ages 65-90 because of the comparatively big numbers of policyholders in this span. Not surprisingly, results were rather inconclusive.
Figure 8: One year forecasting using company mortality distribution and estimation by Gompertz-Makeham model
Source: EY-Insurance database
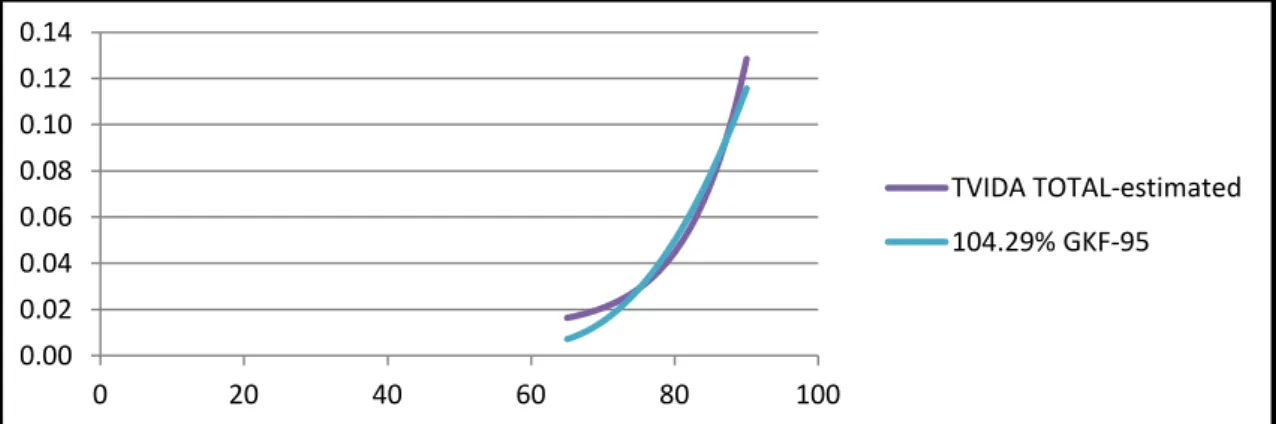
Nevertheless, table GKF 95 can be adjusted to compensate the small mortality evolutions that were detected, cf. Figure 9.
Figure 9: Comparison of one year forecasted company population and fitted mortality table GKF95, Source
EY-Insurance database
For more details about forecasting the future mortality, Appendix B can be consulted.
-0.05 0 0.05 0.1 0.15 0.2 0.25 0.3 0 20 40 60 80 100 q(x,n+1) estimated real2012 0.00 0.02 0.04 0.06 0.08 0.10 0.12 0.14 0 20 40 60 80 100 TVIDA TOTAL-estimated 104.29% GKF-95
25
4.2. Sensitivity Analysis
It is always worth repeating how the mathematical reserve results mainly depend on the technical assumptions like the best estimate mortality, return on investment, etc. The uncertainty comes from the lack of knowledge about these variables and their evolution through time.
A sensitivity analysis can be used to see the effects of different values of technical assumptions. With this purpose, different scenarios can be simulated to understand the influences in question. There are two possible ways to perform a sensitivity analysis: “successively” or “simultaneously” (Darbellay, 1999).
4.2.1. Successive Sensitivity Analysis
This is an approach where only one assumption is changed at a time and the other assumptions are supposed to be fixed. The process is repeated for every assumption. The purpose of this method is to find which technical assumption is less or more effective on mathematical reserve results. (Darbellay, 1999).
4.2.1.1. Mortality Effect
Based on the results of Gompertz-Makeham forecasting model, there is no evidence about the time effect on mortality. So, theoretical mortality tables can be used to check the different scenarios.
In order to see the effect of each mortality table assumption on the current mathematical reserve, the unique premiums of each immediate and immediate reversible life annuities are calculated with the mortality assumptions described in Section 4.1.1.
26
Table (50-105 ages) Difference from
company account Table (65-90 ages)
Difference from company account 67.96% PF60/64 3.51% 66.95% PF60/64 4.10% 75.18% GKF70 4.12% 73.35% GKF70 5.13% 87.18% GKF80 7.85% 84.57% GKF80 9.11% 68.94% TV73/77 7.49% 67.80% TV73/77 8.13% 93.01% TV88/90 6.57% 93.23% TV88/90 6.49% 98.43% GRF80 6.90% 97.28% GRF80 7.35% 108.85% GKF95 8.34% 104.29% GKF95 10.15%
Table 4: Differences (%) between the current mathematical reserve and the required amount according to the fitted percentages of selected mortality tables
Source: EY-Insurance database
As mentioned before, the mortality table should be chosen conservatively when pricing annuities or reserving for future liabilities for these annuities. The main results of the calculations are:
1. According to the static mortality table study and Gompertz-Makeham forecasting study, GKF95 with some percentage is the best fit table for the company population.
2. Despite the broadest age span in the company is 50-105, the most dense age period for the company is the 65 to 90 years.
With respect to evidence, it is better to keep reserve by assuming 108.95% of GKF 95 mortality table, which is not a present choice of EY-Insurance. Moreover, keeping reserve according to 104.29% of GKF 95 table will guarantee the necessary amount for the entire span of ages.
4.2.1.2. Rate of Interest Effect
Managing an annuity portfolio involves investing on financial products to finance the expected liability cash flows. That would be achieved by designing a financial portfolio that generates cash flows at least equal to the expected annuity payments.
27
The government actuary of United Kingdom, (Chris Daykin, 2002) suggested in one of his workshops about annuity reserving that the responsibility of the company can be achieved by investing on ordinary fixed interest bonds, if the reserving is for immediate annuities which pay flat amounts or amounts that go up by a fixed percentage each time of payment.
Nowadays it is difficult to apply this rule because the durations of the annuity contracts are typically very long and the uncertainty about future rates of return is high. Additionally, the random nature of interest rates causes problems in determining fair values of prices and actuarial reserves. For instance, the annuitant may pay higher premiums and the insurer may provide more capital than necessary, in the case of assuming needlessly small interest rates. In that case, actuaries should try to embed the stochastic interest rate assumption into their calculations. (Daykin, 2002).
In the next subsection, only the fixed interest rates will vary, to see the effect on reserving. A stochastic interest rate analysis could not be performed because of lack of time during the internship.
4.2.1.2.1. Fixed Rate of Interest
The rate of interest must be chosen regarding the returns on assets chosen by the financial department (Williams, 1986).
At a request of the company, the following rates of interest were considered to calculate the necessary mathematical reserves and the amounts of differences from the current mathematical reserve. Obviously, the necessary mathematical reserve, which the company must hold, increases when the rate of interest decreases.
28
Interest Rate Difference from the company account
2.50% 10.72%
3% 5.71%
4% - 3.15%
Table 5: Differences (%) between the current mathematical reserve and the required amount under various scenarios for the rate of interest
Source: EY-Insurance database
Since the decision on the appropriate interest rate as technical assumption for life annuities is not a part of the project, there is no suggestion about the “best” rate of interest to calculate the necessary mathematical reserve. Still, analysing the best rate of interest is an indispensable study for the insurance company to be sure whether the rates are appropriate or not.
4.2.1.3. Expenses Effect
The key in expenses assumptions is to begin by covering all of the basic expenses and then making provisions for extra emergency expenses, if desired. (Babbel, 2007a). The three basic expenses (acquisitions (alpha), administrative costs (gamma) and annuity payment cost (delta)) for the immediate and immediate reversible life annuities are the following;
Alpha Gamma Delta
Immediate Life Annuities 0.75% of annual payment
0.25% of annual payment
0.5% of annual payment Immediate Reversible Life
Annuities 0.75% of annual payment 0.25% of annual payment 0.5% of annual payment
Table 6: Technical expense assumptions for immediate life annuities Source: EY-Insurance technical assumptions
These percentages seem high but they are fixed by the administration and are not under discussion. That is why there is no sensitivity analysis for expenses in this report, but it would be prudent to review their appropriateness in future works.
29
To briefly conclude this section it can be said that apparently results show that the rate of interest assumption has a greater effect than the mortality table assumption on the level of the current mathematical reserve.
4.2.2. Simultaneous Sensitivity Analysis
The values of the whole assumptions are changed in a simultaneous sensitivity analysis. The aim is to find the best and the worst scenarios with the combination of rates of interest and mortality tables (Darbellay, 1999).
4.2.2.1. The Combined Effects of Mortality and Interest
In this section, we will show the amounts of necessary mathematical reserves based on different combinations of mortality tables and rates of interest.
Differences from the company account
Mortality Rate of Interest 2.50% 3.00% 4.00% PF 60/64 67.96% 11.08% 6.29% - 2.25% GKF 70 75.18% 11.86% 7% -1.66% GKF 80 87.18% 16.17% 10.97% 1.74% TV 73/77 68.94% 15.61% 10.47% 1.34% TV 88/90 93.01% 14.43% 9.41% 0.47% GRF 80 98.43% 14.89% 9.81% 0,79% GKF 95 108.85% 16.75% 11.48% 2.14%
Table 7: Differences (%) between the current mathematical reserve and the required amount under different combinations of mortality and interest (ages 50-105)
Source: EY-Insurance database
According to the reserve calculations for age span 50-105, the highest increase on the mathematical reserve result from an interest rate of 2.5% combined with the mortality table 108.85% of GKF95. If the combination choice of the company is 67.96% of PF 60/64 and 4% rate of interest, then company would not have to compensate any difference for mathematical reserve. Of course this was already known before any calculations were performed.
30
For age span 65-90, Table 17 in Appendix C, informs that the combination of 66.95% of PF 60/64 table with 4% rate of interest would not require a mathematical reserve compensation while the combination 2.5% rate of interest with 104.29% of GKF 95 mortality table requires the highest increase on current mathematical reserve.
Considering ages 65-90, the percentages of the mortality tables are less than the ones for ages 50-105. As mentioned before (Section 4.2.1.1) that causes an increase on the necessary technical mathematical reserve. It should not be ignored that the most dense age span for the company is 65-90.
Differences from the company account
Rate of interest
Table 2.50% 3.00% 4.00%
TV 73/77 - 0.57% - 4.53% - 11.63%
GKF 95 20.94% 15.33% 5.42%
Table 8: Differences (%) between the current mathematical reserve and the required amount under the usual mortality/rate of interest scenarios (ages 50-105)
Source: EY-Insurance database
The results above show the amounts for the differences between the current mathematical reserve and the necessary reserve increase under each scenario, at request of the company.
4.3. Profit Testing
This test is a measure that shows how profitable it is for the company to sell a certain kind of insurance product. Consequently, profit testing can be used both as an internal risk management tool to see the profitability and as a pricing tool. It is based on the yearly expected cash-flow of each insurance contract under the company’s technical assumptions (Zwiesler, 1994).
Unfortunately, the profitability analysis is not easy to develop for long-term life products like annuities (Richards, 2006). In spite of that, in this section we do profit
31
testing for immediate life and immediate reversible life annuities. First, the mathematical reserves on 31.12.2011 and 31.12.2012 are determined based on the existing data. Then, expected number of deaths, expected paid amounts, expected changes in mathematical reserve and expected interest earned are calculated, according to the technical mortality assumptions. Finally, the expected and real results are compared.
Paid Amount MR Variation Interest Earned
Technical Assumptions
Exp. Total € 3,656,464.32 - € 2,329,531.8 € 1,323,288.05 Real € 3,692,660.17 - € 1,994,220.69 € 1,333,435.94
Table 9: The result of profit testing on company portfolio by assuming the technical assumptions Source: EY-Insurance database
By the profit testing on the company portfolio, we can see that the technical assumptions of immediate life annuities are not adequate to cover the liabilities of the firm.
Expected Real Difference (Real-Expected)
Technical Assumptions -3,644.45 -365,003.55 -361,359.10
Table 10: Profitability analysis under the technical assumptions of life annuities for data set Source: EY-Insurance database
We tested the profitability in last year by assuming that the assumptions are the best fit mortality tables to the distorted company data and the technical rates of interest.
Expected Real Difference (Real-Expected)
104,29% GKF95 -18,831.13 -143,630.56 -124,799.43 108,95% GKF95 -683,793.76 -183,161.26 500,632.50
Table 11: Profitability analysis under the fitted mortality tables with technical rates of interest Source: EY-Insurance database
The difference between expected and real results is very significant. Higher negative results than the one with technical assumptions were obtained for the expected
32
profit/loss because profit testing checks the results only for the last year, and it may not be sufficient to compensate the rest of the historical period.
It is clear that considering 104.29% of GKF 95 table is not enough to have profit on life annuities but it compensates a significant part of the loss. On the other hand, 108.95% of GKF95 table produces a profit.
To sum up, we suggest that the company can assume 108.95% of GKF 95 table, but in order to be sure about the profitability of life annuities with this assumption, profit testing should be done in further years. Moreover, guaranteed reserve can be assumed according to 104.29% of GKF 95 table but in addition to this, it would be better to see the combinations of fitted mortality tables with “best” rate of interest, to have appropriate technical basis for profitable life annuities.
33
5. CONCLUSION
This section provides a summary of the project to conclude the work. A brief outline of the problem, the objectives, the models used and the results will be presented. In addition, the possible future works will be explained at the end.
The life annuity business is based on having proper technical basis to price the new products and to reserve for the ones already sold. A most important part of the technical basis is to establish an appropriate mortality assumption to hedge the higher longevity risk that life insurance companies presently face.
This study basically aims to find the best actuarial mortality table assumption and goes around the evaluation of the profitability of the life annuity products for the insurance company where the internship took place. Only immediate and immediate reversible whole life annuities were included, in order to get significant results. This is not an important limitation because the deferred annuities are assumed to be immediate life annuities just after the deferment period is over, and term annuities comprise a very small part of life products.
The study starts by looking for the best mortality table for the company portfolio. We conclude that this is the 108.95% of GKF95 table for the whole age span, 50-105. Thereafter, the forecasting of future mortality was essayed but the variability among different years did not allow detecting that there is an evolution pattern. Then, sensitivity analyses were performed for the mortality and rate of interest assumptions. The purpose is to find for how much the current mathematical reserve must be increased if the assurance company decides to change the technical assumptions on the estimated mortality tables (with some percentages) and the interest rates. Several different scenarios were defined.
34
The expenses assumptions had no place in the sensitivity analysis because they are fixed by the administration and are not a topic under discussion.
The last part of the work showed the profitability of the life annuity products under different technical assumptions regarding mortality and interest. The results confirm that the company does not make a profit with its present technical basis. We tested then the profitability for the 108.95% and 104.29 % of GKF 95 mortality table to prove their appropriateness.
In conclusion, our analysis suggests that 108.95% of GKF95 table can be assumed as initial mortality table, in order to quote the prices and to reserve, and 104.29% of GKF 95 table can be assumed to hold extra reserve. The profit testing must be repeated in the future to be sure about profitability with these assumptions.
5.1. Future Studies
The project does not include the estimation of interest rate behaviour and expenses. It would be very helpful to study on these assumptions for good pricing and reserving. Hence, future studies must focus on finding the “best” combination of all technical assumptions by using integrated stochastic models, for that is the one sensible way to deal adequately with such a difficult and important matter. Of course this will be possible only after a minimum number of years have elapsed so that a sufficient amount of data is available.
35 REFERENCES
Babbel, David F. And Craig Merrill B. (2007). Investing Your Lump Sum at Retirement. Policy Brief, Personal Finance, Wharton Financial Institutions Center.
Barros, Carlos P., Barroso, Nazaré and Borges, Maria R. (2003). Measuring Efficiency in the Life Insurance Industry with a Stochastic Frontier Model. 28th International
Congress of Actuaries. Ch. 2, pp. 4-6.
Barros, Carlos P., Barroso, Nazaré and Borges, Maria R. (2005). Evaluating the Efficiency and Productivity of Insurance Companies with a Malmquist Index: A Case Study for Portugal. The Geneva Papers, 30, pp. 244-267.
Bravo, J. M., Real, P. C., Silva, C. M. P. (2009) Participating life annuities incorporating longevity risk sharing arrangements. Proceedings of the Innovation in Retirement Award - Programa Consciência Leve, Fidelidade - Companhia de Seguros S.A
Cannon, E. and I. Tonks (2006) “Survey of Annuity Pricing”, Department of Work and Pensions Research Report No. 318.
Darbellay, Paul A. (1999). Valuation Methods of a Life Insurance Company. 8th Symposium on Finance, Banking and Insurance. Ch. 2-5, pp. 4-29.
Davidoff, Thomas, Brown, Jeffrey R. and Diamond, Peter A. (2003). Annuities and Individual Welfare. NBER Working Paper Serie-9714, Ch. 1, pp. 1. Available from: http://www.nber.org/papers/w9714
Davis, Philip E. (2002). Issues in the Regulation of Annuities Markets. Center for Research on Pensions and Welfare Policies (CERP), working paper 26/02, Ch. 4, pp. 9-13
36
Daykin, Chris (2002). Reserving For Annuities. Annuities Workshop, pp. 32-40.
Dickson, David C. M., Hardy, Mary R. and Waters, Howard R. (2009). Actuarial Mathematics for Life Contingent Risk. Chaps. 4-5, pp. 73-141.
DWP and Inland Revenue (2002). Modernising Annuities, A Consultation Document. UK Government Web Archive, retrieved 27 August 2009. Ch. 1, pp. 5-6. Available from: http://bit.ly/30K3xe
IMF-International Monetary Fund (2012). The Financial Impact of Longevity Risk, Ch. 4, pp. 1-27. Available from:
http://www.imf.org/external/pubs/ft/gfsr/2012/01/pdf/c4.pdf
Insurance Act,1938 (2002). Assets and Liabilities How to be Valued. Solvency margin, advance payment of premium and restrictions on the opening of a new place of business, Part II-C, pp. 92-96.
Insurance Market Overview, APS-Associação Portuguesa de Seguradores, Ch. 2-3, pp. 19-39. Available from:
http://www.apseguradores.pt/Site/SiteMarket.aspx?FolderId=723
Jakovcevic, Drago and Lovrinovic, Ivan (2004). Impact of Savings on Portfolio Structure of Insurance Companies. Zagreb International Review of Economics & Business, Conference issue, pp. 51-66.
Kainhofer, Reinhold and Predota, Martin and Schmock, Uwe (2005). The New Austrian Annuity Valuation Table AVÖ 2005R. Ch. 2, pp. 58-60.
37
Kozarević, Safet and Radivoj Kovač, (2010). Reserves management of insurers – case of Bosnia and Herzegovina. Publishing company “Business Perspectives”, Insurance Markets and Companies: Analyses and Actuarial Computations, Vol. 1, Ukraine, 1: 12-20.
Moore, John and Greenblum, Eli (2009). Selecting and Documenting Mortality Assumptions for Pensions. A Public Policy Practice Note. American Academy of Actuaries, revised October 2011. Ch. 1, pp. 3-6. Available from:
http://cv.actuary.org/practice.asp
Norström, Fredrik (1997). The Gompertz-Makeham Distribution. Ch. 1-2, pp. 1-14.
Richards, Stephen (2006). Profit Testing. Encyclopedia of Actuarial Science. Ch.1, pp. 8-23.
Saddiqi, Omer (2008). Dynamic and Stochastic Survival Models – A Comparison of Europe. Ch. 3-5, pp. 14-28.
Swiss Re (2008). Construction of Annuity Mortality Tables for Portugal. Technical Momerandum. Ch. 4, pp. 9-12.
Weisstein, Eric W. (2012). Least Squares Fitting. Math World – A Wolfram Web Resource. Available from: http://mathworld.wolfram.com/LeastSquaresFitting.html Williams, Arthur C. (1986). Higher Interest Rates, Longer Lifetimes, and the Demand for life Annuities. Journal of Risk and Insurance, Vol. 53, no. 1 (March), pp. 164-171.
Zwiesler, Hans J. (1994). The Profitabilty of Insurance. Operations Research’ 93. Pp. 542-545. Ulm, Germany.