Implications of climate variability and future trends on wheat production
and crop technology adaptations in southern regions of Portugal
M. Carvalho, R. Serralheiro, J. Corte-Real and P. Valverde
Instituto de Ciências Agrárias e Ambientais Mediterrânicas, Universidade de Évora, Portugal e-mails: mjc@uevora.pt,ricardo@uevora.pt, jcr@uevora.pt, pedrovalv@gmail.com
Abstract: The effects of climate conditions and its variability are analysed in the context of rainfed agriculture under Mediterranean climate in the south of Portugal. The reference crop is wheat using data from field experiments carried out for several years, using different amounts of nitrogen and two wheat genotypes. Wheat yields can be limited either by drought and excess of water and winter rainfall has a large effect on nitrogen response of the crop. There is a negative impact of high temperatures during April and May, but its effect depends on the wheat genotype. Supplementary irrigation, improving soil saturated hydraulic conductivity, soil bearing capacity and plant breeding for shorter grain filling period and genetic tolerance to high temperatures will be important adaptations, having in mind the present and climate change scenarios.
Key words: Climate variability, climate change, wheat yield, nitrogen and genotype.
1. INTRODUCTION
Besides the concentration of rainfall during the fall and winter, the Mediterranean climate is characterized by an astonishing variability. In the Évora meteorological station, the annual rainfall records are showing variations between 340 and 1180 mm. For the rainfed agriculture, there are two critical periods in relation to precipitation. One is from November to February which affects the vegetative growth, and the other is March and April, when most of the crops are in the reproductive phase. Naturally, the amount of rainfall in each one of these periods affects not only crop yields (Carvalho 1987), but also the nitrogen fertilization required to achieve potential yield (Carvalho and Basch 1996). Temperature, especially during the reproductive stages, is also highly variable and has a large impact on crop yield. High temperature during heading and flowering can reduce the number of grains per spikelet (Fisher and Maurer 1976; Bhullar and Jenner 1983) and the weight per grain (Amores-Vergara and Casrtwright 1984; Wardlaw 1970). However, under the conditions prevailing in the south of Portugal, its effect depends on the wheat genotype (Carvalho et al. 1991).
2. MATERIAL AND METHODS
Wheat yield from field experiments were used to establish equation 1. The experiments were carried out in two experimental stations. A first set of data was obtained during the period of 1981 to 1986, in Almocreva Experimental farm (37º 99΄ N and 7º 92΄ W). Data from the same experiment were used to establish Figures 1 and 2. These experiments are described in Carvalho (1987). A second set of data was obtained at the Revilheira experimental farm (38º 45΄ N and 7º 49΄ W), and the experiments are described in Carvalho et al. (2005). These data were also used to establish Equations 2 and 3.
While in situ observations of precipitation and temperature are sufficient to assess the influences on wheat yields of those weather elements, the task of providing a quantitative evaluation of the same elements under future climatic conditions, demands the use of projections obtained from climate models. Global models are too coarse for the purposes of this study; in other words, the
outputs of these models must be downscaled to the region of interest. Downscaling can be carried out by statistical methods, dynamic methods or a combination of both. In this study, simulations from a regional climate model (RCM) driven by a coupled atmosphere-ocean global climate model (AOGCM) were used (dynamic downscaling); future regional climate projections were obtained under one SRES emission scenario, named A1B (Nakićenović et al. 2000). The RCM and AOGCM are, respectively, the HadRM3Q0 and HadCM3Q0 (Collins et al. 2006).
Data extracted for the model grid point nearest to Évora (38º 28’ N and 7º 28’ W) for the periods 1961-1990 (reference period) and 2041-2070 (scenario period) are daily values of precipitation, maximum and minimum temperatures.
3. RESULTS AND DISCUSSION
3.1 Effect of rainfall on the wheat yields and nitrogen requirement
Wheat yields are closely related with the rainfall during two periods: from November to February (X1) and from March to April (X2) with the effect of the first term being quadratic and the
second linear (Equation 1).
Y = 360+ 4.95 X1 – 0.005 X12 + 13.2 X2 (r2=0.82 p<0.005) (1)
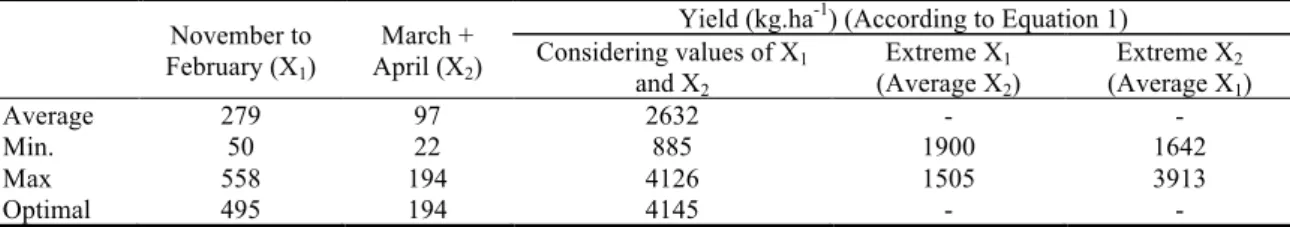
Taking into consideration the rainfall occurred in the region it is possible to calculate the limits of variation of wheat yields (Table 1). The yield potential is 4145 kg.ha-1 and can be limited either by water deficit or excess during the fall and winter and by water deficit during the spring.
Equation (1) was calculated from data of experimental fields where nitrogen was never a limiting factor. However, the nitrogen requirements to achieve the potential yield increase with the rainfall during the period from November to February (Figure 1).
Table 1. Variation of rainfall and its effect on wheat yield in Évora region for the period of 1964 to 2009 (equation 1)
November to February (X1)
March + April (X2)
Yield (kg.ha-1) (According to Equation 1)
Considering values of X1 and X2 Extreme X1 (Average X2) Extreme X2 (Average X1) Average 279 97 2632 - - Min. 50 22 885 1900 1642 Max 558 194 4126 1505 3913 Optimal 495 194 4145 - -
Figure 1. Relationship between rainfall, wheat yield and N required to achieve potential yield (Carvalho and Basch, 1996) 200 250 300 350 400 450 500 15 20 25 30 35 40 200 250 300 350 400 450 G rai n Y ie ld (g.m -2) N itr oge n F er ti li zati on (g.m -2)
Rainfall (Nov. to Feb.) (mm)
N Fertilization Wheat Yield
Assuming three applications of nitrogen (one at seeding and two top dressings - 20th of January and 28th of February) it is possible to calculate the optimum level of nitrogen according to equation (2) (Y-wheat grain yield in kg.ha-1; N-total nitrogen to be applied in kg N.ha-1; R1- rainfall from 1rst
November to 20th of January; R
2- rainfall from 20th January to 28th February) and its derivative in
relation to N (with a return of 4 kg of wheat per kg of N – derivative equals to 4) (equation 3) (Carvalho et al 2005).
Y = 574 + 10.25 N – 0.04 N2 – 1.76 R
1 + 0.001 R1N + 19.6 R2 + 0.09 R2N (r2=0.90 p<0.0001) (2)
N = 78.1 + 0.01 R1 + 1.1 R2 (3)
According to Equation (1) the optimum rainfall amount for wheat production during the winter (X1) is 495 mm. However, in most situations, farmers cannot apply nitrogen at the correct time
during wet winters, because traffic difficulties over the soil. This means that, in practice, wheat yields are usually limited by winter rainfall less than 495 mm due to nitrogen deficiency. Taking into consideration the limitations to wheat yield by water excess and nitrogen deficiency during wet winters, and water deficit during dry winters and springs, the most important adaptations of the agricultural systems in the Mediterranean regions are supplementary irrigation and improvement of soil transitability, by improving drainage and soil bare capacity, what can be done by adopting no-till techniques.
3.2 Effect of spring temperature on the wheat yields and interaction with genotype
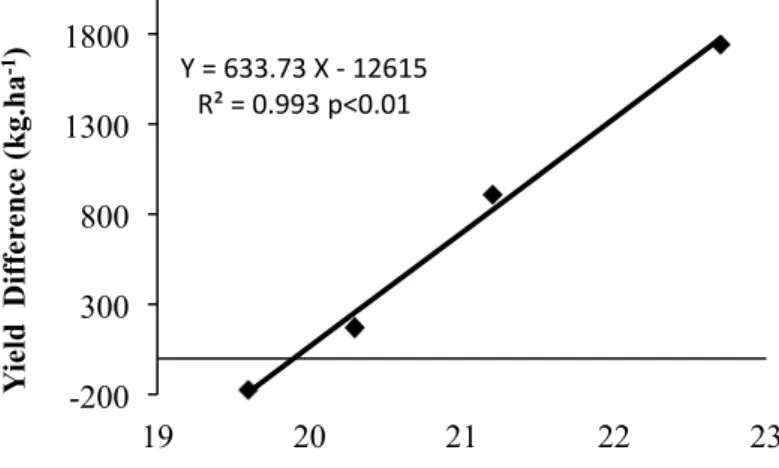
Wheat is very sensitive to heat stress during the reproductive stages. Temperature presents also a high variability under Mediterranean climate, and maximum temperatures are particularly problematic during April and May. The heat stress is deleterious even in well watered plants and, therefore, the problem cannot be solved only by irrigation. Plant breeding will be necessary to reduce the risks and the negative impact of high temperatures. Wheat varieties with a longer grain filling period have a higher yield potential, but are more susceptible to heat stress during the reproductive stage under Mediterranean climate (Figure 2). Varieties with a shorter grain filling period will be more adapted to the climatic conditions and will present an additional benefit of less irrigation requirements during the spring.
Figure 2.The effect of maximum temperatures in April and May on the wheat yield differences between two genotypes (Cv. Mara - shorter and Cv. Etoile de Chosy - longer grain filling period), during four consecutive years. The yield difference is calculated by the difference between Mara and Etoile de Choisy yields (positive value means that Mara cv.
yield more than Etoile de Choisy cv.) (Carvalho et al. 1991).
Y = 633.73 X -‐ 12615 R² = 0.993 p<0.01 -200 300 800 1300 1800 19 20 21 22 23 Y ie ld D iffe re n ce (k g.h a -1)
3.3 Climate change scenarios
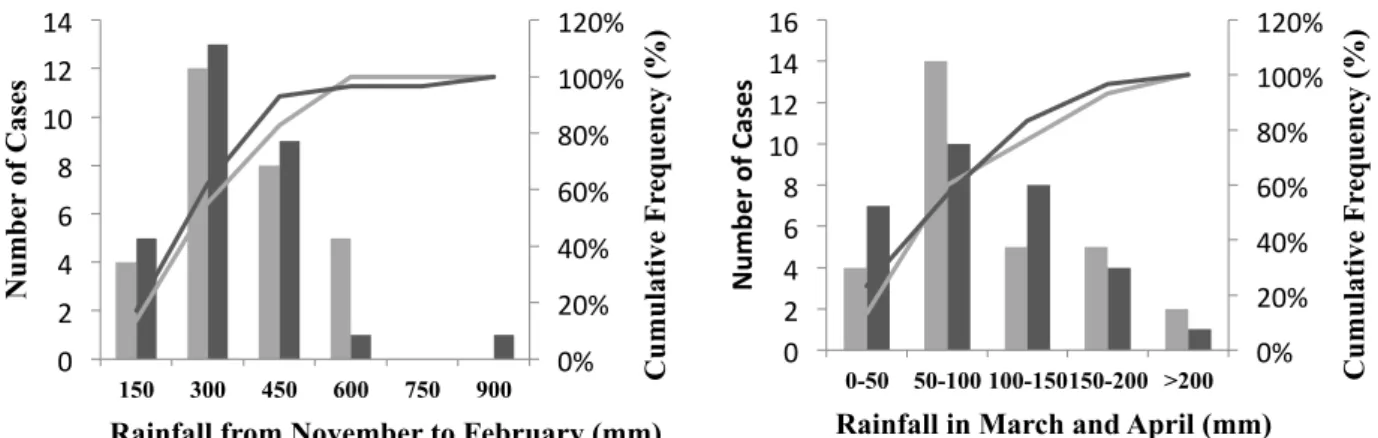
Annual mean rainfall totals are expected to decrease in the future, on the average, by 16% of reference value (data not shown). Figure 3 displays histograms of accumulated rainfall in November-February and March-April, for the reference and scenario periods, as well as the corresponding cumulative frequency distributions. Respecting to accumulated rainfall values between November and February, a slight increase in frequency of occurrence can be expected for the range 150-450 mm, from reference to scenario conditions, while a sharp decrease is foreseen above 450 mm. Extreme rainfall totals in the considered 4 month period can occur in the future, being absent for reference conditions. Concerning accumulated rainfall in the 2 month period March-April, a decrease in the frequency of occurrence can be expected in the ranges 50-100 mm and above 150 mm; on the contrary, a slight increase is anticipated for the range 100-150 mm.
Figure 3: Rainfall for the periods from November to February and March plus April for the periods of 1961/90 (light grey) and 2041/70 (dark grey) for Évora region according to model HadRM3Q0, under the SRES emission scenario A1B. Bars are relative to the number of cases and lines to cumulative frequency for each class of rainfall considered.
The implications of these expected climatic changes in the wheat yield at Évora are summarized in Table 2. It is foreseen a decrease of the average wheat yield, due to a reduction of maximum yields imposed by water stress, what strengths the benefits of implementing supplementary irrigation for wheat production.
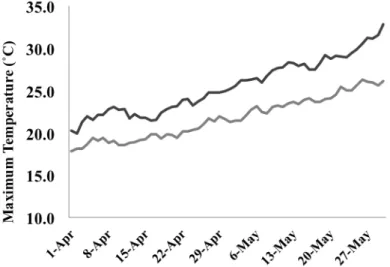
Mean values of daily maximum temperatures between April 1st and May 31st, are expected to increase by 3.7 ºC (from 21.8 ºC to 25.5 ºC); mean values of daily maximum temperatures, are shown in Figure 4, for both the thirty years long control and scenario periods. It is expected that wheat yield reductions due to heat stress will increase in the future. Irrigation won’t be enough to overcome the problem and special attention should be paid to plant breeding for this respect. According to the equation presented in Figure 2 and the raise of maximum temperature during April and May foreseen, the yield benefit of the wheat variety with the shorter grain filling period would have been 1200 kg of 1.yera-1 for the period 1961/90 and it will be 3545 kg of wheat.ha-1.year-1 for the period 2041/70. This reinforces the importance of plant breeding to heat stress, either by scape and genetic tolerance mechanisms.
Table 2. Wheat yield in Évora region, for the period of 1961/90 and 2041/70, according to equation 1 and the model HadRM3Q0, under the SRES emission scenario A1B.
Yield (kg.ha-1) (According to Equation 1 and Climate Change)
1961/90 2041/70 Average 2760 (±1076) 2454 (±797) Max. 5058 4778 Min 984 1187 0% 20% 40% 60% 80% 100% 120% 0 2 4 6 8 10 12 14 150 300 450 600 750 900 C u mu lati ve F re q u en cy (%) N u mb er of C as es
Rainfall from November to February (mm)
0% 20% 40% 60% 80% 100% 120% 0 2 4 6 8 10 12 14 16 0-50 50-100 100-150 150-200 >200 Cu mu lati ve F re q u en cy (%) Num be r of C ase s
Figure 4: Average maximum daily temperatures for the periods 1961/90 (light grey) and 2041/70 (dark grey) for Évora region according to model HadRM3Q0, under the SRES emission scenario A1B.
Since this is a preliminary assessment of the climatic effects on wheat yields, over southern Portugal, direct RCM outputs were used; this circumstance ignores the convenience that RCM data be corrected due to bias, poor parameterizations of physical processes, namely precipitation, and uncertainties inherent to all models (Frei et al. 2003). Besides, it would be advisable, for a better assessment, to take into account simulations from more than one RCM (Christensen et al. 2007), under different SRES emission scenarios or RCPs (Detlef van Vuuren et al. 2011). All these aspects are already being considered, and their application and results thereof, will be the content of a paper to be submitted in the near future.
4. CONCLUSIONS
The variability of the Mediterranean climate in the southern regions of Portugal limits yields of rainfed agriculture. Taking wheat as a reference crop, yields can be limited by the conditions during fall and winter due to water deficit or excess and nitrogen deficiency in wet winters and by the conditions during early spring due to water and heat stress. The negative impacts of these limitations are expected to increase under climate change conditions, especially the heat stress during reproductive stages. Supplementary irrigation, in order to alleviate water stress during dry winters and springs, improving soil transitability to ensure nitrogen applications during wet winters and reducing the reproductive stages duration of the crop by plant breading to reduce the risks of heat stress are major adaptations of winter agriculture under Mediterranean conditions, having in mind present and future climatic conditions.
REFERENCES
Amores-Vergara, E. and Cartwrigth, P.M., 1984. Effects of short periods of expose to high temperature on the phenology and shoot apex development of wheat c.v. Sonora 64. Aust. J. Agric. Res., 35:139-148
Bhullar, S.S. and Jenner, C.F., 1983. Response to brief periods of elevated temperature in ears and grains of wheat. Aust. J. Plant Physiol. 10:549-560
Carvalho, M., 1987. Factores limitantes e técnicas culturais da produção de trigo no Alentejo. PhD thesis, University of Évora 214 pp.
Carvalho, M., Azevedo, A.L., Basch, G., 1991. Definição de algumas caracterísitcas orientadoras na selecção de variedades de trigo para elevadas produções no Alentejo. I-componentes da produção. Melhoramento, 31: 90-101.
Carvalho, M., Basch, G., 1996. Optimisation of nitrogen fertilization. Fertilizar Research 43: 127-130.
Carvalho, M., Basch, G., Alpendre, P., Brandão, M., Santos, F., Figo, M., 2005. A adubação azotada do trigo de sequeiro: O problema da sua eficiência. Melhoramento, 40: 5-37.
Christensen, J. H. and Christensen O. B., 2007. A summary of the PRUDENCE model projections of changes in European climate by the end of this century, Climatic Change, 81 (Supplement 1), 7-30, doi:1007/s10584-006-9210-7.
Collins, M., Booth, B. B. B., Harris, G. R., Murphy, J. M., Sexton, D. M. H. and M. J. Webb, 2006. Towards quantifying uncertainty in transient climate change, Climate Dynamics, 27(2), 127-147, doi:10.1007/s00382-006-0121-0. (see also http://ensemblesrt3.dmi.dk/metadata/METO-HC_25km.pdf).
Detlef P. van Vuuren, Edmonds, J., Kainuma, M., Riahi, K., Thomson, A., Hibbard, K., Hurtt, G. C., Kram, T., Krey, V., Lamarque, J.F., Masui, T., Meinshausen M., Nakicenovic N., Smith, S. J. and Rose, S. K., 2011. The Representative Concentration Pathways: An Overview. Climatic Change, 109 (1-2), 5-31
Fisher, R.A. and Maurer, O.R.,1976. Crop temperature modification and yield potential in a dwarf spring wheat. Crop Science, 16:855-859.
Frei, C., Christensen, J.H., Déqué, M., Jacob, D., Jones, R.G. and Vidale, P.L., 2003. Daily precipitation statistics in regional climate models: evaluation and intercomparison for the European Alps. Journal of Geophysical Research, 108 (D3), 4124
Gupta, H. V., Sorooshian, S., 1998. Multi – objective global optimisation for hydrologic models. Journal of Hydrology, 204: 83-97. Nakićenović N., Alcamo, J., Davis, G., et al. 2000. IPCC Special Report on Emissions Scenarios, Cambridge University Press,
Cambridge, UK (available at http://www.ipcc.ch/ipccreports/sres/emission/index.htm).
Wardlaw, I.F., 1970. The early stages of grain development in wheat: response to light and temperature in a single variety. Aust. J. Biol. Sci,., 23: 765-774.