i João Afonso Pereira Pita
Fear the walking dead: the epidemic of zombie firms in Portugal
Masters in Economics
Supervisors: Professor Doutor Fernando Manuel Almeida Alexandre Professor Doutor Miguel Ângelo Reis Portela
ii
DIREITOS DE AUTOR E CONDIÇÕES DE UTILIZAÇÃO DO TRABALHO POR TERCEIROS
Este é um trabalho académico que pode ser utilizado por terceiros desde que respeitadas as regras e boas práticas internacionalmente aceites, no que concerne aos direitos de autor e direitos conexos. Assim, o presente trabalho pode ser utilizado nos termos previstos na licença abaixo indicada.Caso o utilizador necessite de permissão para poder fazer um uso do trabalho em condições não previstas no licenciamento indicado, deverá contactar o autor, através do RepositóriUM da Universidade do Minho.
Licença concedida aos utilizadores deste trabalho
Atribuição-NãoComercial-SemDerivações CC BY-NC-ND
iii
Acknowledgments
The accomplishment of this master's thesis had important support and incentives without which it would not be possible and for which I will be forever grateful.
Firstly, I want to thank the teachers Fernando Alexandre and Miguel Portela for their guidance and total availability, as well as for the incentives, opinions and criticisms in solving doubts and problems that came from the realization of this work.
I also leave here a word of thanks to all the teachers of the School of Economics and Management for the knowledge transmitted and for all the words of encouragement.
To my colleagues and friends who have always supported me in accomplishing this work with words and wisdom needed to overcome the problems that arose.
Finally, a special thanks to my parents, sister and other members of my family, especially my uncles who have always been present and gave unconditional support, for the financial and emotional support, encouragement and patience in helping with all the difficulties that arose. To them I dedicate this work.
Thank you so much, João Afonso Pereira Pita
iv
STATEMENT OF INTEGRITY
I hereby declare having conducted this academic work with integrity. I confirm that I have not used plagiarism or any form of undue use of information or falsification of results along the process leading to its elaboration.
v
Medo dos
zombies
: a epidemia de empresas
zombies
em Portugal
Resumo
Este estudo explora as empresas denominadas “zombies” na economia portuguesa. Estas empresas são definidas sendo empresas antigas e que tem problemas persistentes em pagar os juros de empréstimos bancários e desviam a produtividade do trabalho de empresas saudáveis.
O tema das empresas zombies já foi analisado desde o caso do Japão na década de 90 até aos mais recentes sobre países da OCDE (nomeadamente Portugal). Vários autores estudaram este tema sendo o mais conhecido Caballero et al. (2008). Primeiro foi usado a ideia de Caballero et al. (2008) sendo aplicada a fórmula simplificada de McGowan et al. (2018).
O presente estudo mostra que, entre 2010 e 2018, na economia portuguesa temos empresas zombies seguindo uma análise menos restrita e outra mais restrita. Na primeira, em média, durante os anos de analise temos cerca de 12.8% enquanto que na segunda este número diminui para 7.4%.
Na análise menos restrita foi somente tomado em consideração o facto de a empresa ter, pelo menos, 10 anos de idade para remover da análise as novas empresas (start-ups, por exemplo) e a taxa de cobertura dos juros ser inferior a 1 por, pelo menos, 3 anos consecutivos. Na mais restrita, foi implementado a anteriores rácios financeiros tais como: o retorno sobre o Ativo e o rácio total da divida. Foi também confirmado recorrendo aos modelos Mínimos Quadrados Ordinários, Efeitos fixos e Efeitos aleatórios e, ainda, um modelo Probit, que as empresas zombies tendem a estar relacionados com setores específicos da economia, com certas zonas do país e o seu tamanho (número de empregados). Estas empresas zombies tem implicações significativas nas empresas saudáveis a operar no mesmo setor, reduzindo o emprego e a margem de lucro.
Palavras chave: capital, emprego, empresas zombie, endividamento, financiamento, rácios financeiros Classificação JEL: E22; E24; G32; G33; O16.
vi
Fear the walking dead: the epidemic of zombie firms in Portugal
Abstract
This study explores firms called “zombies” in the Portuguese economy. These firms are defined as old firms and have persistent problems in paying interest on bank loans and sidetrack labor productivity from healthy companies.
The theme of zombie firms has been analyzed from the case of Japan in the 1990s to the most recent on OECD countries (i.e. Portugal). Several authors have studied this theme, the most well-known being Caballero et al. (2008). First the idea of Caballero et. al (2008) being applied, then the simplified formula of McGowan et al. (2018) was used to compute the regression.
The present study shows that, between 2010 and 2018, in the Portuguese economy we had zombie firms following a less restricted and a more restricted analysis. In the first, on average, during the years of analysis we have about 12.8% while in the second this number decreases to 7.4%.
In the less restrictive analysis, firms need to be, at least, 10 years old to remove bias using newest firms (for example start-ups) and the interest coverage rate is less than 1 per cent. for at least 3 consecutive years. In the more restrictive, it has been implemented to previous financial ratios such as: Return on Assets and the total debt ratio.
It was also confirmed by using Ordinary Least Squares, Fixed Effects and Random Effects models, as well as a Probit model, that zombie companies tend to be related to specific sectors of the economy, certain areas of the country and their size (number of employees). These zombie companies have significant implications for healthy companies operating in the same industry, reducing employment and profit margin.
Keywords: capital, employment, financial ratios, financing, indebtness, zombie firms JEL Classification: E22; E24; G32; G33; O16.
vii
Index
Acknowledgments ... iii Resumo ... v Abstract ... vi List of Tables ... ix List of Figures ... xList of abbreviations and acronyms ... xi
1.Introduction ... 1
2. Macroeconomic Situation of Portugal ... 3
3. Literature Review ... 7
4. Theoretical framework and hypotheses ... 10
5. Data ... 13
6 – Methods ... 15
6.1. – Ordinary Least Squares ... 16
6.2. – Fixed Effects Model ... 17
6.3. – Random Effects Model ... 17
6.4. – Hausman Test ... 18
6.5. - Probit Model ... 18
7. Empirical findings ... 19
7.1. Profile of Zombie firms ... 19
7.2. Regressions used ... 20
7.3. Less restrictive analysis ... 21
7.4. More restrictive analysis ... 25
7.5. Discussion of results ... 29
viii References ... 33 Appendix ... 36
ix
List of Tables
Table 1 - Number of zombies in Portugal (less restrictive) ... 21
Table 2 - Zombie firms and non-zombies’ performance ... 23
Table 3 - Number of zombies in Portugal (restrictive) ... 26
Table 4 - Zombies firms and non-zombies’ performance ... 26
Table 5 - Firms in the Portuguese economy from 2010 until 2018 ... 36
Table 6 – NUTS 2 distribution in the Portuguese economy ... 36
Table 7 – NUTS 3 distribution in the Portuguese economy ... 36
Table 8 - NACE code and description ... 37
Table 9 - NACE distribution in the Portuguese economy ... 38
Table 10 - Number of employees in each firm ... 38
Table 11 - Probit model ... 39
x
List of Figures
Figure 1- Interest rates on new loans (annual average) to firms in Portugal ... 3
Figure 2 - Amounts of loans granted to firms in Portugal ... 4
Figure 3 - Births, Deaths and Survivors firms in Portugal... 5
xi
List of abbreviations and acronyms
AML – Área Metropolitana de Lisboa AMP – Área Metropolitana do Porto BvD - Bureau Van Dijk's
EBIT - Earnings Before Interest and Taxes
EFAP - Economic and Financial Assistance Program EU - European Union
FE – Fixed Effects
GDP - Gross Domestic Product IFO - Institute of Economic Research IME - International Monetary Fund INE - Instituto Nacional de Estatística
NACE - Statistical classification of economic activities in the European Community NUTS - Nomenclatura das Unidades Territoriais para Fins Estatísticos
OECD - Organization for Economic Cooperation and Development OLS – Ordinary Least Squares
RE – Random Effects ROA - Return On Assets
SCIE - Sistema de Contas Integradas das Empresas SME - Small and Medium Enterprises
UK - United Kingdom US - United States
1
1.Introduction
Throughout the world there is a facility to obtain credit with low interest rates, thus creating several factors that make it possible for uncompetitive firms to remain in the market. The president of the Institute of Economic Research (IFO), Clemens Fuest said: “The zero-interest rate policy is certainly helping companies, which would have to file for bankruptcy with higher interest rates, stay on the market” creating a problem to the development of productivity firms. Additionally, “The problem of zombie companies and banks is still serious. Especially in Greece, Italy and Portugal, the proportion of bad loans in bank balances is still far too high”.
Hereupon, Portugal has had, since the XXI century, low levels of economic growth. According to Blanchard and Portugal (2017), Portugal has gone through a boom, a slump, a sudden stop, and now a recovery. Besides this recovery, Alexandre et al. (2017) points out the existence of a large number of zombie firms. Zombie firms are difficult to explain in a sense that, we have some authors that use a simplified form to calculate the number of zombie firms, for example, firms with negative profits, and some more restricted authors that look at the age of the firms, if they receive subsidized credit, etc. Zombie firms are indebted businesses that, although generating cash after covering running costs and fixed costs, they only have enough funds to service the interest on their loans, but not the debt itself. As such they generally depend on their creditors, mainly banks, for their continued existence, effectively putting them on never-ending life support.
The major consequences of the permanence of these firms in the market could be: i) they affect negatively the economic growth of the country in which they are inserted; ii) somehow prevent the entry of new firms that can be more efficient and innovated; iii) create solvency problems for the banks to which they are associated; iv) among others.
This question is relevant for the Portuguese economy because it has a higher number of zombie firms (see Figure 2; McGowan et al. 2018) and to fight that number we must have policies to reduce the share of capital sunk in zombies, reallocating that capital to more productive firms or reviving those weak firms. To do this, policymakers must know how those firms got into debt.
2 That said, based on the literature review present in this work, zombie firms will be analyzed in the Portuguese market between 2010 and 2018. It would be better to do an analysis with a range containing the period of the 2008 crisis but there is a lack of data in the database. Also, the Economic and Financial Assistance Program (EFAP) and the agreement between Portugal, the European Union (EU) and the International Monetary Fund (IMF) to monetarize the economic situation of Portugal- agreed in 2011 until 2014 may be biased because it is an atypical period in the Portuguese economic. Therefore, it is much more interesting to analyze over a long period of time.
Thus, to explore the formation of a zombie firm, an econometric model will be used based on the formula presented from Caballero, Hoshi and Kashyap (2008) with some insights provided from McGowan et al. (2018). At this stage we can observe the number of zombies in Portugal based on simple variables. After that analysis, using a probit model, an examination of the number of zombies accordingly to several points of view will be done. For instance, variable Y will be if they are zombies or not. Then, it will be observed the percentage of a zombie firm possibly being an exporter and zombie or be from the construction sector and zombie also.
The purpose of this work is to, first of all, define zombies firms according to the literature then adding financial rations then, how much did the financial crisis and the EFAP contributed to the raise/reduce of the zombie firms. To sum up, it will be shown and determinate the number of zombies according to the main activity and the region according to the NUTS.1
The remainder of the dissertation is organized as follows. In the second part, it is provided a macroeconomics situation of Portugal regarding some indicators that are relevant to the analysis of zombies. Part three presents the relevant literature about zombie firms and some financial ratios. In part four, it is presented the regression model describing the variables used. Following, we have part five that describes the data and in part six, the methods used, such as, Ordinary Least Squares, Fixed effects, Random effects, Hausman test and the Probit model. After that, the empirical results are presented, as well as the discussion about the results for the less restrictive and more restrictive model. Finally, in part eight, the main conclusions of the dissertation and some suggestions for future research can be found.
3
2. Macroeconomic Situation of Portugal
To explain why Portugal can have a higher number of zombie firms it is necessary to demonstrate how the country is at the macroeconomic level. As mentioned before, the interest rate and the credit conceded to firms may influence if they are or are not zombie firms. Also, the births and deaths of firms as well as their number of employees may influence the number of zombies in Portugal.
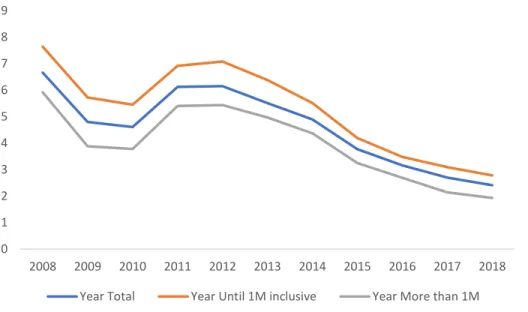
Figure 1- Interest rates on new loans (annual average) to firms in Portugal
Notes: The orange line is the total; the blue line is the average to firms that receive up to 1M euros inclusive; the grey line is the average to firms that receive more than 1M euros in credit.
Source: pordata.pt 2018, Bank of Portugal, PORDATA
As we can see in figure one, the interest rates on new loans decrease since 2008 (the highest value being around 8%) till 5.5% in 2010 but had a small increase right after until 2012. After that and because of the EFAP, the rates decrease until 3% in 2017. According to the literature, during periods of low (high) interest rates on loans, it is increased (decrease) the permanence of weak firms in the market. Also, the amount of money granted to firms in Portugal between 2008 and 2017 can explain the number of zombies according to recently literature (Borio and Zabai 2018) which has focused on the possible impact of low interest rates. Also, Ian Stewart, Deloitte’s Chief Economist in the UK, said that “These are weak, possibly loss-making companies, which are able to survive thanks to low interest rates (...)”. When observing the impact of interest rates in zombie firms, it is important to notice that interest
0 1 2 3 4 5 6 7 8 9 2008 2009 2010 2011 2012 2013 2014 2015 2016 2017 2018
4
rates only respond to the performance of the economy. For example, low interest rates do not cause by themselves weak earnings growth, it is the slothful economy that erodes the profitability of the firms.
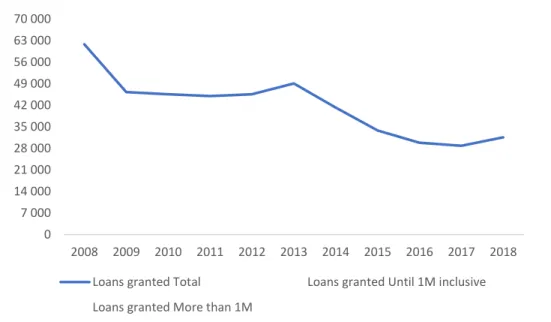
Figure 2 - Amounts of loans granted to firms in Portugal
Notes: The blue line is the total of loans granted; the grey line are loans up until 1M euros inclusive; the orange line are loans higher than 1M euros.
Source: pordata.pt 2018, Bank of Portugal, PORDATA.
This second figure show us that loans are decreasing since 2008 as expected with a slight raise in 2013. It is important to see the difference between small loans (up to 1M euros) and big loans (higher than 1M euros). The small loans remained almost the same during the period of analysis and bigger loans had a rise in 2013 but declined faster than smaller loans in 2014. So, we can conclude that, big loans had a much more significant impact on the Portuguese economy than small loans. Since the literature review pointed us that SME has many zombie firms, we can conclude that the fact that the loans do not diminish can justify why they are zombies and are still on the market.
0 7 000 14 000 21 000 28 000 35 000 42 000 49 000 56 000 63 000 70 000 2008 2009 2010 2011 2012 2013 2014 2015 2016 2017 2018
Loans granted Total Loans granted Until 1M inclusive Loans granted More than 1M
5 Figure 3 - Births, Deaths and Survivors firms in Portugal
Notes: The blue line is firms’ births; the orange line is firms’ deaths; the grey line is firms that survived 1 year after they enter the market; and the yellow line is firms that survived 2 years after they enter the market.
Source: pordata.pt 2018, Bank of Portugal, PORDATA
In the third figure we can see that, in terms of firms’ births, Portugal has had, after the 2008 crisis, the number of births decrease around 60.000 until 2012, in which these births increased again. This can be a sign of the lower interest rates and the rise of loans as shown before. The firms’ deaths reflect what is verified in the births of companies, in the sense that, if the number of births increases, the number of deaths increases. However, between 2008 and 2012 there was a greater number of deaths than births. Currently the numbers are very close. Also, in this figure, we can observe the firms that survived at least 1 and 2 years after entering the market. Unsurprisingly, firms that enter the market tend not to survive for long, and it is curious that about half of the firms created in the previous two years are not in the market in the following years. This is an important point related to zombie firms because since zombie firms may, sometimes, exit the market, the number of firms’ deaths should be sometimes higher than it is shown.
Even though is not shown, conclusions about insolvent and in recovering firms can be given. According to a study from a credit and risk management consultant (“InfoTrust”), Portugal had in 2018 almost twice the closing of firms’ comparative to the previous year, having the insolvency and recovering firms a decrease. This may be a sign that firms are surviving thanks to subsidized bank credit.
0 30 000 60 000 90 000 120 000 150 000 180 000 210 000 240 000 2008 2009 2010 2011 2012 2013 2014 2015 2016 2017
6 Figure 4 - Number of employees: Total and by firm size
Notes: The blue line is total firms in Portugal; the orange line is SME; and the grey line is big firms. Source: pordata.pt 2018, Bank of Portugal, PORDATA
Finally, this last figure shows us that, in Portugal, the number of employees in total firms in Portugal decreased since 2008 until 2013, raising again to number close to the 2008 period. Between SME and big firms, we can see that SME had the biggest impact on the decrease of number of employees and big firms maintain the same along the period of analysis. Also, it is interesting to see that SME firms dominate the market in relation to big firms, which is a characteristic known of the Portuguese economy. As said before and according to the literature revision, SMEs had a big impact on the number of zombies harming the labor market, so this is also a reason for the Portuguese economy having so much zombie firms in relation to other countries in the European Union.
0 500 000 1 000 000 1 500 000 2 000 000 2 500 000 3 000 000 3 500 000 4 000 000 4 500 000 2008 2009 2010 2011 2012 2013 2014 2015 2016 2017
7
3. Literature Review
The impact of zombie firms is a big deal to the economy of a country, so the study and the comprehension of the way that healthy companies evolved into zombies is an important topic to study in Portugal, since we have a large percentage of zombies, and it is contained in the OECD research program.
The phenomenon of zombie firms began in the early 90’s with the collapse of the Japanese asset price bubble, while there was a period of stagnation of Japanese firms known as the “lost decade”. These firms distorted the market and caused significant interruptions in the economy’s recovery. Curiously, few were the firms that declared bankruptcy, and many of them recovered at the beginning of the 21st century. According to Fukuda and Nakamura (2001), reducing the employee strength and selling fixed assets were beneficial for reviving zombie firms. Also, external supports including debt relief and capital reduction were the other important factors for the recovery of these firms.
The study from Hoshi and Kashyap (2004) was one of the first to alert to this type of firms, saying that the size of bad loans in Japan was around 7% of GDP. That said, Caballero et al. (2008), one of the most important paper regarding zombie firms, tried to identify these firms based on whether they are receiving subsidized credit, not by looking at their productivity or profitability. Also, they struggle to obtain the data necessary to study this theme mainly because banks and the borrowers aren’t available to provide the raw data that allows the them to determine if they are or not a zombie firm. That said, the study from Caballero et al. (2008) concluded that if banks let zombie firms alive, they hinder efficient human resource allocation and channel the investment from viable firms to unviable ones. When these unviable firms go through a low performance phase, banks tend to provide more credit to them mostly when they work together forming a type of alliance smoothing (in Japan we can see the keiretsu alliance) the access to credit.
Lam, Schipke, Tan and Tan (2017) is a study accomplished by observing firms in China, identifying the zombies, and explains the central role that these firms have with state-owned enterprises aligned to low productivity and higher debt. The government had tried various reforms to reduce the
8 deleveraging but with no success. The empirical results of this papers suggest that, to accelerate the restructuring process, it requires a more holistic and coordinated strategy, recognizing losses, reducing the implicit support and liquidating zombie firms.
Recent studies have studied zombie firms in the context of the European Union, such as McGowan et al. (2018), defining these firms as those that have, at least, ten years old, excluding start-ups, and those that ca not cover the interest payments for, at least, three consecutive years. Also, this paper restricts the sample to the pre-crisis period (2003-2007) finding that an increase in zombie share at the industry level is associated with lower investment and employment growth for the average non-zombie. So, the resources trapped in zombie firms was a policy issue already before the crisis that is, today, not solved.
In the case of Portugal, those studies told us that, on average, zombies are older, larger (both in terms of number of employees and turnover) and are much less productive than their non-zombie counterparts (Gouveia and Coelho, 2018). McGowan et al. (2018) also shows the share of capital sunk in zombie firms in 2013, and in terms of international comparison, Portugal has around 14%, much more than France (around 6%) or the United Kingdom (around 7,5%). These numbers are decreasing, and it is good for the economy as shown in Osterhold and Gouveia (2018), in which a reduction in the capital sunk in zombie firms fetches positive externalities to non-zombies.
Previous papers studied the factor of indebtedness of some Portuguese firms from 1990 to 1995 and found out that the growth of a firm has a positive relation with the indebtedness, which means that the firms with higher asset growth rates are the ones that are more indebted (Jorge and Armada 2001).
Storz, Koetter and Setzer (2017) studied, between the years of 2010 and 2014, (post crisis and when Portugal had the (EFAP), the impact of bank stress on the deleveraging process of non-financial small and medium-sized enterprises denominated SMEs, focusing their work in the euro area with two groups: the first one includes Portugal, Greece, Ireland, Spain and Slovenia called by the author “the periphery euro area”, and the second denominated “euro area core” with France and Germany. They concluded that the interaction between the week SMEs and weak banks is a possible cause of misrepresentation in the deleveraging efforts of euro area periphery economies. For the same year,
9 France and Germany had no significant impact of bank stress on zombie firm leverage suggesting that non-financing corporations deleveraging is indeed associated with weak banks, possibly because these banks have an incentive to keep these firms alive (evergreen loans) to avoid having to declare non-performing loans.
Another recent research conducted by OECD, the main financier of the zombie firms are weaker banks, suggesting that the zombie firm problem may partly stem from bank forbearance (McGowan et al. 2017). Also, Oliveira (2008) said that “the principal form of external financing is through the use of the banking system (…)”, but some authors concluded that the owners themselves also invest in their business. This type of bank forbearance happens when banks seek to avoid recognition of the loss of credit granted to suck companies (Alexandre et al., 2017).
The economic and financial analysis of a firm is a toll that allows, according to Cardoso Moreira (2001), to know the situation of a company through its past and anticipate future situations, so policy makers should be aware of this phenomenon because it can condition the country’s economic development, and some economist such as Langfield and Pagano (2015), concluded that an increase in the size of the banking system is associated to more risk and less economic growth.
10
4. Theoretical framework and hypotheses
As mentioned before, the literature characterizes a zombie firm as those with more than a decade of existence, that do not generate enough revenues in their regular business, persistently dependent on bank credit and those who usually pay high salaries considering the productivity of the sector in which they work.
Firstly, to define a zombie firm, it was firstly tried to use the initial idea in the Caballero et al. (2008) where they define zombie firms as those potentially receiving subsidized bank credit and not by looking at their productivity or profitability so that we can evaluate the effect of zombies on the economy. To do this they observed interest payments made by the firm comparing them to an estimated benchmark R* based on the firm debt structure and market interest rate. Those firms with negative interest rates are receiving subsidized credit and are zombies. But the study from Caballero et al. (2008) is very data demanding with a dataset that covers the period from 1981 to 2002, reaching, some years, to 2500 firms. Also, we cannot precisely distinguish between different forms of debt held by companies in our database, such as bank loans and debt securities issued. Therefore, we also cannot observe actual interest payments on different forms of debt. Observable overall interest expenses may not necessarily show the actual payments during a certain year.
Knowing the previously present difficulty, McGowan et al. (2018) define zombie firms based on a simplified formula from Caballero et al. (2008) adding, to the definition of the interest coverage ratio, a criterion to the age of the firm. In Amadeus, we have the date of incorporation for each firm so doing basic computations we got only firms that have only ten years or more in the market. That said, a zombie must have an interest coverage ratio less than one for three consecutive years. Initially, the level of EBIT is observed and divided by the interest paid by firms. This will give us the interest coverage ratio and if it is lower than one for three consecutive years we can say, in practice, this means that a firm must take on additional debt to cover its interest payments.
It is typical to identify zombies based on a single weak performance metric, but this easily includes firms who are growing and whose weak profitability is often temporary. For example, investment involves a necessary trade-off between short term costs and future productivity and profitability growth, which may cause performance metrics to supposedly decline before revenue
11
catches up. Start-up companies are particularly vulnerable to this. So, they used the age of the firms to differentiate a real zombie from an innovative start-up who may still have comparatively high operating costs and low revenue but since this database doesn’t have how long firms had been on the market, we can’t differentiate zombies’ firms from start-ups.
After that, the empirical framework uses pooled cross-section micro data to explore the distortionary effects of zombie firms on the performance of non-zombie firms. That said, on the regressions non-zombies should have also ten years but the interest coverage ratio higher than one for three consecutive years and the following financial ratios.
Following Schivardi et al. (2017) a criterion of total debt to total assets ratio, also known as, total debt ratio will be implemented and if a firm has a value lower than 40% it would be considered a non-zombie (being tested with other ratios as well to see the impact in the number of zombies).
Thirdly, it will be used the Return of Assets (ROA) to analyze the profitability (or “quality”) of the firm to replace Tobin’s q, as mentioned on Miyajima and Yafeh (2007). Tobin’s q is used to express the relationship between market valuation and intrinsic value, in other words, it is a means of estimating whether a given firm or market is overvalued or undervalued. The use of ROA is similar to Tobin’s q because it tells investors an idea of how effective the firm is in converting the money it invests into net income, so the higher the ROA, the better, because more money is made with less investment.
Summing up, a firm is considered a non-zombie, whenever they have the interest coverage ratio higher than one for, at least, three consecutive years; have more than ten years in business, the total debt ratio is lower than 40% and the ROA is higher than 0. Our non-zombie dummy is thus equal to 0, whenever the firm fulfills criteria all these criteria for the current period, and 1 otherwise.
Following the specification in Caballero et al. (2008) and McGowan et al. (2018), we test whether zombies entail negative spillover effects on viable firms. We depend on panel data from 2010 to 2018 to estimate a reduced-form equation to see the impact of zombie congestion as:
𝑌𝑖𝑠𝑡 = 𝛽0+ 𝛽1𝑛𝑜𝑛𝑧𝑜𝑚𝑏𝑖𝑒𝑖𝑠𝑡+ 𝛽2𝑛𝑜𝑛𝑧𝑜𝑚𝑏𝑖𝑒𝑖𝑠𝑡∗ 𝑍𝑠𝑡+ 𝛽3𝑟𝑒𝑣𝑒𝑛𝑢𝑒𝑖𝑠𝑡+ 𝛽4𝑠𝑖𝑧𝑒𝑖𝑠𝑡+ 𝜀𝑖𝑠𝑡 (1)
12
Where Y denotes the profit margin and employment growth of firm i, in industry s, at year t. The dummy nonzombie takes the value of 1 for non-zombie firms and 0 otherwise. This variable is defined as shown before whenever the firm fulfills all four criteria. Z is the share of industry capital sunk in zombie firms. With the variable of 𝛽3 it is possible to see the impact of sales in the regression. The variable β4 is a firm control variable, so it is a dummy variable that defines the size of the firm (1 to 10,
11 to 19, 20 to 49, 50 to 99, 100 to 249 and 250+) in terms of employment.
It is expected that 𝛽2will be negative, implying that more resources are sunken in zombie firms, for the profit margin and employment growth since zombie firms reduce the ability and capital for nonzombie firms to grow. As well, 𝛽1 may be negative if zombie firms receive large amounts of subsidized credit but, it’s shown in the literature that it could be positive due to zombie firms not being able to spend as much as healthy firms.For the dummy variable of size, a raise in the number of employees the higher is expected to be the number of zombies. Operating Revenue may also influence the capital and employment growth and should tell us if the firm is doing good in term of sales or if they just receive the subsidized credit.
13
5. Data
In the literature (see Caballero et al 2008; McGowan et al. 2018; Alexandre et al. 2017), it has been observed that the survival of zombie firms may distort competition and weaken market efficiency. Healthy markets are characterized by a process of creative destruction, where insolvent or unprofitable firms reduce their share of labor and successful firms invest and create new jobs. When zombies participate in the market, they raise demand for labor and intensify competition for market share. This has the consequence of lowering product prices and increasing wages, effectively congesting growth conditions for more promising firms.
To define a zombie firms, several criteria are used, from least restricted to the most restricted. As said before, this study will primarily use the Caballero et al. (2008) formula and the simplest form used by McGowan et al. (2018) with the addition of others financial variables, using available information to determine which firms are receiving subsidized credit using firm-level data from Bureau van Dijk’s (BvD) Amadeus database. This is a database of comparable financial information for public and private companies among countries in Europe. The purpose of using this database is that it encompasses data from Portuguese companies with significant relevance to the business and from financial ratios that are routinely used in the financial analysis of companies. Also, this database is in panel data and has the period which will be analyzed (2010-2018). It would be better if we could use the Sistema de Contas Integradas das Empresas (SCIE) from the Instituto Nacional de Estatística (INE) but due to some restrictions it was not possible to use.
The only problem in this period is that it coincides in a substantial part with the Economic and Financial Assistance Program (EFAP) that occurred in Portugal between 2011 and 2014, after the worldwide crisis of 2008. Also, not analyzing the period before 2008 is a big shrinkage because we don’t observe what happened in a good economic period. Thus, in addition to a short period of time (8 years of analysis), it is an atypical period, in which economic activity is extraordinarily retracted. Nevertheless, as said before, it would be interesting to analyze the impact of the EFAP in the context of zombie firms, but a longer period of dataset would be necessary.
Another important point of this database is that it analyzes births and deaths of companies as well as demographic indicators. For the current year, the population is constituted by all the companies
14
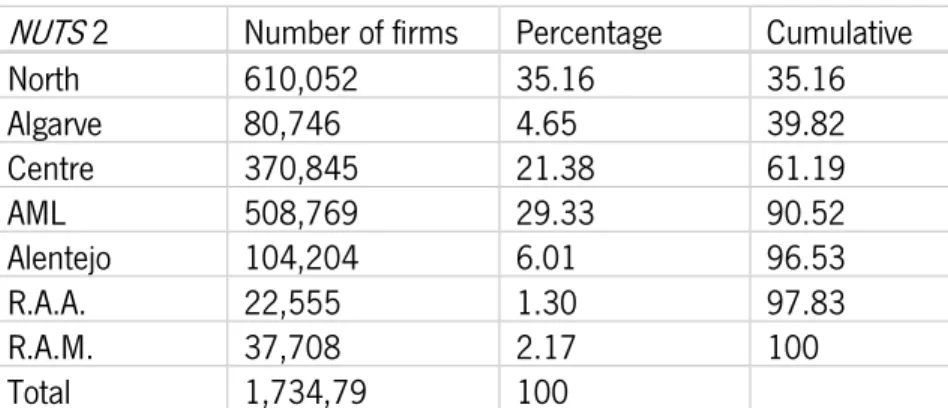
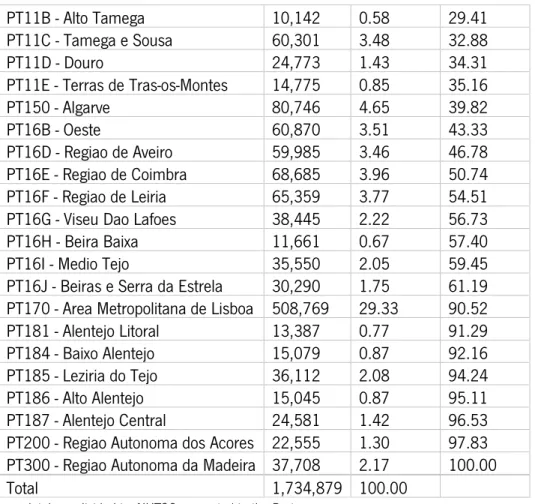
that carry out an activity of production of goods and/or services, in Portugal. In addition, the database has information to be able to perform a dimensional analysis of each firm, along with a sectorial analysis in which firms will be divided by seven regions according to NUTS 2 and twenty-five regions according to NUTS 3.
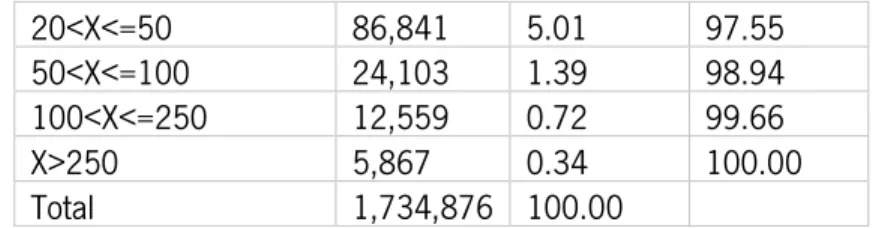
To study the dimension of the firm, this study will have five size classes that are: firms with less than ten employers, firms with less than fifty employers but over than ten, firms with less than one hundred but over fifty employers, firms with lower than two hundred and fifty employers but over than one hundred and big enterprises with over two hundred and fifty employers. This size of the firms was made accordingly to Alexandre et al. (2017) and according to a variable available in Amadeus (It should be noted that this variable is according to the European Union classification based on total assets and operating revenue). For the sectorial analysis it will be divided by letters according to the sector in question, i.e. each letter will represent a sector of activity with a total of seventeen sectors.
Using the data available in Amadeus, a set of 378,887 firms was obtained for Portugal but after some restrictions and adjustments the number was reduced to 245,015 mainly due to missing values. To better explain this decrease in the number of observations, it’s computed in Stata that, if important financial variables are missing, such as, total assets, capital, profit or EBIT, the firms are removed. This command, for example, to the year of 2010 decreases the number of firms from the 378,887 to 194,237. Another point is, if the firm has more than 7 variables missing (the maximum is 11) it gets removed (in this point, for the year of 2010 we have 191,151 firms). Other restriction was if the firm has years missing, this means if the firm have reports for 2010 and 2012 but misses the year of 2011, it will get 1 (equals to 1 year missing) until the maximum that is 9. At this stage we can notice more firms dropped in the earlier data such as 2018, 2017 and 2016. (for example, in 2017, previously we had 314,198 firms and now only 259,654 firms). This can be explained because, in Portugal, firms tend to report the year n in the n+1 year or, in some cases, they send wrong data and the regulators ask to correct this. Then firms that do not have recent year data (2018) are deleted. Finally, we have our database ready to the analysis with an increase in the number of firms since 2010, from 153,795 to 219,749 in 2018. This can cause a problem in the analysis since it was not possible to verify the real reason for this decrease (see Table 5 on appendix).
15
As mentioned before, an analysis was performed according to the NUTS 2 and NUTS 3 in which it was verified, according to the first one that 34.53% of the firms reside in the North, 30.27% in the metropolitan area of Lisbon and 21% in the central zone of the country. The remaining 14.2% are distributed almost equally between the Algarve, Alentejo and autonomous regions (Madeira and Azores). According to NUTS 3, we can observe in more detail that the areas to the north of the country, as to be expected, 18.22% of the firms are in the metropolitan area of Porto. Also, it is worth noting that the area of the Ave and Cavado have 4.10% and 4.14% respectively (see Table 6 for NUTS 2 and Table 7 for NUTS 3 on appendix).
Another information that this database has is that, according to the NACE code (see Table 8 on appendix), we can witness which sector has more impact in the Portuguese economy. Observing NACE distribution extracted from the data, it can be said that sectors G (wholesale and retail trade), C (manufacturing) and F (construction) have the highest impact, respectively, in the Portuguese economy. According to the literature, the sectors with more zombie firms are services and construction. In this study, the data indicates that the same sectors will have more zombie (see Table 9 on appendix).
In terms of firms size, it is expected according to the literature review, 85.2% of firms have less than 10 employees, 7.4% of firms have less than 20 employees but more than 10, 5% of firms have less than 50 employees but more than 20, 1.4% of firms have less than 100 employees but more than 50, 0.7% of firms have less than 250 employees but more than 100 and 0.3% of firms have more than 250 employees. That is, a large part of the database focuses on small firms that have specific characteristics, such as missing values, at the level of sales, purchases, loans, etc. In the literature, authors have a much larger sample of small firms than big firms. As mentioned previously this will bring problems for the analysis that will be carried out, but on the other hand, the study could focus on small and large firms from different sectors in the Portuguese market (see Table 10 on appendix).
6 – Methods
As mention previously, it will be analyzing the firms in Portugal. To do so, panel data is used in order to observe the behavior of these firms over time. According to Baltagi(1995), this technique allows us to use more observations, contributing to a greater variability of data, less collinearity between
16 variables, increase in the number of degrees of freedom and greater efficiency of the estimated model. That is, panel data has advantages because provide the possibility to include variables from different levels of analysis.
6.1. – Ordinary Least Squares
In order to explain the impact of our variables previously described, it is used the OLS model (Ordinary Least Squares) since the goal is to see the relationship between the independents variables to a dependent one. However, this dependent variable may be biased due to endogeneity, this means that Cov(X,u)≠0. In this case, the estimates obtained by OLS model do not reflect the causal effect that we want on the dependent variable, since the independent variables capture some of the effects that would otherwise be attributed to missing variables. Also, this model can have other fragility in a way that, when a model is estimated by OLS we are assuming that the variance of the error terms is constant (homoscedasticity) and when this do not verify, we are facing a problem of heteroscedasticity. There are several methods for detecting heteroscedasticity, but it will be used the White test due to the large sample being analyzed.
The homoscedasticity of the residuals is explained by:
𝐸(𝜀𝑖2) = 𝜎2 i=1,2,…,n (2)
where the conditional variance of 𝑌𝑖 increases as a given independent variable increases, for example, the variation of 𝑌𝑖 is not the same. As this variation of the residue is conditioned to 𝑌𝑖 then there is the presence of heteroscedasticity, where:
𝐸(𝜀𝑖2) = 𝜎𝑖2 (3)
Since the panel data combine cross-section information with time series it is used, to estimate the model (1), the OLS model (if all variables are observed, this model produces consistent estimates), Fixed Effects model(like the OLS, assumes that covariance between unobserved heterogeneity and all regressors is null. If this happens, this model produces efficient estimates, but if it is not null, both OLS and RE produce biased estimates and inconsistent as a result of missing variables) and the Random Effects model (to check the variation is assumed to be random and uncorrelated with the independent variables present in the model) (see Greene, 2002).
17
6.2. – Fixed Effects Model
We use Fixed effects whenever we want to analyze the impact of variables that vary over time. This model explores the relationship between predictor and outcome variables within a firm (it can be any entity such as country, person, etc.). Each firm has its own individual characteristic that may or may not influence the predictor variables. So, we assume that something within the individual may impact or bias the outcome variables, so we need to control for this. Fixed effects remove the effect of those time-invariant characteristics so we can assess the net effect of the predictors on the outcome. This only makes sense to apply a Fixed effects model if there are specific effects of the firms, so we should apply an F test for the present of the fixed effects. Thus, if the null hypothesis is rejected, there is no heterogeneity and we can use this model. This can be expressed as follow:
𝑌𝑖𝑡 = 𝑋𝑖𝑡𝛽 + 𝛼𝑖+ 𝜀𝑖𝑡 (4)
Where the X contains covariates that are invariant, 𝛼𝑖 unobserved individual level effects over time (fixed effect) and 𝜀𝑖𝑡the error term. Our worry is that Cov(𝑋𝑖𝑡, 𝛼𝑖) ≠ 0, that is that some unmeasured
variable is correlated with one, or even more, of the explanatory variables causing a bias in the analyze. Even if only one variable is endogenous all parameters can be biased.
6.3. – Random Effects Model
In the Random effects model the random error term consists in two components(𝛼𝑖 + 𝜖𝑖𝑡) that represents all factors that may influence the dependent variable but are not included in the model.
𝑌𝑖𝑡 = 𝑋𝑖𝑡𝛽 + 𝛼𝑖+ 𝜀𝑖𝑡 (5)
In addition, there is no auto correlation in the error term and there is no correlation with the explanatory variables in the model which allows for time-invariant variables to play an important role as explanatory variable. So, if we have reason to believe that differences across firms have some influence on the dependent variable then this model should fit perfectly. So, to decide what to choose, between the FE and the RE, we should be aware that:
Cov(𝑋𝑖𝑡, 𝛼𝑖) ≠ 0 , we may choose the random effects model. Cov(𝑋𝑖𝑡, 𝛼𝑖) = 0 , we should choose the fixed effects model.
18
6.4. – Hausman Test
So, after seeing what fixed and random effects models an inevitable question appears: which should be used? From a purely practical position, the dummy variable approach is costly in terms of degrees of freedom lost. On the other hand, the fixed effects approach has one considerable virtue. There is little justification for treating the individual effects as uncorrelated with the other regressors, as is assumed in the random effects model. The random effects treatment, therefore, may suffer from the inconsistency due to this correlation between the included variables and the random effect. (see Hausman and Taylor 1981).
Then a Hausman test is used to test which model should we used. The test is based on the idea that under the hypothesis of no correlation the OLS are consistence but inefficient. Therefore, under the null hypothesis the RE model is preferred vs the alternative FE model. It basically tests whether the unique errors are correlated with the regressors, the null hypothesis is they are not.
6.5. - Probit Model
A probit model or probit regression, is a way to perform regression for binary outcome variables (dummy variable). So, the dependent variable Y can either take the value of 1 or 0.
𝑌𝑖𝑡 = {0, 𝑖𝑓 𝑌𝑖
∗ < 0
1, 𝑖𝑓 𝑌𝑖∗ ≥ 0 (6)
In this analysis it will be used the less restrictive model mainly because it is the model most used in the literature and the better to study specific areas such as a probit model does. Also, according the literature some industries, regions and the size of the firm were chosen in order to see the impact in Portugal of zombie firms on them.
To use the Probit model it was used the AML, wholesale and retail trade and firms with more than one employee but less than ten. This was chosen to be the primary focus mainly because it is the more relevant on the database. Also, we already saw that these sectors and size of the firms can have a higher number of zombies.
19
7. Empirical findings
7.1. Profile of Zombie firms
To start the analysis, a probit model is used to observe the zombie firms in various parameters. It is important to do this because we can observe more deeply the effect of zombies in the Portuguese context.
In this analysis it is used the less restrictive model mainly because it is the most model used in the literature and the best to study specific areas such as a probit model does. Also, according the literature, some industries, regions and the size of the firm were chosen in order to see the impact in Portugal of zombie firms on them.
To use the Probit model it was used the AML, wholesale and retail trade, and firms with more than one employee but less than ten. This was chosen to be the primary focus mainly because it is the most relevant on the database. Also, we already saw that these sectors and the size of the firms can have a higher number of zombies.
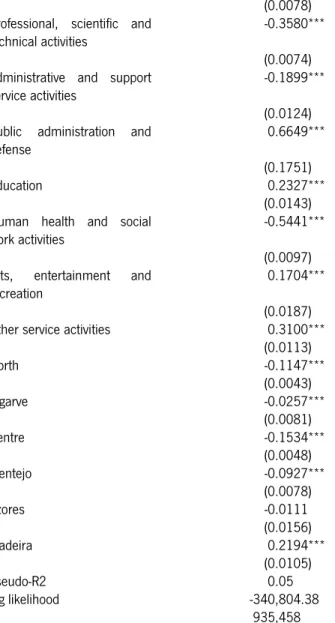
According to the size of the firm, we can see on table 11 in the appendix that, if a firm has more than 10 employees, in average it is less likely to be zombie (all size dummies have a negative sign).
Looking at the NACE category of each firm, only seven sectors tend to have more zombies than the wholesale and retail trade. These are: mining and quarrying; accommodation and food service activities; real estate; public administration; education; arts, entertainment and recreation; and other service activities. These are all sectors that can have a higher number of zombies and with this type of model we can see some high values that need attention. The literature and the experience provided by the 2008 crisis told us that real estate can have a lot of zombies and we can already see signs of that in here.
Analyzing the NUTS 2 presented in the probit model and comparing to the AML, only the Madeira region tends to have more zombies. All the others have a negative sign, so it means that they have less tendency to have zombies. To notice that, and according to the literature, the North of Portugal has the highest negative number, so it is the region with less zombies in comparison to AML.
20 On this point, it was also plotted the margin effects to measure discrete change. Marginal effects will tell us how the dependent variable changes when a specific independent variable change. As seen in the table 12 on the appendix, the margins effects are plotted so we can see the impact on the variable zombie with 935,458 observations. Regarding the size of the firm, the marginal effect raises as the number of the employees increase. This means, for example, that a zombie tends to take part of 7.8 percentual points of the firms with more than 250 employees when comparing to firms with less employees (from 1 to 10 employees). Observing the NACE distribution, we can notice again almost the same sector with high values comparting with the others. Accommodation and food services and real estate have the highest values, so zombies tend to have more presence in these sectors in comparison to the Whole sale and retail trade. Finally, the region tells us that zombies tends to be, on average, 19.5 percentual points more in Madeira region comparing to AML. All others have almost the same results.
7.2. Regressions used
In this section I will present the empirical findings for the regressions using the profit margin and employment growth as dependent variables based on McGowan et al.(2018).
So, it will be observed the impact that zombies have on a profit margin ratio, which is used to see how much percentage of sales has turned into profits by each firm. If a firm has a profit margin below 0, this means that the firm doesn’t make any profit for every dollar worth of sale, and if it is higher than 0, for example 0.3, the firm managed to generate profit worth 30 cents for every euro. This variable was chosen mainly because it is one of the most used profitability ratios to measure the degree to which a firm makes money. In this database, we have many missing values by small and medium enterprises (SME), and they also may compute profit margin at their own desired frequency, whereas large firms report it in accordance with the standard reporting timeframes, mostly annually, which leads to discrepancies between accounting periods.
The regressions explained are stated as:
𝑃𝑟𝑜𝑓𝑖𝑡𝑀𝑎𝑟𝑔𝑖𝑛𝑖𝑠𝑡 = β0 + β1nonzombieist+ β2nonzombieist∗ Zst+ β3revenueist+ β4size + 𝜂𝑖 + εist (7)
21
𝐿𝑛(𝐸𝑚𝑝𝑙𝑜𝑦𝑚𝑒𝑛𝑡)𝑖𝑠𝑡 = β0+ β1nonzombieist+ β2nonzombieist∗ Zst+ β3revenueist+ β4size + 𝜂𝑖 + εist (8)
It is expected that 𝛽2 will be negative since zombie congestion reduce the ability or incentives
for non-zombie firms to grow. The coefficient of the non-zombie 𝛽1 will be hard to understand because,
as said before, it can be either negative for some cases or positive, depending on the subsidized credit that firms receive.
7.3. Less restrictive analysis
As said before, a less restrictive criteria will be used to see how many zombies we have in the Portuguese economy. In this part, it was only used two criteria: the firms’ age (higher than 10 years) and the interest coverage ratio (less than one for 3 consecutive years).
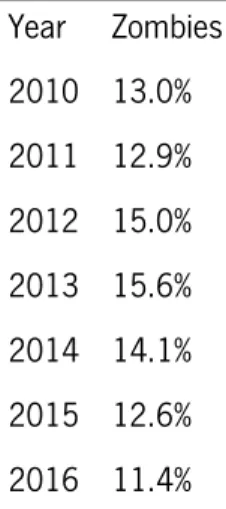
Using the Stata to compute these criteria, we got, for Portugal, an average of zombie firms, between 2010 and 2018, of 12.8% (see Table 1). Also, we can observe a decrease since 2010, from 13% to 10.8% in 2018. Also, from 2011 until 2013, the number of zombies raises in 2.7 percentual points. This can be explained mainly because of two reasons. Either these firms exited the market or had a restructuring. According to the literature, when these restrictions were used, the value of zombie firms was around 10%. As we can see, the number of zombie firms in Portugal is slightly higher than the results given by the literature. At of this is crucial to deeply analyze the zombies with some more criteria and to see whether and where zombies have more impact on the Portuguese economy.
Table 1 - Number of zombies in Portugal (less restrictive)
Year Zombies 2010 13.0% 2011 12.9% 2012 15.0% 2013 15.6% 2014 14.1% 2015 12.6% 2016 11.4%
22 2017 11.1%
2018 10.8%
Source: Author’s own calculations.
In the regressions (see Table 2) we can notice a difference in the number of observations, from 899,937 for the profit margin variable and 929,326 for the employment growth. This was a constant problem with this database because, for example, the profit margin variable has a lot of missing values in Amadeus. That said, observing the R squared, which is 21.7% for the profit margin, 21.7% of the variation can be explained by the independent variables in the model and for the Log of the employment we have a higher R squared in which this regression can explain 65.6% of the employment growth.
For the profit margin regression, the p-value for almost all variables is, approximately, 0 so since it is a low p-value (below 0.05 for 95% confidence level) this indicates that we can reject the null hypothesis. In other words, a change in the independent variable is associated with changes in the response at the population level and all variables are statistically significant. Only the size when the number of employees is between 50 and 100, we have 0.165 and for the significance level of 0.05 it is not statistically significant. For the employment growth, we only have one p-value different from 0 but it is below 0.05, so we reject the null hypothesis.
The estimated coefficients are positive for 𝛽1 and for the 𝛽2 we have a positive sign in the profit
margin regression but a (low) negative results in the employment growth. This means that we have an increase in the profit margin and employment growth when the firms are not zombie. Also, the interaction between the nonzombie firms and the share of industry capital sunk in zombies’ firms, reduces the profit margin but raise the employment growth slightly.
We can also see the impact of the dimension of the firm. According to the computations, the firms with high number of employees, ceteris paribus, translates into higher profit margin and higher employment growth. To notice that firms with fewer than 20 employees have negative signs and therefore have a negative impact on profit. The remaining firms have positive values, notably large companies (with more than 250 employees) are those with a higher coefficient value.
After that it is important to pay attention to the homoscedasticity. It is a term for designating constant variance of the errors terms for distinct observations. If the homoscedasticity assumption is not valid, we can list some effects on the model:
23 statistical inference is not valid;
2- We can no longer say that OLS is the best estimators for β, although they may still be non-bias.
Doing the White test to detect heteroscedasticity (absence of homoscedasticity), we can see that the null hypothesis of constant variance can be rejected at 5% level of significance. The implication of the above finding is that there is heteroscedasticity in the residuals. This can be due to measurement error, model misspecifications or subpopulation differences. Consequences of the heteroscedasticity are that the OLS estimates are no longer BLUE (Best Linear Unbiased Estimator). Standard errors will be unreliable, which will further cause bias in test results and confidence intervals. To solve this issue the regression was corrected by using the robust command.
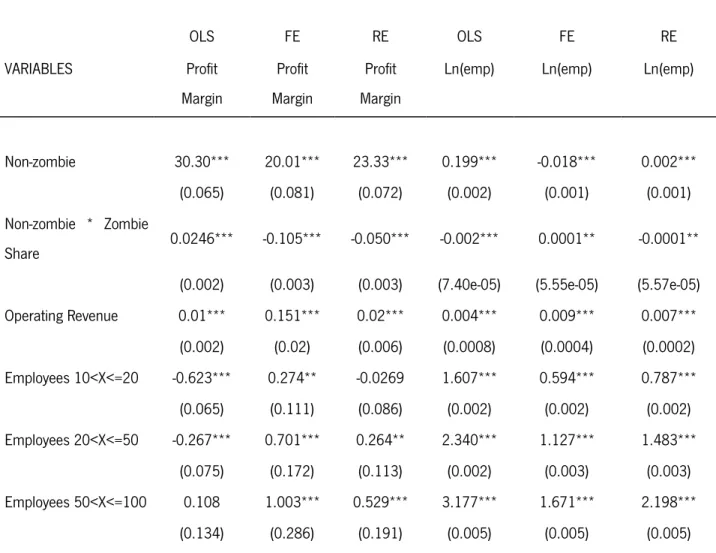
Table 2 - Zombie firms and non-zombies’ performance
OLS FE RE OLS FE RE VARIABLES Profit Margin Profit Margin Profit Margin
Ln(emp) Ln(emp) Ln(emp)
Non-zombie 30.30*** 20.01*** 23.33*** 0.199*** -0.018*** 0.002*** (0.065) (0.081) (0.072) (0.002) (0.001) (0.001) Non-zombie * Zombie
Share 0.0246*** -0.105*** -0.050*** -0.002*** 0.0001** -0.0001** (0.002) (0.003) (0.003) (7.40e-05) (5.55e-05) (5.57e-05) Operating Revenue 0.01*** 0.151*** 0.02*** 0.004*** 0.009*** 0.007*** (0.002) (0.02) (0.006) (0.0008) (0.0004) (0.0002) Employees 10<X<=20 -0.623*** 0.274** -0.0269 1.607*** 0.594*** 0.787*** (0.065) (0.111) (0.086) (0.002) (0.002) (0.002) Employees 20<X<=50 -0.267*** 0.701*** 0.264** 2.340*** 1.127*** 1.483*** (0.075) (0.172) (0.113) (0.002) (0.003) (0.003) Employees 50<X<=100 0.108 1.003*** 0.529*** 3.177*** 1.671*** 2.198*** (0.134) (0.286) (0.191) (0.005) (0.005) (0.005)
24 Employees 100<X<=250 0.987*** 1.822*** 1.364*** 3.948*** 2.241*** 2.942*** (0.181) (0.433) (0.273) (0.007) (0.008) (0.007) Employees 250<X 1.372*** 1.559** 1.351*** 5.276*** 2.913*** 3.846*** (0.267) (0.716) (0.437) (0.009) (0.013) (0.012) Observations 899,937 899,937 899,937 929,326 929,326 929,326 R-squared 0.217 0.081 0.692 0.194 Number of Firms 138,923 138,923 140,321 140,321
Notes: Non-zombie denotes firms in Portugal that are not zombies, with more than 10 years and an interest coverage ratio higher than 1 for 3 consecutive years. Zombie share denotes the capital sunk in zombie firms. Ln(emp) means the Log of the employment. Operating Revenue is represented in millions. This panel is from data collected from 2010 until 2018. Standard errors in parentheses. *** denotes statistical significance at the 1% level, ** significance at the 5% level, * significance at the 10% level.
Source: Author’s own calculations.
As stated before, two models will be used to deeply analyze this study. Firstly, it was applied in Stata the Fixed effects model to the profit margin variable to check the impact of the independent variables that can vary over time. Secondly, a Random effects model was conducted using random values. The FE told us that, by observing the p-value which is the probability that the null hypothesis for the full model is true, and since is lower than 0.05 (in this case is approximately 0) we have at least some of the parameters being nonzero. The t-values test the hypothesis that each coefficient is different from 0 and in this case, we reject the t-value for every variable because it is higher than 1.96 (for a 95% of confidence), so the variables have a significant influence on profit margin. Also, the "rho" value (0.53685) tell us that 53.7% of the variance is due to differences across panels. The rho is also known as the interclass correlation and tells how strongly the observations within each resemble each other. Another relevant value is the coefficient of the regressors regarding the size of the firm. For example, profit margin raises 2 percentual points when the firms with more than 250 employees increases by one unit.
In both, profit margin and employment growth regressions we have a f-statistic in where the null hypothesis is that all the coefficients in the model except for the intercept are zero, so:
25
𝐻0: 𝑑𝑖𝑓𝑓𝑒𝑟𝑒𝑛𝑐𝑒 𝑖𝑛 𝑐𝑜𝑒𝑓𝑓𝑖𝑐𝑖𝑒𝑛𝑡𝑠 𝑛𝑜𝑡 𝑠𝑦𝑠𝑡𝑒𝑚𝑎𝑡𝑖𝑐 vs. 𝐻1: 𝐻𝑜 𝑖𝑠 𝑛𝑜𝑡 𝑡𝑟𝑢𝑒 (9)
Since the value is 0, we reject the null hypothesis (reject 𝐻0), so this means that we have, at
least, one 𝛽 different from 0 and all independent variables (together) are statistically significant
Meanwhile the RE says that the p-value is, again, approximately 0. The two-tail p-values are all 0 and this tests the hypothesis that each coefficient is different from 0, so it can be said that all the variables have a significant influence on profit margin. The "rho" in this case is 0.429, 10.8 percentage points lower than the FE.
Using the Hausman test, we can decide therefore which model is most suitable to this analysis. That said, we have:
𝐻0: Random effects model is preferred 𝐻1: Fixed effects model is preferred
That said and observing our results we have a p-value of, approximately, 0, so we reject the 𝐻0 hypothesis.
With these results, our regressions indicate that the present of these zombies’ firms, in the Portuguese economy, may have amplified the negative consequences of the 2008 crisis but may also slow down the economy recovery by distorting the money that could went to healthy firms.
7.4. More restrictive analysis
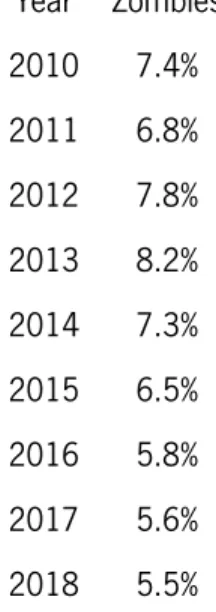
After studying the number of zombies in Portugal and doing a restrictive regression, it is important to see the impact of the financial ratios when we consider a firm to be zombie. Using the criteria described earlier in the section 4, a firm needs to fill all the criteria to become a zombie so, in this point we will have a smaller number of zombies, in average, 6.6% of total firms in Portugal.
Also, it is important to notice (see Table 3) that, as the less restrictive analysis, the number decreased from 2010, with 7.4% of the Portuguese being zombies to 5.5% in 2018, but it raises from 2011 to 2013. This cannot be explained properly but again, the fact that we have a lot of missing data, mainly in the oldest years, can influence the data.
26
Table 3 - Number of zombies in Portugal (restrictive)
Year Zombies 2010 7.4% 2011 6.8% 2012 7.8% 2013 8.2% 2014 7.3% 2015 6.5% 2016 5.8% 2017 5.6% 2018 5.5%
Source: Author’s own calculations.
In the regressions (see Table 4) we can also notice almost the same difference in the number of observations, from 899,937 for the profit margin variable and 929,326 for the employment growth. Hereupon, observing the R squared, 11.5% of the profit margin can be explained by the independent variable in this model and for the employment growth we have a higher R squared just like before, which is better, because this regression can explain 65.7% on the employment growth. The R2 is almost the
same using the more restrictive analysis.
Table 4 - Zombies firms and non-zombies’ performance
OLS FE RE OLS FE RE
VARIABLES Ln(emp) Ln(emp) Ln(emp) Profit Margin Profit Margin Profit Margin Non-zombie 0.217*** -0.011*** 0.005*** 27.15*** 13.28*** 16.89***
27
(0.003) (0.002) (0.002) (0.091) (0.098) (0.091)
Non-zombie *
Zombie Share -0.001*** -7.78e-05 -0.0002*** 0.193*** 0.112*** 0.149*** (7.16e-05) (5.17e-05) (5.21e-05) (0.002) (0.003) (0.003) Operating Revenue 0.004*** 0.009*** 0.007*** 0.015*** 0.191*** 0.026*** (0.0008) (0.0004) (0.0002) (0.003) (0.020) (0.006) Employees 10<X<=20 1.612*** 0.594*** 0.787*** 0.201*** 0.328*** 0.364*** (0.002) (0.002) (0.002) (0.069) (0.114) (0.090) Employees 20<X<=50 2.345*** 1.127*** 1.482*** 0.624*** 0.940*** 0.901*** (0.003) (0.003) (0.003) (0.079) (0.176) (0.120) Employees 50<X<=100 3.181*** 1.670*** 2.198*** 0.759*** 1.320*** 1.096*** (0.005) (0.005) (0.005) (0.142) (0.294) (0.201) Employees 100<X<=250 3.950*** 2.241*** 2.941*** 1.481*** 2.471*** 1.998*** (0.007) (0.008) (0.007) (0.192) (0.444) (0.289) Employees 250<X 5.277*** 2.912*** 3.845*** 1.570*** 2.609*** 1.989*** (0.010) (0.013) (0.012) (0.284) (0.735) (0.464) Observations 929,326 929,326 929,326 899,937 899,937 899,937 R-squared 0.691 0.193 0.115 0.031 Number of Firms 140,321 140,321 138,923 138,923
Notes: Non-zombie denotes firms in Portugal that are not zombies, with more than 10 years, an interest coverage ratio higher than 1 for 3 consecutive years, ROA below 0 and total debt ratio below 40%. Zombie share denotes the capital sunk in zombie firms. Ln(emp) means the Log of the employment. Operating Revenue is represented in millions. This panel is from data collected from 2010 until 2018. Standard errors in parentheses. *** denotes statistical significance at the 1% level, ** significance at the 5% level, * significance at the 10% level.
28 In this model we have got the same p-values (approximately zero for all variables) as before so our sample data provide enough evidence to reject the null hypothesis for the entire set. The data favor the hypothesis that there is a non-zero correlation. The beta (𝛽1) in this model has the same signal as the restrictive model, being positive for both dependent variables. So even with the additional restrictions, we have a positive impact of the non-zombie firms on the profit margin and the employment growth. The share of industrial capital sunk in zombie firms with the interaction with the non-zombies is almost the same as the previous one, being negative for the employment and positive for the profit margin. This means that, having more capital sunk in zombie firms can contribute slightly to a higher profit margin to non-zombie firms. This was not expected but it can be explained because if zombie firms can get subsidized credit.
In both, profit margin and employment growth regressions we have a f-statistic in where the null hypothesis is that all the coefficients in the model except for the intercept are zero, so:
𝐻0: 𝛽1 = 0, 𝛽2 = 0, 𝛽3 = 0, 𝛽4 = 0 vs. 𝐻1: 𝐻𝑜 𝑖𝑠 𝑛𝑜𝑡 𝑡𝑟𝑢𝑒 (10)
Since the value is 0, we reject the null hypothesis (reject 𝐻0), so this means that we have, at least, one 𝛽 different from 0 and all independent variables are statistically significant.
The number of employees, in this regression, tell us the same conclusion as the previous one. So, a raise in the number of employees that each firm has, contributes positively to a raise in either the profit margin or the employment growth
To these regressions it is, as well, applied the Fixed effects model and the Random effects model. To the profit margin, the FE model provides almost the same results as the less restrictive regressions provided with a p-value being approximately 0. To notice that the two-tail p-values vary in the size of the firm, mainly when firms have more than 250 or between 10 and 20 employees, but still less than 0.05 so we can say that it is a significant influence on profit margin. The "rho" is 0.557 and another point is that our non-zombie variable with restrictive financial ratios has a t-value of 139 (the higher the t-value, the higher the relevance of the variable).
Again, using the RE model the p-value is approximately 0 as well as all two-tail p-values on all variables. Observing the value on the Hausman test, we again should reject the 𝐻0.
29 approximately 0 for the p-value and the two-tail p-values but a "rho" of 0.902. The difference are the values for the firm size regarding the t-values with around 300 in each category of the number of the employees (the highest is within the group of more than 20 but less than 50), so it can be said that this variable has a significant influence on the employment growth.
The RE model on the employment, the important thing to highlight is the fact that our non-zombie variable and the interaction between the non-non-zombie and the capital sunk in the non-zombie firms have different values for the two-tail p-values with 0.01 and 0.03 respectively. Regarding the employment growth these two variables have a significant impact.
Using the Hausman test, previous shown, for the employment growth, we should reject the 𝐻0 hypothesis since the p-value for this test is, approximately, 0.
7.5. Discussion of results
Looking at the regressions and the results obtained, the regressions, either the less restrictive or the more restrictive, have almost the same impact in the profit margin and employment growth Portuguese firms.
Even with a smaller R square, the fixed effects model should be considered as the most suitable for this regression. Looking at this model we can conclude that, for the restrictive analysis, for example, profit increases by 0.2 percentage points when a firm is non-zombie instead of a zombie, that means that, non-zombie firms have higher profits than zombies (as expected). In this regression, the log of the employment is negative and suggests that employment growth tends to slow if the firm is non-zombie. Also, the operating revenue is positive for both dependent variables which means that, an increase in these variables will increase the operating revenue of the firm.
For the more restrictive analyzes, our variable for non-zombie decreases our values for the estimator. So, the profit margin increases by 0.27 percentage points when it is a non-zombie firm, this means that a non-zombie should report higher profit margin that a zombie firm. Again, the log of the employment suggests that the employment growth tends to slow if the firm is non-zombie (negative sign). The operating revenue in this regression is also positive for both variables.