ISSN: 1809-4430 (on-line) www.engenhariaagricola.org.br
2 Universidade Federal de Viçosa/ Viçosa - MG, Brasil. 3 Universidade Federal de Lavras/ Lavras - MG, Brasil. 4 Universidad de Valladolid/ Valladolid, Espanha.
Received in: 10-24-2017 Accepted in: 4-30-2018
Doi: http://dx.doi.org/10.1590/1809-4430-Eng.Agric.v38n4p634-641/2018
CLASSIFICATION OF MACAW PALM FRUITS FROM COLORIMETRIC
PROPERTIES FOR DETERMINING THE HARVEST MOMENT
Anderson G. Costa
1*, Francisco de A. de C. Pinto
2, Sérgio Y. Motoike
2, Roberto A. Braga Júnior
3,
Luis M. Navas Gracia
41*Corresponding author. Universidade Federal Rural do Rio de Janeiro/ Seropédica - RJ, Brasil. E-mail: [email protected]
KEYWORDS
digital images,
maturation, neural
networks, oil content.
ABSTRACT
Macaw palm (
Acrocomia aculeata
) is a promising crop for biofuel production due to the
high concentration of its fruit oil, but the harvest date is an issue to be better understood
so it could be cultivated on an industrial scale. The aim of this study was to use the
colorimetric properties of the macaw palm fruits to develop a neural network classifier to
determine the ideal moment for harvesting, based on the oil content of the fruit mesocarp.
During nine weeks of maturation were sampled 900 fruits of macaw palm fruits and the
colorimetric properties of the RGB, HSI and CIELab color models were used to classify
the fruits into immature and mature fruits. Kappa index and the overall accuracy values
were used to access the classifier performance. The classifiers based on RGB parameters
and on hue were considered equivalents having a Kappa index of 0.901 and 0.942,
respectively, indicating the 59
thweek of maturation as the ideal time to harvest with the
highest oil content.
INTRODUCTION
The Macaw palm (Acrocomia aculeata) is found in
an expressive way in the Brazilian territory with abundance in the Cerrado region (Conceição et al., 2015). The fruit is considered the most relevant part of the plant economically and presents as one of the main characteristics the high concentration of oil. The oil is used in pharmaceutical industry for the manufacture of cosmetics, in the food sector, as cooking oil and by the energy sector for the production of biofuels (Barreto et al., 2016; Cazarolli et al., 2016).
Brazilian biodiesel production in 2017 was around 4,291,276 m3 and soybean oil accounted for 64% of total
biodiesel production in Brazil while oil produced by other oil crops was responsible for the participation of approximately 10% of total biodiesel production (ABIOVE, 2018). Thus, the exploration of crops with bioenergetics potential like the Macaw presents an alternative so that the Brazilian production of biodiesel continues in expansion.
Despite the great potential for biodiesel production, more information on crop characteristics, such as the ideal harvest time is necessary for the rational and sustainable
exploitation of the crop (Montoya et al., 2016). The beginning of the Macaw harvest is determined by the natural detachment of ripe fruits, usually in extractive systems. The contact of the fruits with the soil entails the quantitative and qualitative loss of produced oil limiting the industrial use of the product (Queiroz et al., 2015). Studies and new technologies that can be used in the harvest and post-harvest phases of the fruits are essential to improve the oil extraction with better quality and in high quantity.
In palm tree the use of digital images is observed in the evaluation of maturation stage, definition of harvest point and estimation of oil content in bunches and fruits, aiming at the development of automated systems for harvesting and post harvesting (Makky et al., 2014, Dinah et al., 2015). Once the optical properties obtained on the surface of the palm tree fruits are used as an indicator of maturation, and the oil contents contained in the mesocarp of the fruits are directly associated to the point of physiological maturation. The different spectral responses can be used to estimate the amount of oil (Saeed et al., 2012, Matsimbe et al., 2015, Costa et al., 2017).
Macaw fruit present subtle changes in color during development, ranging from green to brownish or brown when mature (Montoya et al., 2016). Due to this fact, it becomes difficult to associate the maturation stage with a specific staining pattern only by visual analysis. In this way, the quantitative representation of the color can allow the perception of subtle changes in the colorimetric aspect of the fruits, allowing the monitoring of the maturation process through optical sensors (Wu & Sun, 2013; Ávila et al., 2015).
Thus, the objective of this study was to develop a classifier to discriminate the ripe fruit, suitable for harvesting, based on the colorimetric properties, relating them to the oil content contained in the fruit mesocarp.
MATERIAL AND METHODS Location and acquisition of samples
The fruits used in the experiment were collected in the period from September 2013 to January 2014 in an
area located in the Acaiaca municipality located in Zona da
Mata Mineira at 20º 23’33” south latitude and 47º 07’31”
West longitude with average altitude of 601 m.
The Macaw trees evaluated were Acrocomia aculeata, over 10 years old in a reproductive stage, being cultivated in an extractive system, with no commercial purposes and without previous treatment of the soil.
For the execution of the experiment, 20 different bunches of trees were used, and five fruits were collected per bunch in nine maturation stages, totaling a set of 900 analyzed fruits. The stages of maturation were associated to the beginning of the bunches flowering time, being counted between 41 and 61 weeks after flowering (WAF).
Acquisition and image processing
For the acquisition of the images, a computer was used for image storage and processing, two halogen lamps of 100W each and a multispectral CCD camera, brand Fluxdata, model FD-1665. The digital camera was positioned 25 cm high in relation to the fruit. The images were collected in RGB.
In the pre-processing stage performed in the free software ImageJ, it was sought to highlight the object of
interest (fruit), eliminating the background and possible noises of the image. For this process, the original image was binarized by dividing the histogram into two classes. The threshold between classes was chosen automatically by the method of Otsu (Otsu, 1975). The new image without background presence and noise elimination was obtained through a logical operator of the union of the original image with the binarized image (Figure 1).
FIGURE 1. Pre-processing: application of thresholding and segmentation on the original image.
From the average values of RGB of each image the parameters of the HSI color model were calculated according to [eq. (1)], [eq. (2)], [eq. (3)] and [eq. (4)], respectively (Pedrini & Schwartz, 2007):
H={cos-1[( (R-G)+(R-B)
2*√(R-G)2+(R-B)(G-B))]} , if B < G (1)
H={360- cos-1[ (R-G)+(R-B)
2*√(R-G)2+(R-B)(G-B)]} , if B > G (2)
S=1-(3* minR+G+B(R,G,B)) (3)
I=R+G+B3 (4)
Where,
R – Intensity of red, 0 ≤ R ≤ 255; G – Green intensity, 0° ≤ H ≤ 360º;
B – Intensity of blue, 0° ≤ H ≤ 360º; H – Hue, 0° ≤ H ≤ 360º;
S – Saturation, 0 ≤ S ≤ 1, I – Intensity, 0 ≤ H ≤1;
For the analysis in the CIELab color model, the RGB images of the fruits were converted according to the norms and equations proposed by the Comission Internacional d’Eclairage (Pedrini & Schwartz, 2007). For
X=0.490R + 0.310G + 0.200B (5)
Y= 0.177R+0.813G+0.010B (6)
Z=0.010G + 0.990B (7)
Lu=166(YoY) 1
3-16 , if Y
Yo>0.008856 (8)
Lu=903.3(YoY) , if YoY ≤ 0.008856 (9)
a=500[f(111.16X ) - f(100Y)] (10)
b=200[f(111.16X )- f(100Y)] (11)
c= √a2+b2 (12)
If,
f(t)=t1/3 , when t > 0.008856.
f(t)=7.787t +11616. , when t ≤ 0.008856.
On what,
Lu - Luminance, 0 ≤ Lu ≤ 100;
a - Green to red chromaticity, -120 ≤ a ≤ 120; b - Chromaticity from blue to yellow, -120 ≤ b ≤ 120, c – Chromaticity module;
Determination of the oil content in the fruits
The oil extraction occurred using the solvent n-hexane in Soxhlet extractor by the method 032 / IV from
analytical standards of the Adolfo Lutz Institute (IAL, 2005). The mesocarp of the fruit was cut and dried in a ventilated oven at 65°C for 72 h. After drying, the samples were weighed and placed in paper filter cartridges which were placed in the Soxhlet extractor where they were
submerged in 150 mL of n-hexane for 8 hours until the colorless extract was removed.
The extract was transferred to an oven at 105°C for 24 hours where occurred evaporation of the n-hexane and the water contained in the mesocarp. After 24 hours, the samples were cooled to room temperature and weighed sequentially. The extraction process was carried out by fruit, obtaining an oil content value (OC) for each sample evaluated by [eq. (13)].
OC = 1000(MbMb--MaMc) (13)
On what,
OC = Oil content, mg.g-1;
Mb – mass of the sample before the oil is extracted, g;
Ma – mass of the sample after oil extraction, g, Mc – mass of the paper filter cartridge, g.
The analysis of variance and a simple linear regression model were used to evaluate the oil content response as a function of each maturation period (week after flowering). The completely randomized design was used in which the nine maturation times were considered as the treatments and the twenty bunches evaluated at each stage as the replicates.
Each repetition was obtained by determining the average value of five measurements, corresponding to the oil content of each of the five fruits collected in each bunches.
Classification of fruits for determining the harvest point according to the color models
The fruits used in the experiment were divided into two classes. The immature class (A) was composed by fruits collected at 41st WAF and 45th WAF. These fruits
were chosen for being in the two initial stages of the collections, being considered green for harvest. The mature class (B) was composed by fruits collected at 60th
WAF and 61st WAF which were considered to be close to
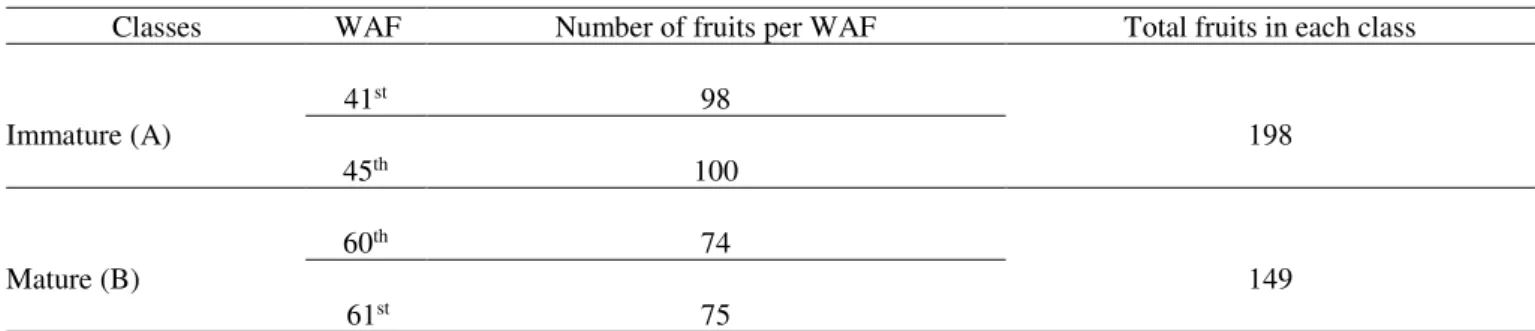
physiological maturation and consequently close to the harvesting point. Table 1 shows the number of fruits in each class.
TABLE 1. Number of fruits in each established class.
Classes WAF Number of fruits per WAF Total fruits in each class
Immature (A)
41st 98
198
45th 100
Mature (B)
60th 74
149
In order to classify the fruits in mature and immature, two acyclic neural networks were trained and feedback by the algorithm backpropagation of the error using the Levenberg-Marquadt variation to accelerate the training time and to improve the performance in the standard classification.
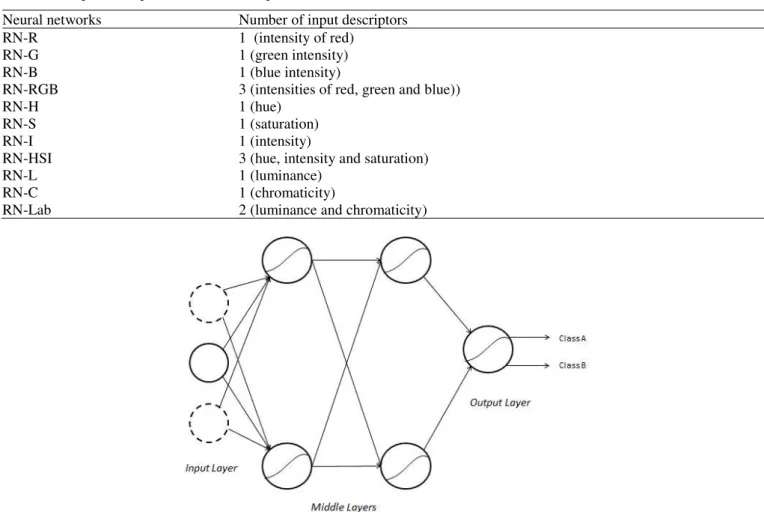
Eleven neural networks were developed according to the color models parameters (Table 2). The architecture of the networks was composed of up to three input vectors,
depending on the number of descriptors for each network. Two other intermediate layers were used with two neurons each and one exit layer (Figure 2). The intermediate layers and the output layer used the hyperbolic tangent as an activation function for both networks. The obtained values in the output layer are continuously distributed between 0 and 1 and being approximated to the nearest whole number. In this way, the output of network 0 referred to fruits classified in the Immature class (A) and the output of network 1 referred to fruits classified in the Mature class (B).
TABLE 2. Input descriptors for each developed neural network. Neural networks Number of input descriptors
RN-R 1 (intensity of red)
RN-G 1 (green intensity)
RN-B 1 (blue intensity)
RN-RGB 3 (intensities of red, green and blue))
RN-H 1 (hue)
RN-S 1 (saturation)
RN-I 1 (intensity)
RN-HSI 3 (hue, intensity and saturation)
RN-L 1 (luminance)
RN-C 1 (chromaticity)
RN-Lab 2 (luminance and chromaticity)
FIGURE 2. Architecture of neural networks developed with the variation of up to three descriptors in the input layer.
Fifty percent of the total number of fruit was used for the training of the nets, 20% for validation and 30% for the trained nets test. Each network was trained ten times, since in the beginning of the training the network parameters are generated randomly. The training was interrupted by the error progress criterion in six consecutive cycles. It was selected the neural network that presented the highest percentage of correctness in the classification of the test samples to represent each type of network.
The accuracy of the classification was evaluated by the global accuracy coefficient and by the Kappa index calculated by means of the error matrix obtained in the classification of the test sample.
Nets with Kappa index greater than 0.75 (Landis & Koch, 1977) were selected and classified as better than a randomized classification using the Z test. To verify the occurrence of a difference between the accuracy of the classifications, the kappa coefficients of the selected neural
networks were compared using the Z test at a significance level of 0.01 (Z tabulated = 2.57) (Congalton & Mead, 1986).
The selected neural networks were used to classify the fruits on nine maturation stages and the percentage of classified fruit in the Immatures and Mature class. Bunches were allocated in the class that presented the highest percentage of its fruits, being this denominated predominant class.
RESULTS AND DISCUSSION
The analysis of variance indicated the existence of the relation on oil content with the maturation times evaluated with a significance of 0.01 (p-value = 7.67e-32).
When analyzing the response of the oil content as a function of the maturation week (Figure 3) we found that with each analyzed maturation week the values of oil content presented an increase of 20.22 mg.g-1, reaching
mean values of 506.70 mg.g-1 and 530.25 mg.g-1 at 60th
WAF and 61st WAF, periods which are indicated for
* Significant coefficient at a level of 0.01 by the t-test.
FIGURE 3. Linear mean ratio between oil content in Macaw fruit and week after flowering.
The increase of the oil content in Macaw fruit is associated to the synthesis of the polysaccharide reserves occurring during maturation (Montoya et al., 2016; Barreto et al., 2016). Harvesting the fruits at the appropriate time, before releasing them from bunches in a natural way, is essential for extracting larger amounts of oil (Queiroz et al., 2015).
Choong et. al (2006) demonstrated a positive relationship between color, using the RGB model and the oil content levels contained in the mesocarp of the Elaeis guineenses palm fruits at different maturation stages. Ishak
& Hudzari (2010) pointed to the hue as the appropriate colorimetric property to relate to the oil content of the fruits on the same palm tree. Thus, automated systems using the analysis of the colorimetric properties of Macaw fruits can be used not only to indicate the appropriate time for harvest but also as a parameter to estimate the oil content in the mesocarp of these fruits without the need to destroy the sample.
The results of the use on eleven neural networks
based on model’s color can be observed in Table 3 by the Kappa index. The Kappa index calculated from matrix error generated by the application of the neural networks on tested group fruit showed that the rankings generated by RN-RGB, RN-H and RN-HSI were significant, considered better than at random at significance level of 1% by the z test, and presented Kappa index greater than
0.75, indicating excellent agreement (Landis & Koch, 1977). The classifications of RN-R, RN-L and RN-Lab networks, although considered statistically better than at random obtained Kappa index lower than 0.75; not presenting the necessary requirements for the selection. The RN-H and RN-HSI presented the highest values of overall efficiency and Kappa index, demonstrating that these networks were the ones with the best accuracy for fruit classification (Table 3).
TABLE 3. Parameters for checking the efficiency of the network used in the test group.
* Significant at a level of 0.01 by the Z test.
Neural Network Global Efficiency (%) Kappa Index Zc
RN-R 85.71 0.703 * 9.993
RN-G 59.05 0.085 1.130
RN-B 50.82 0.001 0.333
RN-RGB 95.24 0.901 * 21.118
RN-H 97.14 0.942 * 28.291
RN-S 58.10 0.025 1.011
RN-I 60.25 0.205 2.130
RN-HSI 97.14 0.942 * 28.291
RN-L 67.62 0.300 * 3.408
RN-C 62.86 0.160 2.353
As RN-H and RN-HSI obtained equivalent accuracy, it was evidenced that the saturation (S) and intensity (I) colorimetric properties did not influence the fruit classification which shows that an analysis only by hue (H) is sufficient to classify Macaw fruits by the HSI color model. Already in analyzing the classification by the RGB color model it is noticed that the combination of red values (R), green (G) and blue (B) is determinant for the classifier success. The analysis of these properties in an individual way, did not allow to obtain classifiers with relevant accuracy, and red intensity was the only parameter to obtain a statistically better classification than at random, at a significance level of 1%, but with Kappa index between 0.40 and 0.75, indicating a median agreement (Landis & Koch, 1977).
The comparison between RN-RGB and RN-H by the Z test indicated that the classifiers were considered statistically equal to a significance level of 1% (Z calculated
(0.76) < Z tabulated (2.57)).
The use of classification systems based on RGB model to identify the maturation degree has been successful in the analysis of palm fruits in general (Zhang et al., 2014; Mohammadi et al., 2015). However, in some cases where the colorimetric variation between stages is subtle, the RGB model may present difficulties in distinguishing maturation stages being influenced by the intensity of incident light (Hudzari et al., 2010). This difficulty is minimized when performing the analysis by the HSI model, since this model allows analyze separately the hue and saturation. The use of hue property is successfully applied in some automated fruit classification
systems by means of artificial vision to determine maturation stage in palm tree (Tan et al., 2010; Makky et al., 2014), demonstrating that conversion of the RGB model to the HSI model facilitates the distinction of maturation degree of the palm tree Elaeis guineenses
fruits.
Fadilah et al. (2012) also used the hue as input descriptor of a classification system developed by neural network to classify fruits of the palm tree Elaeis guineensis for maturation stage and obtained a percentage of correctness of 91.63% which demonstrates the efficiency of this colorimetric parameter.
Although the RGB parameters can be used to classify the fruits regarding maturation, the use of the colorimetric hue parameter is the most recommended alternative for the development of systems that allow the determination of the fruits harvest point on Macaw with higher oil contents.
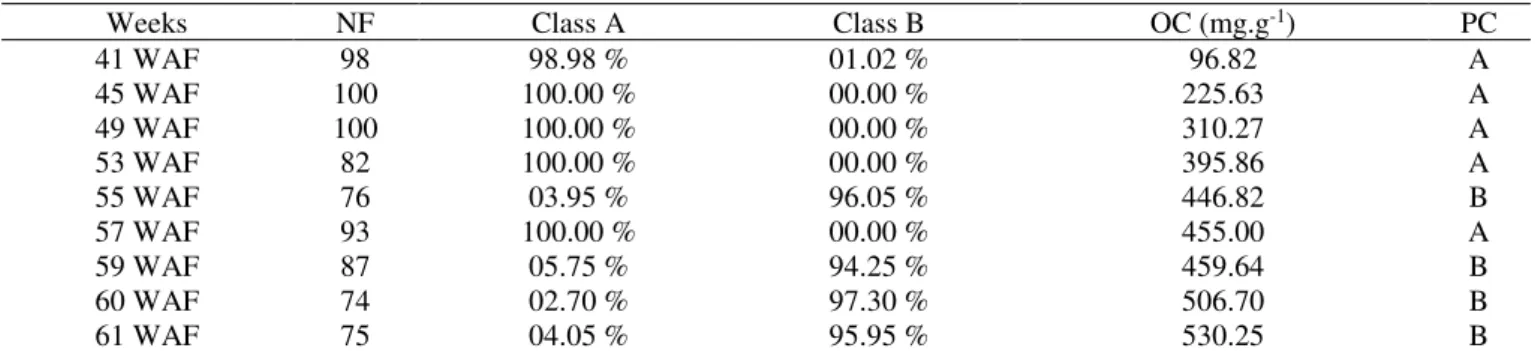
When analyzing the fruits classification by RN-H (Table 4), it was observed that the fruits were classified predominantly as immature up to 53rd WAF. Between 55th WAF and 55th WAF there is a variation in the predominant classification attributed to the similarities of the colorimetric characteristics in the stages near the physiological maturation which reduced the accuracy of the classifier. From the 59th WAF the fruits were classified in the Mature class being considered suitable for the harvest. The high percentage of classification accuracy in all weeks should be highlighted, and ratifies the ability of the classifier to distinguish immature and mature fruits.
TABLE 4. Fruits classified in Immature (A) and Mature (B) classes at each time through the neural network RN-H.
Weeks NF Class A Class B OC (mg.g-1) PC
41 WAF 98 98.98 % 01.02 % 96.82 A
45 WAF 100 100.00 % 00.00 % 225.63 A
49 WAF 100 100.00 % 00.00 % 310.27 A
53 WAF 82 100.00 % 00.00 % 395.86 A
55 WAF 76 03.95 % 96.05 % 446.82 B
57 WAF 93 100.00 % 00.00 % 455.00 A
59 WAF 87 05.75 % 94.25 % 459.64 B
60 WAF 74 02.70 % 97.30 % 506.70 B
61 WAF 75 04.05 % 95.95 % 530.25 B
(RN-H= Neural network using hue (H) as input descriptor; NF = Number of fruits; OC = Oil content; PC= Predominant class; WAF = weeks after flowering).
Macaw climacteric respiration allows the fruits to continue the maturation process, even with the elevation of the oil content, if the collection is carried out before the fruits physiological maturation (Evaristo et al., 2016). Thus, in the harvest from the 55th WAF it is possible to
obtain a quantity of fruits already suitable for harvest and fruits still inappropriate, but which can complete the maturation process during storage. From 59th WAF, a
selective harvest can be obtained with the fruits predominantly in physiological maturation stage and with the highest oil contents. Although anticipated harvesting allows the reduction of mature fruit losses due to natural detachment and a decrease in the number of harvesting
operations in the field when comparing with selective harvesting, it will require a rigid management in the post-harvest phase so that the fruit reaches the higher levels of quantity and quality of oil content.
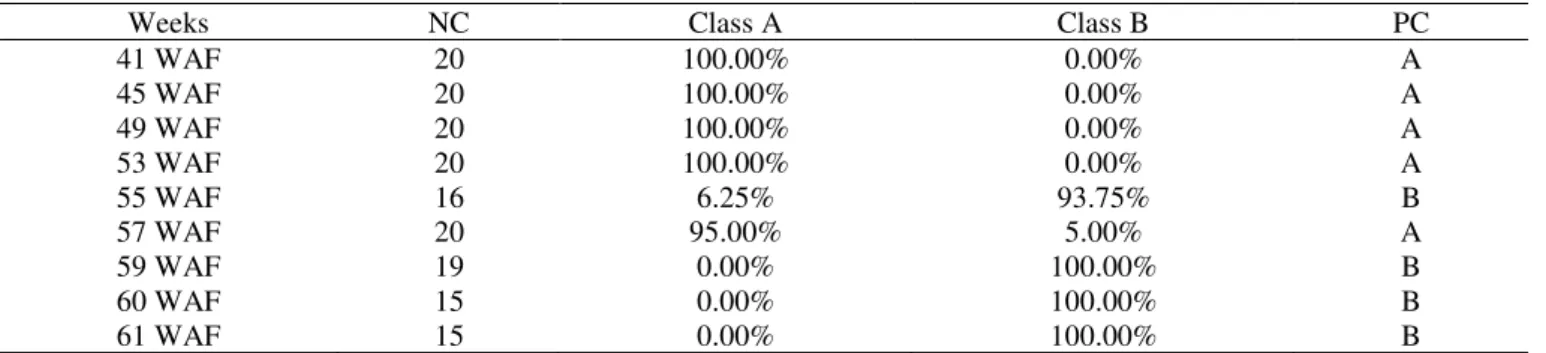
TABLE 5. Bunches classified in Immature (A) and Mature (B) classes at each maturation period by means of the neural network RN-H.
Weeks NC Class A Class B PC
41 WAF 20 100.00% 0.00% A
45 WAF 20 100.00% 0.00% A
49 WAF 20 100.00% 0.00% A
53 WAF 20 100.00% 0.00% A
55 WAF 16 6.25% 93.75% B
57 WAF 20 95.00% 5.00% A
59 WAF 19 0.00% 100.00% B
60 WAF 15 0.00% 100.00% B
61 WAF 15 0.00% 100.00% B
(RN-H= Neural network using hue (H) as an input descriptor; NC = Number of bunches; CP= Predominant class; WAF = weeks after flowering).
CONCLUSIONS
The neural networks developed according to the color models identified the 59th week after flowering as the
appropriate time for harvesting Macaw fruits.
Because they are associated with the maturation stage of the fruit, the colorimetric properties can be used as an indicator of the range on oil content found in the
Macaw fruit.
ACKNOWLEDGMENTS
The authors would like to thank the Federal University of Viçosa and financial support agencie CNPq.
REFERENCES
ABIOVE - Associação Brasileira das Indústrias de Óleos Vegetais (2018) Biodiesel: matéria-prima para produção –
Julho de 2018. ANP/ABIOVE. Estatísticas do biodiesel. Available in:
http://www.abiove.org.br/site/index.php?page=estatistica& area=NC0yLTE. Accessed: Mar, 2018.
Ávila F, Mora M, Oyarce M, Zuñiga A, Fredes C (2015) A method to construct fruit maturity color scales based on support machines for regression: Application to olives and grape seeds. Journal of Food Engineering 162:9-17. Barreto LC, Magalhães ALL, Takahashi JA, Garcia QS (2016) Dynamic of reserve compounds of mesocarp and seeds of macaw palm (Acrocomia aculeata) submitted to
different storage conditions. Trees 30(6):1945-1952. Cazarolli JC, Quadros PD, Bücker F, Santiago MRF, Piatnicki CMS, Peralba MCR, Cavalcanti SHS, Bento FM (2016) Microbial growth in Acrocomia aculeata pulp oil, Jatropha curcas oil, and their respective biodiesels under
simulated storage conditions. Biofuel Research Journal 12(3):514-520.
Choong TS, Abbas S, Shariff AR, Halim R, Ismail MHS, Yunus R, Ahmadun FR (2006) Digital image processing of palm oil fruits. International Journal of Food Engineering 2(2):838-843.
Conceição LDHCHS, Antoniassi R, Junqueira NTV, Braga MF, Faria-Machado AF, Rogério JB, Duarte ID, Bizzo H (2015) Genetic diversity of macauba from natural populations of Brazil. BMC Research Notes 8:1-9. DOI: http://dx.doi.org/10.1186/s13104-015-1335-1
Congalton RG, Mead RA (1986) A review of three discrete multivariate analysis techniques used in assessing the accuracy of remotely sensed data from error matrices. IEEE Transactions on Geoscience and Remote Sensing 1:169-174.
Costa AG, Pinto FAC, Braga RA, Motoike SY, Gracia LIMN (2017) Determination of macaw fruit harvest period by biospeckle laser technique. African Journal of
Agricultural Research 12(9):674-683.
Dinah C, Sam H, Usman A, Tineke M, Makky M (2015) Optical characteristics of oil palm fresh fruits bunch (FFB) under three spectrum regions influence for harvest
decision. International Journal on Advanced Science, Engineering and Information Technology 5(3):255-263. Evaristo AB, Grossi JAS, Pimentel LD, Goulart SM, Martins AD, Santos VL, Motoike SY (2016) Harvest and post-harvest conditions influencing macauba (Acrocomia aculeata) oil quality attributes. Industrial Crops and
Products 85:63-73.
Fadilah N, Mohamad-Saleh J, Abdul Halim Z, Ibrahim H, Syed Ali SS (2012) Intelligent color vision system for ripeness classification of oil palm fresh fruit
bunch. Sensors 12(10):14179-14195.
Gomes Júnior FG, Arruda N, Marcos-Filho J (2017) Swingle citrumelo seed vigor and storability associated with fruit maturity classes based on RGB
parameters. Scientia Agricola 74(5):357-363.
Hudzari R, Ishak WW, Noorman M (2010) Parameter acceptance of software development for oil palm fruit maturity prediction. Journal of Software Engineering 4(3):244-256.
Huang H, Liu L, Ngadi MO (2014) Recent developments in hyperspectral imaging for assessment of food quality and safety. Sensors 14(4):7248-7276.
IAL - Instituto Adolfo Lutz (2005) Métodos físico-químicos para análise de alimentos: Brasília, Anvisa, 4ed. 96p.
Ishak WIW, Hudzari RM (2010) Image based modeling for oil palm fruit maturity prediction. Journal of Food, Agriculture & Environment 8(2):469-476.
Makky M, Soni P, Salokhe VM (2014) Automatic non-destructive quality inspection system for oil palm fruits. International Agrophysics 28(3):319-329. Matsimbe SFS, Motoike SY, Pinto FAC, Leite HG, Marcatti GH (2015) Prediction of oil content in the mesocarp of fruit from the macauba palm using
spectrometry. Revista Ciência Agronômica 46(1):21-28. Mohammadi V, Kheiralipour K, Ghasemi-Varnamkhasti M (2015) Detecting maturity of persimmon fruit based on image processing technique. Scientia Horticulturae 184:123-128.
Montoya SG, Motoike SY, Kuki KN, Couto AD (2016) Fruit development, growth, and stored reserves in macauba palm (Acrocomia aculeata), an alternative bioenergy crop. Planta 244(4):927-938.
Otsu N (1975) A threshold selection method from gray-level histograms. Automatica 11(285):23-27.
Pedrini H, Schwartz WR (2007) Análise de imagens digitais: princípios, algoritmos e aplicações. São Paulo, Thomson Learning Edições, 508 p.
Pu YY, Feng YZ, Sun DW (2015) Recent progress of hyperspectral imaging on quality and safety inspection of fruits and vegetables: a review. Comprehensive Reviews in Food Science and Food Safety 14(2):176-188.
Queiroz L, Nascimento C, Santos V, Cren E, Andrade M (2015) Avaliação dos microrganismos presentes nos frutos da macaúba (Acrocomia Aculeata) após diferentes
tratamentos pós-colheita. Blucher Chemical Engineering Proceedings 1(2):4595-4602.
Saeed OMB, Sankaran S, Shariff ARM, Sharifri HZM, Ehsani R, Alfatni MS, Hazir MHM (2012) Classification of oil palm fresh fruit bunches based on their maturity using portable four-band sensor system. Computers and Electronics in Agriculture 82:55-60.
Tan YA, Low KW, Lee CK, Low KS (2010) Imaging technique for quantification of oil palm fruit ripeness and oil content. European journal of lipid science and technology 112(8):838-843.
Wu D, Sun D (2013) Colour measurements by computer vision for food quality control–A review. Trends in Food Science & Technology 29(1):5-20.
Zhang B, Huang W, Li J, Zhao C, Fan S, Wu J, Liu C (2014) Principles, developments and applications of computer vision for external quality inspection of fruits and vegetables: A review. Food Research