Original Article
Artigo Original
ISSN 2317-1782 (Online version)
This is an Open Access article distributed under the terms of the Creative Commons Attribution License, which permits unrestricted use, distribution, and reproduction in any medium, provided the original work is properly cited.
Short- and long-latency auditory evoked
potentials in individuals with vestibular
dysfunction
Potenciais evocados auditivos de curta e
longa latência em indivíduos com disfunção
vestibular
Valdete Alves Valentins dos SantosFilha1 Mirtes Bruckmann2 Michele Vargas Garcia1
Keywords
Electrophysiology Auditory Evoked Potential Vestibular Function Tests Dizziness Vertigo
Descritores
Eletrofisiologia
Potenciais Evocados Auditivos Testes de Função Vestibular Tontura Vertigem
Correspondence address:
Mirtes Bruckmann
Programa de Pós-graduação em Distúrbios da Comunicação Humana, Universidade Federal de Santa Maria – UFSM
Av. Roraima, 1000, Prédio 26, Bairro Camobi, Santa Maria (RS), Brasil, CEP: 97105-900.
E-mail: [email protected]
Received: January 26, 2017
Study carried out at Departamento de Fonoaudiologia, Universidade Federal de Santa Maria – UFSM - Santa Maria (RS), Brasil.
1 Departamento de Fonoaudiologia, Universidade Federal de Santa Maria – UFSM - Santa Maria (RS), Brasil. 2 Programa de Pós-graduação em Distúrbios da Comunicação Humana, Universidade Federal de Santa Maria
– UFSM - Santa Maria (RS), Brasil.
Financial support: nothing to declare.
Conflict of interests: nothing to declare. ABSTRACT
Purpose: Evaluate the auditory pathway at the brainstem and cortical levels in individuals with peripheral vestibular dysfunction. Methods: The study sample was composed 19 individuals aged 20-80 years that presented exam results suggestive of Peripheral Vestibular Disorder (PVD) or Vestibular Dysfunction (VD). Participants underwent evaluation of the auditory pathway through Brainstem Auditory Evoked Potentials (BAEP) (short latency) and P1, N1, P2, N2, and P300 cortical potentials (long latency). Results: Nine individuals presented diagnosis of VD and 10 participants were diagnosed with PVD. The overall average of the long latency potentials of the participants was within the normal range, whereas an increased mean was observed in the short latency of waves III and V of the left ear, as well as in the I – III interpeak interval of both ears. Association of the auditory potentials with
VD and PVD showed statistically significant correlation only in the III – V interpeak interval of the right ear for
short latency. Comparison between the long and short latencies in the groups showed differences between VD
and PVD, but without statistical significance. Conclusion: No statistically significant correlation was observed
between VD/PVD and the auditory evoked potentials; however, for the long latency potentials, individuals with VD presented higher latency in P1, N1, P2, and N2, where as participants with PVD showed higher latency in P300. In the short latency potentials, there was an increase in the absolute latencies in the VD group and in the interpeak intervals in the PVD group.
RESUMO
Objetivo: Avaliar a via auditiva em nível de tronco encefálico e cortical em indivíduos com disfunção vestibular periférica. Método: Participaram do estudo 19 indivíduos, com idade entre 20 e 80 anos que possuíam exames
vestibulares sugestivos de Disfunção Vestibular Periférica Deficitária (DVPD) ou Disfunção Vestibular (DV).
Os participantes realizaram avaliação da via auditiva por meio dos Potenciais Evocados Auditivos de Tronco Encefálico (curta latência) e dos potenciais P1, N1, P2, N2 e P300 (longa latência). Resultados: Nove indivíduos
apresentaram diagnóstico de Disfunção Vestibular e 10 de Disfunção Vestibular Periférica Deficitária. A média geral dos potenciais de longa latência dos participantes ficou dentro da normalidade e no de curta latência houve
uma média aumentada na latência das ondas III e V da orelha esquerda, bem como no intervalo interpico I-III de
ambas as orelhas. Ao relacionar os potenciais auditivos com DV e DVPD, houve significância estatística apenas
no intervalo interpico III-V no potencial de curta latência da orelha direita. Ao comparar longa e curta latência nos
grupos, houve diferenças nas latências entre DV e DVPD, sem significância estatística. Conclusão: Não houve
relação significativa de DV e DVPD com os potenciais auditivos, porém, nos potenciais de longa latência, os
indivíduos com Disfunção Vestibular apresentaram maior latência em P1, N1, P2, N2 e os indivíduos com
Disfunção Vestibular Periférica Deficitária, maior latência no P300. No potencial de curta latência, houve
um aumento nas latências absolutas no grupo Disfunção Vestibular e nos intervalos interpicos em Disfunção
INTRODUCTION
Balance and hearing are two of the main vital skills for humans. They play fundamental roles in people’s relationship with the environment. Disorders of balance make people insecure and produce severe impairments in their quality of life, affecting mainly elderly(1,2), but also present in other age groups(3).
Otoneurological evaluation reveals important data on hearing, body balance and their relations with the Central
Nervous System. Specifically, vector electronystagmography
(VENG) is one of the most widely used methods to diagnose balance alterations and, thus, help in the diagnosis of labyrinth changes(3). This evaluation may reveal Vestibular Dysfunction (VD), in cases in which the caloric test presents a result of
hyperreflexia or directional preponderance of nystagmus, or Peripheral Vestibular Deficiency Deficiency (PFVV), in cases in which the caloric test presents a result of hyporeflexia, areflexia
or labyrinthine preponderance(4).
The auditory and vestibular systems are located in the same peripheral receptor. Because of their proximity, we believe that there is a need for an evaluation of both portions, which should include of the vestibular tests, the electrophysiological evaluation of hearing, especially in individuals complaining of dizziness, vertigo or associated manifestations(3,5), in order to establish an accurate diagnosis of the possible etiologies.
Thus, we understand that, in addition to the peripheral portion, the central portion of the hearing should be evaluated, since these alterations, together with vestibular dysfunctions, may be the only manifestations of diseases that affect other systems, such as the case of endolymphatic hydrops, ototoxicity, vestibular schwannoma, cases of traumatic brain injury, among others(6). Also, changes in the vestibular system may be indicative of several Central Nervous System pathologies(7).
Auditory Evoked Potentials (PEA) can assist in the diagnosis of individuals with vestibular alterations, investigating the integrity of the auditory pathway from its peripheral portion to the auditory cortex, since vestibular disorders can compromise both systems(3,8). The PEA integrated to the vestibular evaluation can provide information about the lesion site(5). Among the EAPs, the short (Auditory Evoked Potential Brain Stem Potential - BAEP), mean (Moderate Latency Auditory Evoked Potential - MEL) or long latency (P1, N1, P2, N2) can also be used in this evaluation, also known as cortical and cognitive potentials (P300).
Studies dating from the 80s and 90s(9-12) already presented the indication of abnormalities in BAEP in individuals suffering from vertigo or dizziness, and the origin of the impairment were the central alterations. In the last Brazilian research on the subject, when comparing the BAEP of individuals with and without vestibular dysfunction, 96% of the individuals had normal latency values, but this rate was increased in relation to the control group(3). In another study(5), when evaluating the auditory pathway with BAEP, PEAML and P300 in individuals with PVD and VD of peripheral origin, changes were found in all potentials.
In this context, it is important to expand the research on electrophysiological responses in individuals with VD or PVD,
for studies are still scarce and there has been no consensus on electrophysiological potentials being capable of identifying neurotological changes. Thus, this study may contribute to understand the functioning of the auditory pathway in this population, which seeks to provide some clarity in the diagnosis of vestibular disorders as well as to assist the monitoring of evolution and specialized treatment. The changes in the PEA may be indicative of the need to request integrated otoneurological evaluations and vice versa. Thus, this study aims to broaden the vision of the professionals in the referral, and the insertion of complementary tests in the clinical evaluation with the intention of enriching the diagnosis and the therapeutic orientation.
Thus, the goal of this study is to evaluate the auditory pathway at the brainstem and cortical level in individuals with peripheral vestibular dysfunction.
METHODS
This is a descriptive, quantitative and cross-sectional study. The research was performed at the Otoneurology Ambulatory - Equilibrium Sector and at the Hearing Electrophysiology outpatient clinic of the Santa Maria University Hospital, Federal University of Santa Maria-RS (UFSM), after approval by the Research Ethics Committee of the University under protocol number 306.039. The study followed the precepts of resolution 466/12.
The sample of this study was determined by convenience. It was consisted by patients who attended the Otoneurology Outpatient Clinic to evaluate their balance in a period of eight months. All individuals who were invited to the research consented to participate after reading and signing the Term of Free and Informed Consent.
For the series of the study, the following eligibility criteria were adopted: age from 18 years old; auditory thresholds up to 25 dB NA in the mean frequencies from 250 to 2000 Hz (low frequencies) and up to 50 dB NA in the average frequencies of 3000 to 8000 Hz (high frequencies), to avoid that the
peripheral hearing loss could influence the results of the EAP;
absence of conductive impairment; having vestibular exams suggestive of PVD or VD; and absence of neurological and / or cognitive impairments, according to information in the chart or that could be visible.
The individuals who were scheduled for the service of the Otoneurology Outpatient Clinic had already had audiometric results. Thus, after the vestibular tests, those who presented VD or PVD results and had their audiometry done were invited to participate in the study and were scheduled at another time for the electrophysiological tests. Nineteen individuals participated in the study, with a mean age of 50.1 years, ranging from 20 to 80 years old, with three males and 16 females.
variation during eye movement(4). The evaluations were basically aimed at recording nystagmus.
In order to perform the vestibular exam and to obtain reliable results, it is emphasized that all the individuals met the recommendations of the previous preparation for the examination as suggested by the literature(4).
Initially, the subjects’ skin was cleaned with alcohol and four
electrodes were fixed to the individual’s skin by means of an
electrolytic paste and adhesive tape (micropore) in the periorbital region, one in each outer corner of the eyes, another in the frontal
region and the last, two fingers above the glabella(4). Subsequently, the subjects were positioned, sitting 3.3 feet from the light bar with reduced lightness in the room during the examination and the VENG was performed to observe and record the calibration of the ocular movements; search for spontaneous nystagmus with open eyes (NEOA) and with closed eyes (NEOF); semi spontaneous nystagmus research (NSE); pendular tracking research; optokinetic nystagmus research (NOP); decreasing pendular rotatory test (PRPD) and the post-caloric nystagmus by means of caloric test(4).
For the present study, only the results obtained in the
caloric test were considered, for it was a specific assessment
of the vestibular function and it allows an evaluation of each labyrinth separately. Stimulation with water (240mL) was used for 40 seconds at temperatures of 44 °C and 30 °C in the following sequence: 44 °C-OD, 44 °C-OE, 30 °C-OE and 30 °C-OD; with interval of three minutes between tests(4), respecting an interval
of five minutes between the stimuli. The subject was positioned
so that he/she remained in a dorsal position with an inclination of 30º in relation to the horizontal plane(4).
For the recording of post-caloric nystagmus, the subjects were kept under mental task with their eyes closed in order to
maximize the responses of the vestibulo-ocular reflex. They were instructed to open their eyes and fix them at a point in front of
them in order to observe the presence or absence of the Effect of Inhibition of Ocular Fixation on them (EIFO)(4).
Thus, subjects with VD were considered as those in whom
the caloric test presented a result of hyperreflexia or directional preponderance of nystagmus. For the classification in PVD, we
considered those in which the caloric test presented a result of
hyporeflexia, areflexia or labyrinthine preponderance, according
to Mor and Fragoso criteria(4).
In a second moment, the electrophysiological evaluation was performed only in the individuals who accepted to participate in
the research and who fit the inclusion criteria. The “SmartEP”
model equipment of the Intelligent Hearing Systems (IHS) brand, two channels was used, in which the evaluation consisted of the realization of the LLAEP and the BAEP. It is worth mentioning
that LLEP was performed first because individuals need to be
attentive to the stimuli.
To perform the LLAEP, the subjects’ skin was cleaned using
an exfoliating gel and the electrodes were fixed with electrolytic
conductive paste and microporous tape, being the active electrode in the vertex (Cz), the reference electrodes in the right and left mastoid, and the electrode on the forehead (Fpz).
Due to the unavailability of a greater number of electrodes in the equipment used, it was not possible to monitor the ocular
movement during the exam, but it was verified that there was
no interference regarding the quality, because the artifact numbers were controlled. Furthermore, the impedance of the electrodes was kept equal to or less than 3Kohm. The subjects sat in comfortable armchairs and were instructed to mentally count the different stimuli (rare stimulus) that would appear randomly within a series of equal stimuli (frequent stimulus), and only at the end of the examination should they talk how many rare stimuli have they heard. The percentage of presentation of rare stimuli was 20%, whereas for frequent stimuli it was 80% (oddball paradigm).
A series of 300 stimuli (240 frequent and 60 rare) verbal (syllables / ba / - frequent stimulus and / di / - rare stimulus) was presented binauraly at an intensity of 80dBnHL, using insertion phones with speed of 0.8 stimuli / second, alternating polarity
and bandpass filters of 1-30Hz. The latency values were obtained
by identifying the P1, N1, P2 and N2 waves in the tracing of the frequent stimulus and the P300 in the tracing of the rare stimulus, using as reference of normality for these potentials the values proposed in a study that also used the same set of
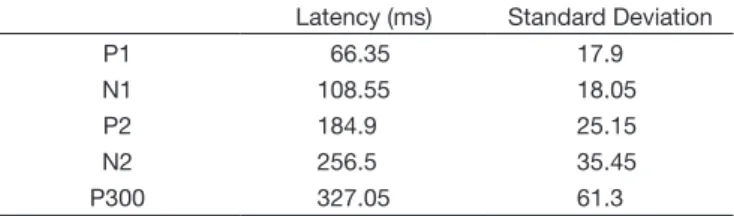
stimuli in the “SmartEP” equipment, as described in Table 1(13). The reproducibility of the tracing was not performed for the marking of the waves. They were scored according to the morphology of the positive and negative peaks, and the expected latencies. The wave marking was performed by one of the researchers and it had a Speech Therapist as judge, and there was agreement in the marking in 100% of the tracings.
For the classification of the individuals in normal and altered
in the P300, the subjects who were 60 years old or older was emphasized, due to the latency increase reported in the literature from 60 years of age, from 2.85 ms to each year from this age group(14). At first, we thought of considering the increase in latency in individuals over 45 years old, due to reports in the literature, for the occurrence of this increase in this age group(15,16). However,
when visualizing the latency values acquired, it was verified
that, in the group of individuals between 45 and 60 years of age, there was absence of the P300 potential in the majority of
individuals, being these classified as altered, together with those
who already presented an increased latency regardless of adult or old age, which occurred in only one individual. Those that were within the standard for both adults under 45 years and
for adults of greater age were classified as normal in this same group, since the value fit any criterion, as can be seen in Table 2.
Table 1. Values of Latency utilized on LLAEP
Latency (ms) Standard Deviation
P1 66.35 17.9
N1 108.55 18.05
P2 184.9 25.15
N2 256.5 35.45
Thus, it was understood that dividing individuals into an age group over 45 years would not be necessary, since this division
would not influence the results, thus deciding to consider only
the increase in latency for individuals over 60 years of age. Then, the BAEP was recorded, in which the active electrode was positioned in Fz (front), remaining in the same places, and the impedance of the electrodes still maintained equal to or less than 3Kohm. The subjects remained seated in the armchair and were instructed to keep their eyes closed and relaxed in order to reduce interferences in the examination.
BAEP was performed only for qualitative auditory pathway
research. The click was used as acoustic stimulus, in rarefied
polarity. It was presented monaurally at the intensity of 80 dBnHL, in both ears, with the use of insertion phones, at a presentation rate of 27.7 clicks / second, duration of 0.1 milliseconds, using a total of 2048 stimuli in each ear. Two waves were recorded in
each ear for the reproduction of the tracings and confirmation
of the existence of answers. The absolute latencies of waves I, III and V and the interpeak intervals I-III, III-V and I-V were
analyzed. The results were classified as normal or altered based
on the values provided by the manufacturer himself, in a table that accompanies the equipment, according to the values shown in Table 3.
In Figure 1, a sample of how the P1, N1, P2, N2, P300 and BAEP potentials were recorded and labeled in a subject participating in the research.
Figure 1. Demonstration of LLAEP and BAEPs
Table 3. Absolute latency number and interpeak intervals used on BAEPs
Wave I Wave III Wave V Interpeak I-III Interpeak III-V Interpeak I-V
Latency (ms) 1.59 3.64 5.57 1.53 2.02 3.98
Standard Deviation 0.24 0.17 0.16 0.50 0.22 0.25
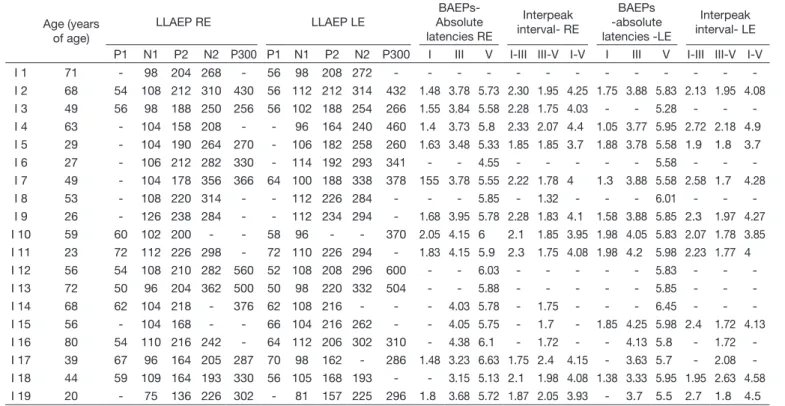
Table 2. Latency values found in P1, N1, P2, N2 e P300 potentials and absolute latencies and interpeak intervals of BAEPs in every individual in the survey
Age (years of age)
LLAEP RE LLAEP LE
BAEPs- Absolute latencies RE
Interpeak interval- RE
BAEPs -absolute latencies -LE
Interpeak interval- LE
P1 N1 P2 N2 P300 P1 N1 P2 N2 P300 I III V I-III III-V I-V I III V I-III III-V I-V
I 1 71 - 98 204 268 - 56 98 208 272 - - -
-I 2 68 54 108 212 310 430 56 112 212 314 432 1.48 3.78 5.73 2.30 1.95 4.25 1.75 3.88 5.83 2.13 1.95 4.08
I 3 49 56 98 188 250 256 56 102 188 254 266 1.55 3.84 5.58 2.28 1.75 4.03 - - 5.28 - -
-I 4 63 - 104 158 208 - - 96 164 240 460 1.4 3.73 5.8 2.33 2.07 4.4 1.05 3.77 5.95 2.72 2.18 4.9
I 5 29 - 104 190 264 270 - 106 182 258 260 1.63 3.48 5.33 1.85 1.85 3.7 1.88 3.78 5.58 1.9 1.8 3.7
I 6 27 - 106 212 282 330 - 114 192 293 341 - - 4.55 - - - 5.58 - -
-I 7 49 - 104 178 356 366 64 100 188 338 378 155 3.78 5.55 2.22 1.78 4 1.3 3.88 5.58 2.58 1.7 4.28
I 8 53 - 108 220 314 - - 112 226 284 - - - 5.85 - 1.32 - - - 6.01 - -
-I 9 26 - 126 238 284 - - 112 234 294 - 1.68 3.95 5.78 2.28 1.83 4.1 1.58 3.88 5.85 2.3 1.97 4.27
I 10 59 60 102 200 - - 58 96 - - 370 2.05 4.15 6 2.1 1.85 3.95 1.98 4.05 5.83 2.07 1.78 3.85
I 11 23 72 112 226 298 - 72 110 226 294 - 1.83 4.15 5.9 2.3 1.75 4.08 1.98 4.2 5.98 2.23 1.77 4
I 12 56 54 108 210 282 560 52 108 208 296 600 - - 6.03 - - - 5.83 - -
-I 13 72 50 96 204 362 500 50 98 220 332 504 - - 5.88 - - - 5.85 - -
-I 14 68 62 104 218 - 376 62 108 216 - - - 4.03 5.78 - 1.75 - - - 6.45 - -
-I 15 56 - 104 168 - - 66 104 216 262 - - 4.05 5.75 - 1.7 - 1.85 4.25 5.98 2.4 1.72 4.13
I 16 80 54 110 216 242 - 64 112 206 302 310 - 4.38 6.1 - 1.72 - - 4.13 5.8 - 1.72
-I 17 39 67 96 164 205 287 70 98 162 - 286 1.48 3.23 6.63 1.75 2.4 4.15 - 3.63 5.7 - 2.08
-I 18 44 59 109 164 193 330 56 105 168 193 - - 3.15 5.13 2.1 1.98 4.08 1.38 3.33 5.95 1.95 2.63 4.58
I 19 20 - 75 136 226 302 - 81 157 225 296 1.8 3.68 5.72 1.87 2.05 3.93 - 3.7 5.5 2.7 1.8 4.5
Significant results were considered when p≤0.05 with a 95% confidence interval. The statistical tests used were the
Chi-square test to measure the degree of relationship between VD and PVD with LLAEP and BAEP, and the Mann-Whitney test to compare VD and PVD for the quantitative values of LLAEP and BAEP.
RESULTS
Among the 19 participants of the study, 3 were men and 16 were women, aged from 20 to 80 years of age, with a main average of 50.1 years-old. Within the participants, 6 were aged above 60 years old and 13 were aged from 20 to 59 years old. In spite of the wide age range assessed, the sample was
homogeneous, since the coefficient of variation was 37%, which is under 50%. Also, the confidence interval was low (8.3), which makes possible to affirm that the average age was
50.1 ± 8.3 years old.
Regarding the hearing thresholds, nine subjects presented normal thresholds in all frequencies, while four subjects presented normal thresholds in the average of low frequencies and neurosensorial hearing loss until 40 dB HL in high frequencies and six subjects presented normal thresholds in
low frequencies and neurosensorial hearing loss until 50 dB HL in high frequencies.
Among the participants, 9 presented VD diagnosis and 10 presented PVD. Of those who presented VD, seven
showed hiperreflexia and two showed nystagmus directional
preponderance. Of those who showed PVD diagnosis, one
showed areflexia, seven showed labyrinthine preponderance and two showed hyperreflexia.
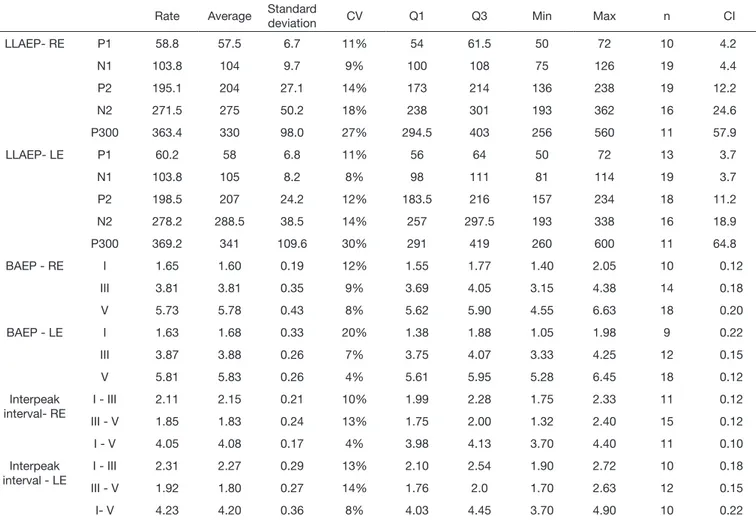
On Table 4, the complete description of every subject is evidenced, showing, among others, the average of the latency values of LLAEP, BAEPs and interpeak interval of the BAEPs waves per ear.
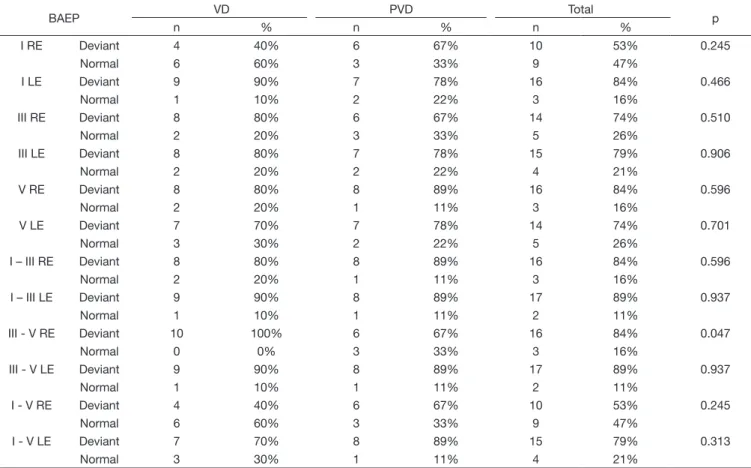
On Tables 5 and 6, there are, respectively, the measurement of the degree relation of VD and PVD to LLAEP and to absolute latency and interpeak interval of BAEPs per ear. Statistic
significance only for the interpeak interval III-V of the right
ear is noted on BAEPs.
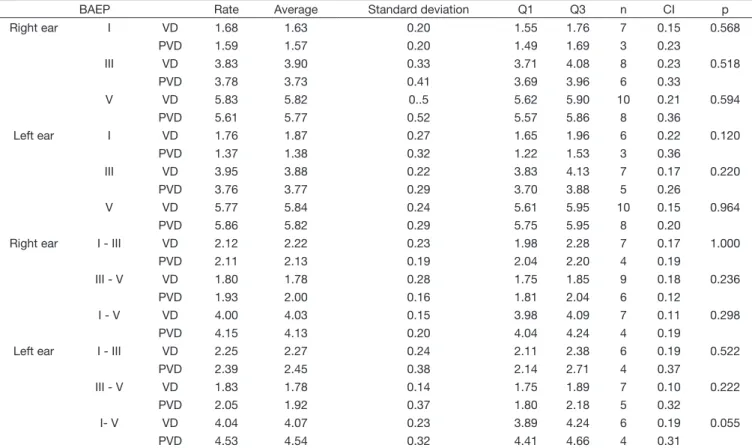
On Tables 7 and 8, the comparison result between LLAEP and BAEPs, with the vestibular system assessment results (VD or PVD) are shown, respectively.
Table 4. Complete description of LLAEP latency, of BAEPs and BAEPs Interpeak interval per ear
Rate Average Standard
deviation CV Q1 Q3 Min Max n CI
LLAEP- RE P1 58.8 57.5 6.7 11% 54 61.5 50 72 10 4.2
N1 103.8 104 9.7 9% 100 108 75 126 19 4.4
P2 195.1 204 27.1 14% 173 214 136 238 19 12.2
N2 271.5 275 50.2 18% 238 301 193 362 16 24.6
P300 363.4 330 98.0 27% 294.5 403 256 560 11 57.9
LLAEP- LE P1 60.2 58 6.8 11% 56 64 50 72 13 3.7
N1 103.8 105 8.2 8% 98 111 81 114 19 3.7
P2 198.5 207 24.2 12% 183.5 216 157 234 18 11.2
N2 278.2 288.5 38.5 14% 257 297.5 193 338 16 18.9
P300 369.2 341 109.6 30% 291 419 260 600 11 64.8
BAEP - RE I 1.65 1.60 0.19 12% 1.55 1.77 1.40 2.05 10 0.12
III 3.81 3.81 0.35 9% 3.69 4.05 3.15 4.38 14 0.18
V 5.73 5.78 0.43 8% 5.62 5.90 4.55 6.63 18 0.20
BAEP - LE I 1.63 1.68 0.33 20% 1.38 1.88 1.05 1.98 9 0.22
III 3.87 3.88 0.26 7% 3.75 4.07 3.33 4.25 12 0.15
V 5.81 5.83 0.26 4% 5.61 5.95 5.28 6.45 18 0.12
Interpeak interval- RE
I - III 2.11 2.15 0.21 10% 1.99 2.28 1.75 2.33 11 0.12
III - V 1.85 1.83 0.24 13% 1.75 2.00 1.32 2.40 15 0.12
I - V 4.05 4.08 0.17 4% 3.98 4.13 3.70 4.40 11 0.10
Interpeak interval - LE
I - III 2.31 2.27 0.29 13% 2.10 2.54 1.90 2.72 10 0.18
III - V 1.92 1.80 0.27 14% 1.76 2.0 1.70 2.63 12 0.15
I- V 4.23 4.20 0.36 8% 4.03 4.45 3.70 4.90 10 0.22
Table 5. Relation between the obtained results in the Vector Nystagmography (VD e PVD) e o PEALL (N1, N2, P1, P2 e P300) normal and deviant on both ears
PEALL VD PVD Total p
n % n % n %
N1 RE Deviant 0 0% 1 11% 1 5% 0.279
Normal 10 100% 8 89% 18 95%
N1 LE Deviant 0 0% 1 11% 1 5% 0.279
Normal 10 100% 8 89% 18 95%
N2 RE Deviant 7 70% 4 44% 11 58% 0.260
Normal 3 30% 5 56% 8 42%
N2 LE Deviant 6 60% 6 67% 12 63% 0.764
Normal 4 40% 3 33% 7 37%
P1 RE Deviant 5 50% 4 44% 9 47% 0.809
Normal 5 50% 5 56% 10 53%
P1 LE Deviant 3 30% 3 33% 6 32% 0.876
Normal 7 70% 6 67% 13 68%
P2 RE Deviant 3 30% 6 67% 9 47% 0.110
Normal 7 70% 3 33% 10 53%
P2 LE Deviant 6 60% 3 33% 9 47% 0.245
Normal 4 40% 6 67% 10 53%
P300 RE Deviant 8 80% 5 56% 13 68% 0.252
Normal 2 20% 4 44% 6 32%
P300 LE Deviant 6 60% 6 67% 12 63% 0.764
Normal 4 40% 3 33% 7 37%
Test: Chi-squared distribution
Caption: VD = vestibular dysfunction; PVD= Peripheral Vestibular Deficiency Deficiency; RE = rigth ear; LE = left ear; n = number of subjects
Table 6. Relation between the obtained results in the Vector Nystagmography (VD e PVD) and absolute latency (I, III and V) and interpeak interval (I-III, I-V e III-V) BAEP normal and deviant on both ears
BAEP VD PVD Total p
n % n % n %
I RE Deviant 4 40% 6 67% 10 53% 0.245
Normal 6 60% 3 33% 9 47%
I LE Deviant 9 90% 7 78% 16 84% 0.466
Normal 1 10% 2 22% 3 16%
III RE Deviant 8 80% 6 67% 14 74% 0.510
Normal 2 20% 3 33% 5 26%
III LE Deviant 8 80% 7 78% 15 79% 0.906
Normal 2 20% 2 22% 4 21%
V RE Deviant 8 80% 8 89% 16 84% 0.596
Normal 2 20% 1 11% 3 16%
V LE Deviant 7 70% 7 78% 14 74% 0.701
Normal 3 30% 2 22% 5 26%
I – III RE Deviant 8 80% 8 89% 16 84% 0.596
Normal 2 20% 1 11% 3 16%
I – III LE Deviant 9 90% 8 89% 17 89% 0.937
Normal 1 10% 1 11% 2 11%
III - V RE Deviant 10 100% 6 67% 16 84% 0.047
Normal 0 0% 3 33% 3 16%
III - V LE Deviant 9 90% 8 89% 17 89% 0.937
Normal 1 10% 1 11% 2 11%
I - V RE Deviant 4 40% 6 67% 10 53% 0.245
Normal 6 60% 3 33% 9 47%
I - V LE Deviant 7 70% 8 89% 15 79% 0.313
Normal 3 30% 1 11% 4 21%
Test: Chi-squared distribution
Table 7. Comparison between the obtained results in the Vector Nystagmography (VD e PVD) latency for each LLAEP (P1, N1, P2, N2 e P300) on both ears
LLAEP Rate Average Standard deviation Q1 Q3 n CI p
Right ear P1 VD 61.0 60 8.7 56 67 5 7.6 0.341
PVD 56.6 54 3.7 54 59 5 3.3
N1 VD 105.0 104 9.0 99 107 10 5.6 0.591
PVD 102.4 106 10.9 104 108 9 7.1
P2 VD 197.6 195 24.8 181 216 10 15.4 0.806
PVD 192.2 210 30.8 164 212 9 20.1
N2 VD 291.6 291 53.0 261 325 8 36.8 0.115
PVD 251.4 255 40.7 222 282 8 28.2
P300 VD 333.8 287 102.9 260 366 5 90.2 0.200
PVD 388.0 353 95.5 330 417 6 76.4
Left year P1 VD 62.3 64 8.0 57 68 7 5.9 0.192
PVD 57.7 56 4.5 56 60.5 6 3.6
N1 VD 103.8 103 6.0 98.5 109 10 3.7 0.651
PVD 103.8 108 10.5 98 112 9 6.9
P2 VD 204.7 216 25.1 188 226 9 16.4 0.215
PVD 192.3 206 23.1 168 208 9 15.1
N2 VD 289.5 289 32.2 261 304 8 22.3 0.462
PVD 266.9 283 43.0 236 298 8 29.8
P300 VD 344.0 328 93.7 271 376 6 75.0 0.361
PVD 399.4 341 130.3 300 460 5 114.2
Test Mann-Whitney
Caption: VD = vestibular dysfunction; PVD = Peripheral Vestibular Deficiency Deficiency; n = number of subjects; Q1 = first quartile; Q3 = third quartile; CI = Confidence interval
Table 8. Comparison between the obtained results in the Vector Nystagmography (VD and PVD) for BAEP absolute latencies (I, III e V) and interpeak intervals (I-III, I-V e III- V) on both ears
BAEP Rate Average Standard deviation Q1 Q3 n CI p
Right ear I VD 1.68 1.63 0.20 1.55 1.76 7 0.15 0.568
PVD 1.59 1.57 0.20 1.49 1.69 3 0.23
III VD 3.83 3.90 0.33 3.71 4.08 8 0.23 0.518
PVD 3.78 3.73 0.41 3.69 3.96 6 0.33
V VD 5.83 5.82 0..5 5.62 5.90 10 0.21 0.594
PVD 5.61 5.77 0.52 5.57 5.86 8 0.36
Left ear I VD 1.76 1.87 0.27 1.65 1.96 6 0.22 0.120
PVD 1.37 1.38 0.32 1.22 1.53 3 0.36
III VD 3.95 3.88 0.22 3.83 4.13 7 0.17 0.220
PVD 3.76 3.77 0.29 3.70 3.88 5 0.26
V VD 5.77 5.84 0.24 5.61 5.95 10 0.15 0.964
PVD 5.86 5.82 0.29 5.75 5.95 8 0.20
Right ear I - III VD 2.12 2.22 0.23 1.98 2.28 7 0.17 1.000
PVD 2.11 2.13 0.19 2.04 2.20 4 0.19
III - V VD 1.80 1.78 0.28 1.75 1.85 9 0.18 0.236
PVD 1.93 2.00 0.16 1.81 2.04 6 0.12
I - V VD 4.00 4.03 0.15 3.98 4.09 7 0.11 0.298
PVD 4.15 4.13 0.20 4.04 4.24 4 0.19
Left ear I - III VD 2.25 2.27 0.24 2.11 2.38 6 0.19 0.522
PVD 2.39 2.45 0.38 2.14 2.71 4 0.37
III - V VD 1.83 1.78 0.14 1.75 1.89 7 0.10 0.222
PVD 2.05 1.92 0.37 1.80 2.18 5 0.32
I- V VD 4.04 4.07 0.23 3.89 4.24 6 0.19 0.055
PVD 4.53 4.54 0.32 4.41 4.66 4 0.31
Test Mann-Whitney
DISCUSSÃO
By analysing the study participants’ characteristics, it was possible to observe a wide age range, which is similar to previous studies carried out with subjects with vestibular dysfunction(3,5,17). Considering that the alterations in the labyrinth may occur in different age groups, which vary from very young to elderly individuals, such wide age range evaluated(4) in this study is
justified. However, the participants’ ages were considered homogeneous in this sample, once the coefficient of variation
was under 50%.
Regarding LLAEP’s description, it is possible to note that all participants’ average was within the expected latency standards in every potentials and in both ears (Table 4). It is important to highlight once more that the increase in age in six individuals who were older than 60 years old was considered
to the classification in normal and altered in the P300 latency,
because it is known that ageing alone is capable of provoking potential(13) latency increase. Thus, a 2.85ms latency increase was considered for each year of life above 60(14) years of age on the amount used as the reference for adults(13). Thereby, only the ones who presented a latency superior to this sum or the ones that presented lack of potential remained altered, in order to eliminate interferences in the ageing process.
In connection with the general description of BAEPs, it showed itself normal on the absolute latencies average of the waves I, III and V only in the right ear (RE), since it showed an increased latency average of waves III and V in the left ear (LE), as well as in the interpeak interval I-III in both ears. Yet, such increase in the absolute latency was discreet, having the wave III of the LE 0.06ms higher in average considering the utilized normality standards, the wave V 0.09ms higher, the RE interpeak interval I-III with an average increase of 0.08ms and in the same interval of the RE, an increase of 0.28ms (Table 4).
By analysing the normal and the altered results of every AEP for the VD and PVD groups (Tables 5 and 6), connections with
the vestibular dysfunctions were not identified in LLAEP nor in BAEPs, in general, because of the lack of statistical significance.
There was an exception in one item that evidenced statistical
significance, showing prevalence of individuals with alteration
on the latency of the interpeak interval III-V of the RE. This fact supports the results of a study(5) that also found a difference in this same interval, although, when comparing the control groups
and PVD, the causes of this result is not defined by the authors.
Conversely, other authors(3) did not show alterations in the interpeak intervals of individuals with vestibular dysfunction, compared to normal individuals.
It is believed that discreet alterations on the central auditory pathways may have brought some changes on BAEPs associated to possible vestibular disorders, since the assessed individuals had tonal thresholds capable of eliciting all waves with expected latencies.
When comparing VD and PVD for the latency of every LLAEP (Table 7), an increase in the latency average of the cortical potentials (P1, N1, P2, N2) on the VD group and in the cognitive potential (P300) on the PVD group was determined, in
spite of the lack of statistical significance. Likewise, an increase
in the absolute latencies of BAEPs from the VD group and in interpeak intervals from the group PVD was observed, even if the latencies were within the expected, without statistical
significance in both groups (Table 8). Thus, an analysis of
the age range of the individuals with VD and with PVD was made in order to clarify whether the participants’ age could be contributing to the results or no. An average of 45 years of age for VD and of 54 years of age for PVD was discovered.
Thereby, if we think about the cognitive potential P300 that
may be influenced by the age increase, we may affirm that
it would be a cause for the increase of latency on the PVD group. However, it was previously reported that the age of the participants who are not older than 60 years old would not modify the research result. Yet, what would explain the fact that the youngest individuals from the VD group have greater latency for the cortical potentials?
Hence, it was possible to understand that the age of the individuals may not have been the main reason to cause such
results, but the classification of the individuals into VD or PVD
per se, which shows that the type of vestibular dysfunction may be the cause for change in the potentials, even if small among themselves.
In any event, these data support another study(3) in what concerns the BAEPs results, once they are within the normality patterns in both individuals with normal hearing and with hearing loss, in spite of the absolute latencies increase in relation to individuals with vestibular dysfunction. This study used a control group containing individuals with normal hearing thresholds and without complaint or vestibular alterations as reference.
Another study(5) also did not verify the BAEPs difference among one control group composed by individuals with vertigo complaints and normal vestibular exam and other two groups of individuals, one of them being with VD and another with PVD. However, the authors found BAEPs alterations in every group and suggested that the individuals with vertigo complaints may present BAEPs alterations. Yet, the study was carried out with individuals with hearing loss of no more than 55 dB HL on frequencies of 250 to 2000 Hz and no more than 60 dB HL on frequencies of 3000 to 6000 Hz, which may have interfered on the BAEPs results because, even if it might be carried out with peripheral losses of a moderate degree, hearing loss may alter the the register(18,19) morphology, diverging from the current study, which used hearing averages of no more than 25 dB HL on low frequencies and no more than 50 dB HL on high frequencies.
The same authors also carried out the P300 and found a connection between it and the PVD group. The current study
supports these results, even if statistical significance was not verified, once a latency increase was verified in this group.
Anyhow, a greater number of individuals with latency normality in both BAEPs and P300 was noted in the mentioned study,
which was not verified in the current study, since there was a
greater number of altered individuals, even without statistical
significance.
without statistical significance, suggest that the peripheral vestibular dysfunctions have certain influence on the BAEPs
and P300 results, when analysing together with the previously mentioned studies.
As for the cortical potentials, no study that had evaluated such potentials in individuals with vestibular dysfunction was found in the review of literature, which complicated the discussion
of these findings, as well as there are few new studies with the
remaining AEP. It is possible to understand this fact, because, if the clinical practice is analysed, the otoneurological assessment is basically composed by VENG, posturography, video-hit and Vestibular Evoked Myogenic Potential (VEMP). However, why does only a few of them talk about AEP? Why are not the AEP
used in clinical practice? Is it because there are no scientific
proof of such relation?
It is most likely that the answer is composed by the lack of
scientific evidence and because different anatomic structures are
involved in the assessment from VENG or AEP, for instance. Yet, we may question ourselves about what may such altered answers reveal us, since, if some studies found a connection(5) and
other did not find statistical relevance, but observed differences(3) (such as in the current study), it may tell us something that has no connection with the VD and PVD diagnosis, but with other symptoms or pathologies associated with the individuals who have vestibular dysfunctions, such as a ringing in the ears, which is very often reported by them, but was not considered in the current study.
Thus, it is important to consider that an analysis of other variables, such as ringing in the ears, cognition, attention, among others, may provide information about such doubts. If the importance of an individual to have good attention and cognition when taking the caloric trial to remain under this mental task,
aiming at maximizing the vestibulo-ocular reflex, and for the
performance of the P300, is taken into consideration, it would
be possible to infer that the individual who has difficulty in such matters may present P300 alterations, as well as influence the
caloric trial results, inhibiting the answer. This fact may suggest that an attention and cognition trial may help as a complement, in the sense of discarding these alterations on the trials and having a reliable answer about the potential relations and having the same response with BAEPs, if the individual has a ringing in the ear, since there are studies that show that the ringing can cause alterations in this potential(20,21). Besides, a study showed vestibular alterations in 21 out of 30 individuals with ringing in the ear and without vertigo complaints(17)
Another limitation verified in this study was the difficulty
in sample adherence to perform the procedure batteries,
specifically when one appeared in two distinct days with long
evaluation periods of time, which limited the sample size and
may have influenced the results that, although verifying a greater
alteration number, did not show statistical relevance. Hence, it is believed that studies with a bigger sample may reveal other information about the presence or lack of contribution of AEP on otoneurological assessment, as well as the use of complementary evaluations that discard other associated alterations, as in the Ménière’s disease case in which the individuals may have vertigo and lightheadedness(3).
Although there was no statistical significance shown in the
results, it is not possible to deny the fact that there were some alterations that could give us complementary information. For instance, other systems may be affected in lightheaded individuals and not necessarily caused by the VD and PVD diagnosis, but by other associated symptoms or pathologies and that may help in different treatments or conducts and, so, they may contribute to clinical evaluation of individuals with vestibular dysfunctions.
CONCLUSION
There was no significant relation of VD and PVD with
hearing potentials, although, on LLAEP, the individuals with VD showed greater latency on cortical potentials (P1, N1, P2, N2) and the individuals with PVD showed greater cognitive potential latency (P300). On BAEPs, there was an increase of the absolute latencies on the VD group and on the interpeak intervals on PVD. Therefore, it is believed that other factors associated to vertigo may have contributed to this result.
REFERENCES
1. Rocha PR Jr, Kozan ES, Moraes JF, Pereira FG, Moreno AB. Reabilitação vestibular na qualidade de vida e sintomatologia de tontura de idosos. Cien Saude Colet. 2014;19(8):3365-74. http://dx.doi.org/10.1590/1413-81232014198.11082013. PMid:25119076.
2. Ferreira LMBM, Ribeiro KMOBF, Pestana ALS, Lima KC. Prevalência de tontura na terceira idade. Rev CEFAC. 2014;16(3):739-46. http://dx.doi. org/10.1590/1982-021620142913.
3. Munaro G, Silveira AF, Rossi AG, Korbes D, Finkler AD. Contribuição do potencial evocado auditivo em pacientes com vertigem. Rev Bras Otorrinolaringol. 2010;76(3):384-91.
4. Mor R, Fragoso M. Vestibulometria na prática fonoaudiológica. São Paulo: Pulso; 2012.
5. Matas CG, Silva SM, Wen DDM, Nunes CS, Sanches SGG. Potenciais evocados auditivos em indivíduos com syndrome vestibular periférica. Arq Int Otorrinolaringol. 2011;15(3):308-13. http://dx.doi.org/10.1590/ S1809-48722011000300007.
6. Munhoz MSL, Silva MLG, Ganança MM, Caovilla HH. Evidências de distúrbio otoneurológico na história clínica. In: Ganança MM, Munhoz MSL, Caovilla HH, Silva MLG, editores. Otoneurologia ilustrada. São Paulo: Ateneu; 2005. p. 3-4.
7. Ganança FF, Fukujima MM, Duarte JA, Bezerra KC, Alves NS, Jomori R, et al. Sinais e sintomas vestibulares e doenças do sistema nervoso central. Rev Equilíbrio Corporal Saúde. 2016;8(1):33-40.
8. Welsh LW, Welsh JJ, Rosen LG. Evaluation of vertigo byauditory brainstem response. Ann Otol Rhinol Laryngol. 2002;111(8):730-5. http://dx.doi. org/10.1177/000348940211100813. PMid:12184596.
9. Ahmed I. Brainstem auditory evoked potentials indizziness. Clin Electroencephalogr. 1984;15(2):110-5. http://dx.doi.org/10.1177/155005948401500208. PMid:6610504.
10. Eggermont JJ, Don M, Brackmann DE. Electrocochleography and auditory brainstem electric responses in patients with pontine angle tumors. Ann Otol Rhinol Laryngol Suppl. 1980;89(6):1-19. http://dx.doi. org/10.1177/00034894800890S601. PMid:6779693.
12. Cassvan A, Ralescu S, Moshkovski FG, Shapiro E. Brainstem auditory evoked potential studies in patients with tinnitus and/or vertigo. Arch Phys Med Rehabil. 1990;71(8):583-6. PMid:2369295.
13. Didoné DD, Oppitz SJ, Folgearini J, Biaggio EPV, Garcia MV. Auditory evoked potentials with different speech stimuli: a comparison and standardization of values. Int Arch Otorhinolaryngol. 2016;20(2):99-104. http://dx.doi.org/10.1055/s-0035-1566133. PMid:27096012.
14. Cóser MJS, Cóser PL, Pedroso FS, Rigon R, Cioqueta E. P300 auditory evoked potential latency in elderly. Braz J Otorhinolaryngol. 2010;76(3):287-93. PMid:20658005.
15. Brown WS, Marsh J, La Rue A. Exponential electrophysiological aging: P300 latency. Electroencephalogr Clin Neurophysiol. 1983;55(3):277-85. http://dx.doi.org/10.1016/0013-4694(83)90205-5. PMid:6186459. 16. Reis ACMB, Frizzo ACF, Isaac ML, Garcia CFD, Funayama CAR, Iório
MCM. P300 em indivíduos com perda auditiva sensorioneural. Rev Bras Otorrinolaringol. 2015;81(2):126-32. http://dx.doi.org/10.1016/j. bjorl.2014.10.001.
17. Almeida LD, Mitre ED, Lemos L, Simões ECC. Vestibulometria em indivíduos com zumbido e exames audiológicos normais. Rev CEFAC. 2005;7(3):382-7.
18. Watson DR. A study of the effects of coclear loss on the auditory brainstem response (ABR) specificity and false positive rate in retrococlear assessment.
Audiology. 1999;38(3):155-64. http://dx.doi.org/10.3109/00206099909073017. PMid:10437686.
19. Matas CG, Leite RA, Gonçalves IC, Neves IF. Brainstem auditory evoked potential in individuals with conductive and sensorineural hearing losses. int Arch Otorhinolaryngol. 2005;9(4):280-6.
20. Kehrle HM, Granjeiro RC, Sampaio AL, Bezerra R, Almeida VF, Oliveira CA. Comparison of auditory brainstem response results in normal-hearing patients with and without tinnitus. Arch Otolaryngol Head Neck Surg. 2008;134(6):647-51. http://dx.doi.org/10.1001/archotol.134.6.647. PMid:18559734.
21. Schaette R, McAlpine D. Tinnitus com um audiograma normal: evidência fisiológica para perda auditiva oculta e modelo computacional. J Neurosci. 2011;31(38):13452-7. http://dx.doi.org/10.1523/JNEUROSCI.2156-11.2011. PMid:21940438.
Author contributions