Auditory Middle Latency
Evoked Responses: A
Standardizing Study
Summary
Francisco Sales de Almeida1, Paulo RobertoPialarissi2, Luiz Eduardo Ferreira Paiva Júnior3,
Maria Aparecida Oliveira Almeida4, André Silva5
1 PhD at USP/SP, member of the medical staff at the Odontomed Hospital.
2 Doutor em Otorrinolaringologia pela USP, Professor Titular da Pontifícia Universidade Católica de São Paulo. 3 Graduando em Medicina, Acadêmico da Faculdade de Medicina de Itajubá.
4 Pós-graduanda em Audiologia pelo CEDIAU, Fonoaudióloga do Hospital Odontomed. 5 Graduando em Medicina, Acadêmico da Faculdade de Medicina de Itajubá.
Hospital Odontomed.
Endereço para correspondência: Francisco Sales de Almeida - Rua Major Belo Lisboa 88 sala 307 Centro Itajubá MG 37500-000. Paper submitted to the ABORL-CCF SGP (Management Publications System) on July 4th, 2005 and accepted for publication on February 20th, 2006.
T
he presence of auditory middle latency evoked responses allows us to make an evaluation of the peripheral and central auditory system integrity , as well as the nucleus and auditory ways existing until the level of the thalamus-cortical region and primary auditory cortex. Aim: Our objective is to evaluate the presence or not of this numerous peaks, as well as, their latencies and intervals and extend to make a standardizing study. Way of study: Contemporary study of Coorte with transversal cut and the outline was quantitative, descriptive e non experimental. Material and method:Studying several peaks, positives and negatives, caused by the middle latency auditory potentials, in a population of young adults individuals, ranging from 18 to 30 years old, from both genders, with normal hearing. It was used a monoauricular resonant stimulation and a capitation, separately, in both cerebral hemispheres, with surface electrodes. Result: In this research was verified that the analyzed crossings did not present statistically significant results and it was stipulated a pattern from the obtained results. Based on the non-statistical difference found we can affirm that to the Po waves was obtained respectively an average and standard deviation of 12,09 and 1,84; for Na 17,91 and 2,60; for Pa 29,41 and 5,66; for Nb 41,43 and 8,89; to for 51,44 ms e 12,63 and finally to the interval Na-Pa 11,52 and 4,99. Conclusion: 1- The presence of the defluxions Po, Na, and Pa was verified in all the registers, whereas the defluxions Nb and Pb were absent in only 06 registers. 2- By having these registers, we evaluated that the inveiglement of these defluxions can be used as a reliable method to detect the average latency of the auditory potentials, by electrical generated activities, possibly in sites located in the thalamus-cortical area, evoked by sonorous stimulation. From that point, we establish a pattern of responses for young ones with normal hearing, helping us with future studies in patients with alterations in the hearing system.
Key words: Auditory middle latency response. Auditory po-tentials. Auditory electrophysiology.
ORIGINAL ARTICLE Rev Bras Otorrinolaringol
INTRODUCTION
It is highly important to capture auditory middle latency evoked potentials (AMLR) in trying to objectively enhance auditory function assessment in patients with hearing loss, both to determine auditory limits and to study the latency period and values of the amplitudes related to its various deflections.
These potentials represent a series of deflections, positive and negative, which occur between 10 and 18 ms after the beginning of the auditory stimulus, which are located after brain stem evoked potentials, preceding late responses, related to cortical and cognitive functions.
These responses were registered for the first time at the “Massachusetts Institute of Technology” by Geisler et al.1, in 1958, using at the time, a computerized device
for measuring responses. These authors infer that the waves observed in their work were representative of auditory afferent activities related anterior regions in the brain cortex.
Nevertheless, in 1963, these responses were consid-ered generators purely of myogenic potentials2. For this
reason, these potentials were no longer being deemed val-uable for the evaluation of afferent auditory pathways.
From 1967 on there have been studies demonstrat-ing the clinical applicability of these responses3, which
has been supported by registries with surface electrodes obtained from patients who underwent brain surgeries.
In 1974, various waves were described, elicited by sound stimuli, among which, N18 (Na), P30 (Pa) and P50 (Pb), already trying to distinguish and separate them from the purely myogenic responses, such as the ones that occur by contraction of the post auricular and temporal muscles5.
Later studies6 have shown the presence of these
waves even under muscle paralysis obtained through the administration of succinylcholine. These observations were reinforced by other following studies in which an anesthetic agent (Fentanyl) was used associated to pan-curonion which led to muscular anesthesia7.
Various authors, from then on, have done studies related to the latency wave generating sites between 10 and 80 ms, both in animals, differentiating the contributions of the primary sensorial portions from those originated in the extraleminiscal pathways of the auditory system, for example, reticular substance, suggesting the importance of the thalamus cortical8 pathways, and in patients subject
to neurosurgeries, using surface electrodes, describing in detail the various waves and their starting points9.
Despite of such evidences, the more systematized studies on these responses used to evaluate the afferent auditory pathways only started to gain importance at the late 80’s.
In our field of study, we may mention one on the
auditory electrical potentials of middle latency in nor-mal fenor-male individuals, with the objective of determin-ing latency times for positive deflections (Pa, Pb e Pc) and negative deflections (Na, Nb, Nc) in relation to the stimulated side and the frequency in which each of these deflections are seen10, and, more recently, another study
detecting these responses in children and teenagers with normal hearing11.
Various authors consider that the capture of auditory middle latency potentials have great clinical applicabil-ity in various situations, such as the electrophysiological determination of the auditory limits in the low frequency range, in evaluating the functioning of cochlear implants, to evaluate how the auditory pathways are functioning, the location of lesions in the auditory pathways and some intraoperative applications12.
These evoked potentials may be utilized for the evaluation of information processing, as we have seen studies, when analyzing concomitantly the auditory mid-dle latency potentials in the somatosensorial and auditory modalities, more specifically P50, in healthy male indi-viduals. This study supports the theory of deficiency in the processing of information in squizofrenic individuals (defect in P50)13.
Trying to explore other aspects of information processing, the habituation of evoked auditory responses was studied (P50) utilizing repetitive stimuli. We observed, then, that the amplitude of the P50 response to the second of two homologous stimuli was significantly less reduced in patients with migraine then in healthy volunteers14.
It was suggested that the ascending reticular activity seems to be affected in some patients when studying the auditory middle latency evoked potentials in patients with obstructive sleep apnea syndrome, before and after treat-ment. After the apnea treatment, there was a significant improvement in the nocturnal hypoxia and also an increase in middle latency P1 peak width and these potentials had a better distribution on its electric field on the scalp15.
The capture of auditory responses from the brain stem and the auditory responses of middle latency have also been used to study a group of patients with tinnitus, in comparison with registries obtained from normal and from older individuals. In the tinnitus and elderly individuals groups, when looking at brain stem potentials, changes in relation to the VII wave were observed, and in regards of the middle latency potentials, many wide waves occurring in some of the components of this group were observed, but not in all of them. There has been, also, the widening of these middle waves without the corresponding widen-ing of brain stem potentials. This suggests, in the authors’ opinion, that there could be a selective middle latency wave generator in patients with tinnitus and distinct effects of age over cochlear physiology16.
mid-dle latency evoked potentials through electroencephalic registers and through magnetoencephalic data suggest multiple supra temporal sources for the various deflection s observed. Are correlated, then, Pa (28ms) to the medial portion of Heschl’s gyrus; Nb (40 ms)/Pb1 (52 ms) to the lateral face of the supratemporal gyrus; and Pb2 (74 ms) to the anterolateral portion of the Heschl’s gyrus17. These
findings are in accordance with previously invasive in-tracerebral registries and with studies in animals, which describe the secondary areas involved in the generation of auditory middle latency evoked components.
The capture of these responses may be impacted by external agents, such as alcoholic beverages18 or
an-esthetic drugs19.
We may register them to study patients with hear-ing disability20.
Also studying the auditory short, middle and long latency evoked potentials, it was verified the reliance of the registry of these potentials, when doing the test-retest pro-cedure, in a one year time frame, both in young adults and in elderly individuals (between 21 and 92 years old)21.
When doing the simultaneous capture of intracer-ebral auditory evoked potentials directly from the auditory cortex and the median geniculated body22 in a patient, it
was seen an initial negative response generated at the level of the median geniculated body, with latency around 13.5 ms, and two positive peaks (P21 and P29), with wider ranges for low frequency sounds suggesting, then, the ex-istence of a possible tonotopic organization of this nucleus. It is observed, also, that peaks originated in the thalamus activity were strongly overlapped with the cortical activity registered on the Heschl’s gyrus before the 30 ms period (with N13 preceding the first cortical component in 3.5 ms; whereas P21 and P29 precede and follow, respectively, in relation to the two cortical responses that follow, which show reverse polarity, in a 1.5 - 2 ms interval). This study shows new functional data over the activity of the median geniculated body and suggests a more complex role of the thalamus in sound perception.
One may also infer that the capture of these poten-tials is extremely useful to evaluate patients with cochlear implants2, since these can be produced through electric
waves, having the advantage over brain stem potentials, because its latency periods are bigger and are not mistaken for the generating stimuli.
These potentials represent an important tool to eval-uation brain function, not only from an auditory perspec-tive, but also in patients with neurological involvement, as has been demonstrated in various studies with comatose patients or patients who suffered head trauma24.
In the last years many scientific studies have been done, showing that these potentials are related to the nu-clei and the auditory pathways situated in the thalamus cortical region and the primary auditory cortex, mainly
the thalamus-cortical25,26,27.
Nevertheless, in our country, little has been pro-duced on this matter.
We still lack a higher standardization for our popula-tion, as to the appearance of various positive (Po, Pa and Pb) and negative (Na, Nb) deflections, according to their order of appearance, its respective latencies and ampli-tudes and on what relates to the stimulation of only one ear or both, concomitantly. Taking these data as our basis, we can create a test protocol adapted to our reality, with the goal of studying the variables which would interfere in the capture of the middle latency potentials, using auditory stimuli, either with a click or with tone burst.
Based on these evidences, we propose to study a group of normal patients and evaluate the presence of various deflections corresponding to the auditory middle latency potentials, as well as its latencies and amplitudes, with the following objectives:
1 - Identify the positive and negative deflections on the traces of the auditory middle latency evoked responses (situated between 10 ms and 80 ms after the sound stimuli) in a population of young adults, with normal hearing.
2 - Analyze the characteristics of these responses (latency of each deflection and Na-Pa interval) and do its standardization for the population studied.
MATERIALS AND METHODS
The alignment was quantitative, descriptive, and non-experimental. It was a contemporary cross-sectional cohort study. The data were collected in the laboratory. The study was a comparison among individuals.
The sample was a group of 50 individuals, young adults of both genders, being 34 male and 16 female sub-jects, living in Itajubá. The subject of the study was the individual. The sampling was a non-probabilistic one and by convenience. The exams took place in Odontomed Ita-jubá Hospital, in the department of otorhinolaryngology. As inclusion criteria, young adults were studied, with ages ranging between 18 and 30 years old, with normal hearing and without previous history of otological and/or neurological diseases.
The history of the participating individuals was obtained, and they went through clinical otological in-spection, acoustic immittance measurements, stapedian reflex study, conventional tonal audiometry (frequencies tested between 250 Hz and 8000 Hz) and logoaudiometry to assure auditory health.
The capture of middle latency potentials was done with both the equipment and the individuals situated inside an acoustic sound proof booth, to avoid electrical interfer-ences of any nature (for example, static electricity). With this, there would only remain the proper interferences of the individuals being tested or the examiner.
through additional care measures. The electrodes, as well as the earphones, were positioned by the examiner, after instructing the individual. The environmental conditions in the booth (temperature, light, silence, positioning) were the most adequate to maintain the individual comfortable and relaxed, without, though, allowing the person to fall asleep. The electrodes were placed, after careful skin cleansing, with adequate electrolytic paste, allowing for a better capturing of the potentials being studied. The exam was only started when the base line of the electroencepha-logram was stable, without interferences.
The equipment used is the operational system CE - EP 25. The label CE indicates that “Interacoustics AS” meets the requirements of the VI annex of medical direc-tions 93/42/EEC and the equipment was approved by TÜV, with identification nº 0123.
This equipment, additionally, consists of:
• Electrodes: one as live, two as references and another as ground (indifferent) allowing for the individual analysis of each brain hemisphere.
• Pre-amplifier: EPA 25, with two channels, obtain-ing a gain of up to 80 dB, which works within a range of frequency up to 8,000 Hz.
• Impedance measurer: with information regarding each electrode individually.
• Sound stimulator: the stimuli might be presented ranging from 1.1 to 80.1/sec, through earphones 3A ABR with insertion modes, calibrated in an IEC 126 coupler or earphones TDH 39. It produces “clicks” of 100 mms in three polarities (condensation, rarefaction, alternate) and tone burst in the frequencies 500; 1,000; 2,000; 3,000 and 4,000 Hz. Level of stimulation between 20 and 130 dB. Sound pressure level- “SPL” (-10 to 100 dB Hearing Level “HL”). White masking noise, calibrated in SPL, with a mask-ing levels from 0 to 40 dB relative to the stimulus.
• Recording: up to 900 ms, with a gain of 74 to 104 dB (automatic or manual selection). Has low pass filters (none or ranging from 17 Hz up to 12,000 Hz), high pass filters (none or ranging from 0.83 Hz up to 500 Hz) and analogue filters (from 0.5 Hz).
• Operational system: Windows 98.
The exam protocol used in our research, to capture middle latency potentials, was as follows:
• Stimulus: “click”, of 100 ms duration, with alter-nate polarity, without the use of masking, in a frequency of 7 stimuli per second, up to a total of 1,000 stimuli.
• Intensity of the stimulus: 70 dB SPL, presented through ear phones TDH 39.
• Electrodes: the ground electrode placed on the glabellum, the live electrode placed on the superior por-tion of the scalp, halfway between the cranial top and the mastoid region, over each cerebral hemisphere, and two “reference” electrodes, each placed over each ear lobe.
• Impedance: electrode impedance around 2W,
being acceptable up to a maximum of 3W. • Registration period: from 0 to 80 ms.
• Filters: 10 Hz high pass filters and 1,200 Hz low pass filters were used.
• Reproducibility index: 95% • Mono-aural stimuli
• Sequence of stages of the stimuli and capture of answers:
Stimulation Capture (*placement of the live elec-trode)
1. Right Ear Right Brain Hemisphere (RERH) 2. Left Ear Right Brain Hemisphere (LERH) 3. Right Ear Left Brain Hemisphere (RELH) 4. Left Ear Left Brain Hemisphere (LELH)
This way, we made 4 isolated registries in each of the 50 individuals, to a total of 200 registries of auditory middle latency evoked potentials.
Results obtained in each of the stages mentioned above were plotted separately, being compared to the results obtained from each of the stages.
Study parameters of the auditory middle latency responses (latency and intervals) were processed electroni-cally, using MS Excel.
We considered, for analysis, the positive and nega-tive deflections which were shown within the time frame from 10 ms to 80 ms after the sound stimulus. The positive deflections were named Po, Pa and Pb, while the nega-tives were named Na and Nb, according to the order of appearance. The latencies and the intervals were measured in milliseconds (ms).
The results obtained were subject to descriptive statistical analysis consisting of independent variables: percentages, frequencies, standard deviation, average and number of validated cases. The “Student t test” was used with acceptance of the significance level below 0.05.
We established variables overlapping: Po, Na, Pa, Nb, Pb waves and Na-Pa interval latencies, respectively on the sequences RERH, LERH, RELH and LELH, to establish its significance level
The relevance of the study is to establish a normality standard for different variables (latencies and intervals) in relation to various registered waves.
All the participants were explained the procedures to which they would be submitted and research goals, having accepted to participate in the study.
This study consisted of non-invasive evaluations which did not lead to any damage to the patient.
The research, which involved the participation of human beings, followed strictly the ethical rules established according to resolution no 196/96, of October 10, 1996 by the National Health Council, of the Health Ministry.
RESULTS
The registry of the variables (latency of each Na-Pa interval) were obtained almost totally from the individuals examined, and can be seen on table 1.
On this table we show the values corresponding to the averages of each deflection latency, positive and negative, and that of the interval Na-Pa. Also are shown the minimum and maximum values, and the Standard deviation for each of these variables. It also shows the number of examinations valid for this analysis.
The Standard deviation, for each of the variables, is presented on graph 1, representing the four forms of study, RERH, LERH, RELH and LELH.
Four tests were made with each Individual, adding to a total of 200 tests in a whole. As seen on table 2, the Po, Pa and Na deflections were registered in all tests, while the deflections Nb and Pb were absent in 6 tests.
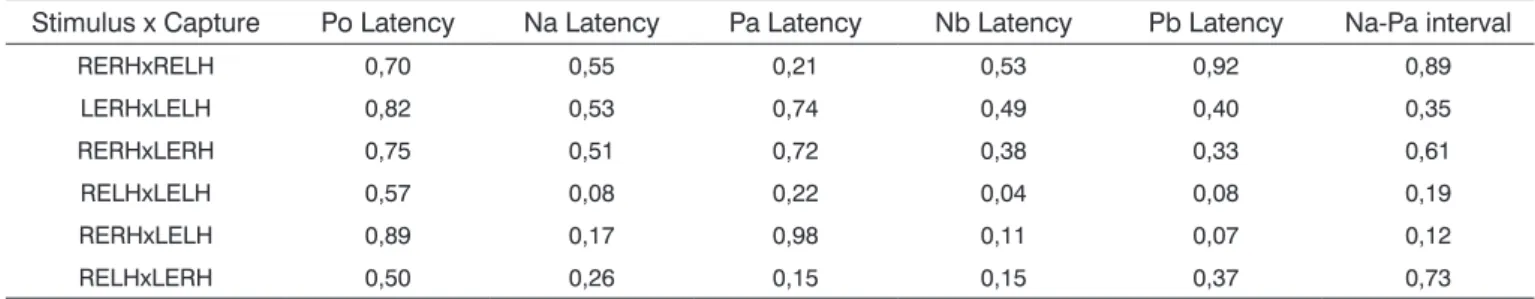
On table 3, we see the significance values in rela-tion to response overlapping obtained from each stage of stimulation and capture.
DISCUSSION
We can detect the presence of various deflections, positive and negative, in a period from 10 ms to 80 ms after the sound stimulus, in the almost totality of the registries, within the parameters observed by other authors11,17,22. This
makes the middle latency potentials capture examination an important tool used in the functional and topographic diagnostics of auditory lesions12,20, as well as in examining
information processing13,14.
We have adopted, in our study, the nomenclature accepted by various authors considering the many deflec-tions according to the latency period. Thus the positive waves were named Po, Pa and Pb, and the negative waves were named Na and Pa5,9,10.
The Po, Na and Pa deflections were present in all 200 registries, while the Nb and Pb deflections were absent from 6 registries.
Since no statistically significant difference was found, we may infer that the response found is similar in all the values studied. Based on this statement, all other values obtained from the captures, RERH, LERH, RELH and
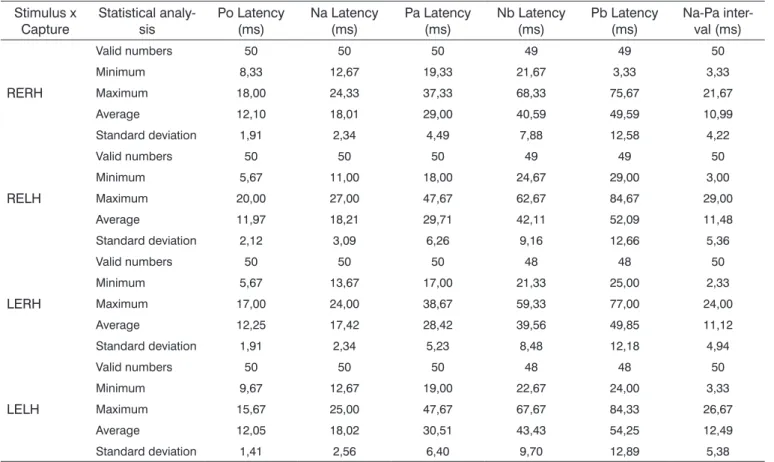
Table 1. Analysis of registries obtained in relation to the latency of each wave (Po, Na, Pa, Nb and Pb) and the Na-Pa interval, with minimum and
maximum values, their averages and Standard deviations related to the individuals participating in the study.
Stimulus x Capture
Statistical analy-sis
Po Latency (ms)
Na Latency (ms)
Pa Latency (ms)
Nb Latency (ms)
Pb Latency (ms)
Na-Pa inter-val (ms)
RERH
Valid numbers 50 50 50 49 49 50
Minimum 8,33 12,67 19,33 21,67 3,33 3,33
Maximum 18,00 24,33 37,33 68,33 75,67 21,67
Average 12,10 18,01 29,00 40,59 49,59 10,99
Standard deviation 1,91 2,34 4,49 7,88 12,58 4,22
RELH
Valid numbers 50 50 50 49 49 50
Minimum 5,67 11,00 18,00 24,67 29,00 3,00
Maximum 20,00 27,00 47,67 62,67 84,67 29,00
Average 11,97 18,21 29,71 42,11 52,09 11,48
Standard deviation 2,12 3,09 6,26 9,16 12,66 5,36
LERH
Valid numbers 50 50 50 48 48 50
Minimum 5,67 13,67 17,00 21,33 25,00 2,33
Maximum 17,00 24,00 38,67 59,33 77,00 24,00
Average 12,25 17,42 28,42 39,56 49,85 11,12
Standard deviation 1,91 2,34 5,23 8,48 12,18 4,94
LELH
Valid numbers 50 50 50 48 48 50
Minimum 9,67 12,67 19,00 22,67 24,00 3,33
Maximum 15,67 25,00 47,67 67,67 84,33 26,67
Average 12,05 18,02 30,51 43,43 54,25 12,49
Standard deviation 1,41 2,56 6,40 9,70 12,89 5,38
Obs. RERH: right ear right cerebral hemisphere, RELH: right ear left cerebral hemisphere, LERH: left ear right cerebral hemisphere, LELH: left
LELH, were added up establishing one only average and standard deviation value for each variable.
For the Po wave, we obtained, respectively, the average of the latency period and the standard deviation corresponding to the values of 12.09ms and 1.84; for the Na wave, 17.91 ms and 2.60; for the Pa 29.41 ms and 5.66; for Nb 41.43 ms and 8.89 and for Pb 51.44 ms and 12.63.
In relation to the Na-Pa interval, the average value was 11.52 ms and the standard deviation was 4.99.
Table 2. Analysis of the registries obtained in relation to the latency of each wave (Po, Na, Pa, Nb and Pb) and the Na-Pa interval, with minimum
and maximum values, their averages and Standard deviations related to the individuals participating in the study and adding the valid registries pertinent to each wave.
Stimulus x
Capture Statistical analy-sis Po Latency (ms) Na Latency (ms) Pa Latency (ms) Nb Latency (ms) Pb Latency (ms) Na-Pa inter-val (ms)
All
Valid numbers 200 200 200 194 194 200
Minimum 5,67 11,00 17,00 21,33 3,33 2,33
Maximum 20,00 27,00 47,67 68,33 84,67 29,00
Average 12,09 17,91 29,41 41,43 51,44 11,52
Standard deviation 1,84 2,60 5,66 8,89 12,63 4,99
Table 3. Analysis of the registries obtained in relation to the latency of each wave (Po, Na, Pa, Nb and Pb) and the Na-Pa interval of the various
capture positions in individuals participating in this study through Student “t” test.
Stimulus x Capture Po Latency Na Latency Pa Latency Nb Latency Pb Latency Na-Pa interval
RERHxRELH 0,70 0,55 0,21 0,53 0,92 0,89
LERHxLELH 0,82 0,53 0,74 0,49 0,40 0,35
RERHxLERH 0,75 0,51 0,72 0,38 0,33 0,61
RELHxLELH 0,57 0,08 0,22 0,04 0,08 0,19
RERHxLELH 0,89 0,17 0,98 0,11 0,07 0,12
RELHxLERH 0,50 0,26 0,15 0,15 0,37 0,73
Despite not having done a research study over points of generation for the various waves, we may infer that based on their latency periods, these deflections are generated in sites located in the thalamus cortical region and primary auditory cortex and/or primary cortical re-gions, as we have widely seen in the literature8,9,17,22.
We believe, then, that these various waves are generated from sound stimulation in afferent auditory pathways anterior to the brain cortex, as initially observed
by Geissler et al. in 19581.
Based on these statements, we may consider the registries of the Po, Na and Pa deflections fundamental to verify the integrity of the auditory pathways, to a thalamus cortical and primary auditory cortex region level12,25-27.
Thus, this study could be used still as a method of evaluation of patients with neurological problems (such as head trauma or coma)4,24, as well as to follow up
individu-als with cochlear implants12,23 or, even, in the topographic
evaluation of patients with tinnitus16. These matters might
be subject for later studies.
As referred to in the literature, these potentials tend to maintain the same registration standard through the test-retest research within a time frame of one year21,
indicating a high level of confidence.
We have analyzed the registries obtained in
rela-tion to the locarela-tion of the auditory potentials considering the positioning of the electrodes, over the specific region of each brain hemisphere. When these results obtained overlapped we could not notice any significant differences between one capture region and another.
We have observed the possibility of capture at the same time of both the auditory middle latency evoked responses (nuclei and auditory ways of the subcortical and primary cortical regions) and the auditory short latency evoked responses (nuclei and auditory ways of the brain stem). This makes the present this study a tool of extraor-dinary importance in daily clinical practice.
allows us to electrophysiologically evaluate the auditory level of the individual, and gives us the possibility of a broader way of establishing the lesion area, in case of retrocochlear diseases.
The responses obtained after a stimulus on one ear and with ipsilateral capture, when overlapped with the responses obtained from the other ear under the same conditions, and also, when overlapped with the responses obtained counterlaterally, do not bear statisti-cal significance.
The analysis of the amplitudes for each isolated wave or in a composition of two of them (for example: Na-Pa) will be made in another study, for verification of its significance and importance, through specificity and sensitivity.
We haven’t done research over these potentials under the use of drugs or on patients under anesthesia, although these situations might become topics for future studies18,19.
The similarity of answers of the standard deviations presented in graph 1 reflects that there is little difference between data spread referring to the specific variables analyzed, and that this difference, as shown in table 3, has no statistical significance. The answers ingraph1 illustrate that the values of each of the variables are dispersed in a similar way for stimuli in either ear and in captures from any hemisphere in patients with normal hearing and with no previous history of any retrocochlear disorder.
From this data we may infer that a retrocochlear dis-ease might alter these values in a significant way, making it
possible, in the future, to create clinical and/or laboratory standards of specific middle latency potential. This type of exam will, in clinical practice, establish a disorder in the auditory anatomy and physiology, allowing for a sensitive or even specific exam.
CONCLUSION
We may conclude that:
1. The presence of Po, Na and Pa deflections in all registries was shown, with an average of the latency pe-riod of 12.09 ms for Po, 17.91 ms for Na and 29.41 ms for Pa; while Nb and Pb deflections were absent from only 6 registries, and the averages of their latency periods were 41.43 ms and 51.44 ms respectively. The average of the Na-Pa interval was 11.52ms.
2. Through these registries, we conclude that the capture of these deflections give us a reliable method to detect auditory middle latency potentials, occurring from electric activity generated, possibly, in sites located in the thalamus-cortical region, evoked with the use of sound stimuli. Based on that, we established a response standard, among us, for young individuals, with normal hearing, allowing us to further study patients with alterations in the auditory system.
REFERENCES
1. Geisler C, Frishkopf LS, Rosenblith WA. Extracranial responses to acoustic clicks in man. Science 1958;128:1210-1.
2. Bickford RG, Galbraith RF, Jacobson JL. The nature of averaged evoked potentials recorded from the human scalp. Electroenceph Clin Neurophysiol 1963;15:720.
3. Goldstein R, Rodman LB. Early components of averaged evoked responses to rapidly repeats auditory stimuli. J Speech Hear Res 1967;10:6.
4. Celesia GG, Broughton RJ, Rasmussen TH, Branch C. Auditory evoked response from the exposed human cortex. Electroenceph Clin Neu-rophisiol 1968;24:458-66.
5. Picton TW, Hillyard SA, Krausz HI, Galambos R. Human auditory evoked potentials: Evaluation of components. Electroenceph Clin Neurophysiol 1974;36:179-90.
6. Harker LE, Hosick E, Voots RJ, Mendel M. Influence of succinilcholine on middle component auditory evoked potentials. Arch Otolaryngol 1977;103:133-7.
7. Kileny PR, Berry DA. Selective impairment of late vertex and middle latency auditory responses. In: Menches G, Gerber S, Editores. The Multiply Handicapped Hearing Impaired Child. New York: Grune and Sttraton; 1983.
8. Mcgee, T, Ozdamar O, Kraus N. Auditory middle latency responses in the guinea pig. Am J Otolaryngol 1983;4:116-22.
9. Lee YS, Lueders H, Dinner DS, Lesser RP, Hahn J, Klen G. Recording of auditory evoked potentials in man using chroni subdural electrodes. Brain Res 1984;197:115-31.
10. Matas CG, Barbosa MSM, Munhoz MS, Fukuda Y. Potenciais elétricos auditivos de média latência: estudo em indivíduos normais do sexo feminino. Rev Bras Otorrinolaringol 1994;94:102-4.
11. Sclochat A. Resposta de latência média em crianças e adoles-centes normo-ouvintes. Pró-Fono Revista de Atualização Científica 2003;15:65-74.
12. Kraus N, Kileny P, Mcgee T. Middle Latency Auditory Potentials. In: Katz J. Editor. New York: Lippincott Williams & Wilkins; 1999.
Graph 1. Analysis of the registries obtained for each wave (Po, Na, Pa,
p.384-402.
13. Arnfred SM, Eder DN, Hemmingsen RP, Glenthoj BY, Chen AC. Gatting of the vertex somatosensory and auditory evoked potential P50 and the correlation to skin conductance orienting response in healthy men. Psychiatry Res 2001;101:221-35.
14. Ambrosini A, De Pasqua V, Afra J, Sandor PS, Schoenen J. Reduced gating of middle-latency auditory evoked potentials (P50) in migraine patients: another indication of abnormal sensory processing. Neurosci Lett 2001;306:132-4.
15. Miyamoto T, Miyamoto M, Takekkawa H, Kubo J, Hirata K, Katayama S. A comparison of middle latency auditory-evoked response in ob-structive sleep apnea syndrome before and after treatment. Psichiatry Clin Neurosci 2001;55:251-2.
16. Gerken GM., Hesse PS, Wiorkowski JJ. Auditory evoked responses in control subjects and in patients with problem-tinnitus. Hear Res 2001;157:52-64.
17. Yvert B, Crouzeix A, Bertrand O, Seither-Preisler A, Pantev C. Multiple supratemporal sources of magnetic and electric auditory evoked mid-dle latency components in humans. Cereb Cortex 2001;11:411-23. 18. Nicholas CL, Sullivan EV, Pfefferbaum A, Trinder J, Colrain IM. The
effects of alcoholism on auditory evoked potentials during sleep. J Sleep Res 2002;11:247-53.
19. Alpiger S, Helbo-Hansen HS, Jensen EW. Effect of sevoflurane on the mid-latency auditory evoked potentials measured by a new fast extracting monitor. Acta Anaesthesiol Scand 2002;46:252-6.
20. Hesse PA, Gerken GM. Amplitude-intensity functions for auditory middle latency responses in hearing-impaired subjects. Hear Res 2002;166:143-9.
21. Waldhovd KB, Fjell AM. One year test retest reliability ERPs in young and old adults. Int J Psychophysiol 2002;46:29-40.
22. Yvert B, Fischer C, Guenot M, Krolak-Salmon P, Isnard J, Pernier J. Simultaneous intracerebral EEG recordings of early auditory thalamic and cortical activity in human. Eur J Neurosci 2002;16:1146-50. 23. Firszt JB, Chambers RD, Kraus N, Reeder RM. Neurophysiology of
cochlear implant users: effect of stimulus current level and elec-trode site on the electrical ABR, MLR and N1-P2 response. Ear Hear 2002;23:502-15.
24. Logi F, Fischer C, Murri L, Maughiere, F. The prognostic value of evoked responses from primary somatosensory and auditory cortex in comatose patients. Clin Neurophysiol 2003;114:1615-27.
25. Cacace AT, Satya-Murti S, Wolpaw JR. Human middle-latency evoked potentials: vertex and temporal components. Electroencephalography and clinical Neurophysiology 1990;77:6-18.
26. Liégois-Chauvel C, Musolino A, Badier JM, Marquis P, Chauvel P. Evoked potentials recorded from the auditory cortex in man: evalu-ation and topography of the middle latency components. Electroen-cephalography and clinical Neurophysiology 1994;92:204-14. 27. Kraus N, Mcgee T. The middle latency response generating system.