ABSTRACT:Objective: To analyze the trend of colorectal cancer mortality adjusted for selected indicators, according to sex, by Brazilian federative units and regions, and countrywide from 1996 to 2012. Methods:
This is a temporal time series on colorectal cancer mortality rates, using linear regression analysis, in which the independent variable was the centered year. Models were adjusted for selected indicators. Results: There was an increase in standardized colorectal cancer mortality rates for males in all states and for females in 21 states. In the model adjusted for mortality rate from ill-defined causes, for gross domestic product, and for Gini coefficient, the upward trend remained statistically significant (p < 0.05) countrywide only for men, with 0.17 deaths per 100 thousand inhabitants per year (py). In the States of Piauí (0.09 and 0.20 py), Ceará (0.17 and 0.19 py) and Rio Grande do Sul (0.61 and 0.42 py), there was an increase for both men and women, respectively; only among men in the States of Paraíba (0.16 py), Espírito Santo (0.28 py), São Paulo (0.24 py) and Goiás (0.31 py); and among women in Roraima (0.41 py), Amapá (0.97 P/Y), Maranhão (0.10 py), Sergipe (0.46 P/Y), Mato Grosso do Sul (0.47 py), and the Federal District (0.69 py). Conclusion: The increase in colorectal cancer mortality remained significant when assessing Brazil as a whole only among men; in seven States among men, and in nine States among women, regardless of the studied indicators. These differences could be related to the possible increase in incidence and to late access to diagnosis and treatment.
Keywords: Colorectal neoplasms. Mortality. Mortality registries. Temporal distribution. Social inequity. Trends.
Disparities in colorectal cancer
mortality across Brazilian States
Disparidades na mortalidade de câncer colorretal nos estados brasileiros
Max Moura de OliveiraI,II, Maria do Rosário Dias de Oliveira LatorreIII, Luana Fiengo TanakaI,IV, Benedito Mauro RossiV, Maria Paula CuradoII,VI
oRiginAl ARTiCle / artigo original
IGraduate program in Public Health, Public Health School, Universidade de São Paulo – São Paulo (SP), Brazil. IIInternational Research Center, A. C. Camargo Cancer Center – São Paulo (SP), Brazil.
IIIDepartment of Epidemiology, Public Health School, Universidade de São Paulo – São Paulo (SP), Brazil. IVChair of Epidemiology, Faculty of Sport and Health Sciences, Technical University of Munich - Munich, Germany. VHospital Sírio-Libanês – São Paulo (SP), Brazil.
VIInternational Prevention Research Institute – Écully, France.
Corresponding author: Max Moura de Oliveira. Faculdade de Saúde Pública, Universidade de São Paulo. Avenida Doutor Arnaldo, 715, Cerqueira César, CEP: 01246-904, São Paulo, SP, Brasil. E-mail: max.moura@usp.br
INTRODUCTION
In 2012, the standardized incidence rate of colorectal cancer was 17.2 per 100,000 inhabi-tants worldwide with a increasing trend, especially in high-income countries and urban areas of low and middle-income countries. The standardized mortality rate was 8.3 per 100,000 inhabitants. When locations were considered, it was ranked fifth and fourth in incidence and mortality relevance, respectively, the highest rates being found among males1.
In addition to differences between countries, there were variations between rates within each country. In the United States, disparities between population groups were described, with colorectal cancer incidence 23% higher among black men and 22% higher among black women compared to white men and women, respectively2. Jemal et al.3 reported
dispari-ties in mortality when rates in southern States of the United States. Such differences were attributed to racial-ethnic, socioeconomic and geographical inequalities which reflected in access to health services for timely diagnosis and treatment2,3. In China, trends for cancer
mortality identified in urban and rural areas were distinct4.
Geographical differences in rates may be related to socioeconomic features. As for inci-dence, there is an association with unhealthy dietary habits, obesity, smoking, among oth-ers5. Concerning to mortality, it seems to stem from inequality in access to health services,
making early diagnosis and timely treatment difficult6-8. Given that in Brazil there is
evi-dence of such disparities between States9,10, our purpose was to analyze colorectal cancer
ReSUMo:Objetivo: Analisar a tendência da mortalidade por câncer colorretal, ajustado por indicadores selecionados, segundo sexo, para unidades federativas, regiões e Brasil, no período de 1996 a 2012. Métodos: Estudo ecológico de série temporal das taxas de mortalidade por câncer colorretal, feita análise de regressão linear, sendo o ano centralizado a variável independente. Os modelos foram ajustados por indicadores selecionados. Resultados: Houve aumento nas taxas de mortalidade padronizadas por câncer colorretal em todos os estados para o sexo masculino e em 21 estados para o sexo feminino. No modelo ajustado por taxa de mortalidade por causas mal definidas, produto interno bruto e coeficiente de Gini, a tendência de aumento foi significativa (p < 0,05) no Brasil, somente para os homens, com 0,17 óbitos por 100 mil habitantes ao ano (aa). Nos estados do Piauí (0,09 e 0,20 aa), Ceará (0,17 e 0,19 aa) e Rio Grande do Sul (0,61 e 0,42 aa) ocorreu aumento em homens e mulheres, respectivamente; somente em homens nos estados da Paraíba (0,16 aa), no Espírito Santo (0,28 aa), em São Paulo (0,24 aa) e Goiás (0,31 aa); e em mulheres nos estados de Roraima (0,41 aa), do Amapá (0,97 aa), Maranhão (0,10 aa), Sergipe (0,46 aa), Mato Grosso do Sul (0,47 aa) e Distrito Federal (0,69 aa). Conclusão: O aumento da taxa de mortalidade por câncer colorretal manteve-se significativo no Brasil somente entre os homens; em sete estados, entre homens; e em nove estados, entre mulheres, independentemente dos indicadores estudados. Essas diferenças podem estar relacionadas ao possível aumento da incidência e ao acesso tardio ao diagnóstico e tratamento.
mortality trends adjusted for selected indicators, according to gender, as well as for Brazilian federative units and regions, and countrywide from 1996 to 2012.
METHODS
This is an ecological study, whose units of analysis were federation units and regions of Brazil and the country as a whole, from 1996 to 2012, having the rates of mortality by colorectal cancer analyzed (malignant neoplasm of the colon – C18, rectosigmoid junc-tion – C19, and rectum – C20, as per the tenth revision of the Internajunc-tional Classificajunc-tion of Diseases – ICD-10)11.
Data were obtained from the Mortality Information System (SIM), which is publicly available on the website of the Department of Informatics of the National Health System (DATASUS), Ministry of Health, in aggregated form, without personal identification or any prejudice to individuals, in line with the National Health Council’s Resolution 466, as of December 12, 2012.
The proportional colorectal cancer mortality was calculated by dividing deaths by col-orectal cancer by the total number of other cancer deaths (Chapter II of ICD-10)11, so as to
verify ranking changes of this type compared to all cancers.
Crude and age-standardized colorectal cancer mortality rates were calculated per 100,000 inhabitants, according to region of residence, sex, for Brazil’s federation units and regions, and the country as a whole. The populations available in DATASUS were used as denominator. For standardization means, the world population proposed by Segi, and revised by Doll and Smith,12 was used. The standardized mortality rates were compared
consider-ing the percentage difference between 2012 and 1996.
In trend analysis, the standardized colorectal cancer mortality rate was considered a depen-dent variable, and the centered year (year-2004) was the independepen-dent variable. The choice of polynomial function stemmed from the scatter plots between mortality rates and the years of study. In order to check for perfect colinearity (correlation coefficient > 0.95), a correlation matrix was built. After regression analysis, the residue analysis was performed to verify the homoscedasticity assumption.
The simple linear regression model was defined as model 1 (Y = β0 + β1X1).
The models were adjusted for ill-defined mortality rate (model 2), socioeconomic indi-cators, gross domestic product (GDP) per capita and Gini coefficient (model 3), and all three indicators (model 4).
Ill-defined mortality rates (codes R00-R99, according to ICD-10)11 were calculated per
100,000 inhabitants, the denominator being the population of July 1 of each year. GDP per capita
indicates the average aggregate value per individual, at market currencies and value, relating to final goods and services produced. The Gini coefficient expresses the inequalities in per capita
A trend was considered significant when the model had p value < 0.050. Thematic maps were plotted for a full view of results and, to represent the description of the indicators, quintiles of average mortality rates and means of the period (2004) for socioeconomic indi-cators were used. The trends were adjusted for models. The analyses were performed using Microsoft Excel (version 10), Tabwin and Stata11 software.
RESULTS
In Brazil, in 1996 and 2012, there were 2,801 and 6,878 deaths by colorectal cancer among men, respectively (Table 1). This cancer accounted for 5.1% (1996) and 6.9% (2012) of all deaths by cancer in the country, ranking fifth and fourth in respective years. The standardized rates were 4.9 (1996) and 7.3 (2012) per 100,000 men all over Brazil, with the highest stan-dardized rates observed in the States of Southeast, South and Midwest regions. However, the highest percentage increases were observed in the States of the North and Northeast regions over the 16-year period of study. Among men, standardized rates increased between 1996 and 2012 in all States, except Roraima.
Among women (Table 1), there were 3,272 (1996) and 7,386 (2012) deaths by colorec-tal cancer, representing 6.9% (1996) and 8.2% (2012) of all cancer deaths in 1996 and 2012, respectively. This cause ranked fifth and third in respective years, gaining two positions in the period. Southeast, South and Midwest regions also had the highest standardized rates. All States had increase in rates, except Roraima and Amapá, with the highest variations observed in North and Northeast States.
Figure 1 shows the geographic distribution of standardized mortality rates for colorec-tal cancer, ill-defined morcolorec-tality rates, and socioeconomic indicators in 2004. For both sexes, the highest standardized mortality rates (fifth quintile) were found in States of the South and Southeast regions; and the highest (fourth and fifth quartile) average ill-defined mor-tality rates (per 100,000 inhabitants) were identified in northern and northeastern States. These regions also had the lowest quintiles of GDP per capita, as well as Gini coefficient highest quintiles (greater inequality).
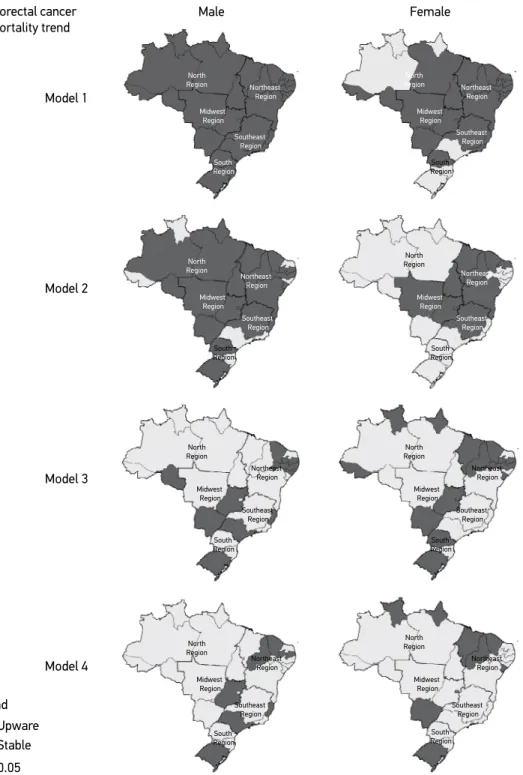
Figure 2 displays the trend analysis results. In model 1, for males, a significant increase (p<0.05) in the standardized mortality rate was observed in all States, as well as regions and countrywide, with 0.14 deaths per 100,000 inhabitants per year (py). The most rele-vant increases in mortality rate occurred in Mato Grosso do Sul (0.28 py), Espírito Santo (0.21 py), Ceará (0.21 py), Tocantins (0.20 py) and Piauí (0.20 py). As for the regions, the greatest increase was found in the Midwest region (0.19 py). Among females, the increase was statistically significant (p<0.05) in 21 States. The highest were found in Espírito Santo (0.20 py), Tocantins (0.18 py), the Federal District (0.18 py) and Goiás (0.17 py). In Brazil as a whole, the increase was 0.07 py.
Table 1. Number, proportional mortality and station, crude and standardized colorectal cancer mortality ratios, and comparison per 100,000 inhabitants according to gender. Brazilian federative units and regions, and countrywide, 1996 e 2012.
Region of residence 1996 2012 C (%)
N PM (P) CMR SMR N PM (P) CMR SMR Male
North region 39 2.4 (8) 0.7 1.3 163 3.5 (6) 2.0 2.8 115.4
Rondônia 7 3.3 (5) 1.1 2.4 17 3.3 (8) 2.1 2.7 12.5
Acre – – – – 5 1.9 (10) 1.3 1.8 –
Amazonas 8 1.9 (10) 0.7 1.3 33 3.0 (10) 1.8 2.9 123.1
Roraima 1 1.8 (7) 0.8 2.2 2 1.7 (9) 0.8 1.3 -40.9
Pará 21 3.0 (6) 0.8 1.4 75 3.8 (6) 1.9 2.7 92.9
Amapá 1 1.2 (9) 0.5 0.4 7 3.6 (5) 2.0 3.3 725.0
Tocantins 1 1.1 (8) 0.2 0.3 24 4.8 (4) 3.3 3.9 1,200.0
Northeast region 271 4.0 (6) 1.2 1.7 879 4.4 (5) 3.3 3.6 111.8
Maranhão 16 4.9 (5) 0.6 1.0 55 3.7 (6) 1.7 2.0 100.0
Piauí 10 4.9 (4) 0.8 1.0 65 5.6 (4) 4.2 4.2 320.0
Ceará 34 2.6 (8) 1.0 1.3 169 4.5 (5) 4.0 4.1 215.4
Rio Grande do Norte 22 4.2 (5) 1.8 2.2 55 3.7 (7) 3.5 3.5 59.1
Paraíba 8 2.8 (9) 0.5 0.6 56 3.3 (8) 3.0 2.8 366.7
Pernambuco 63 3.9 (6) 1.8 2.4 162 4.4 (6) 3.8 4.0 66.7
Alagoas 5 1.6 (11) 0.4 0.6 29 3.2 (8) 1.9 2.4 300.0
Sergipe 6 2.3 (10) 0.8 1.2 39 5.2 (4) 3.8 4.4 266.7
Bahia 107 5.4 (6) 1.7 2.4 249 4.9 (5) 3.6 3.8 58.3
Southeast region 1,752 5.6 (5) 5.3 6.9 3,888 8.0 (4) 9.8 9.2 33.3
Minas Gerais 231 4.1 (5) 2.8 3.6 628 5.9 (5) 6.4 5.9 63.9
Espírito Santo 43 4.3 (7) 3.1 4.4 136 6.6 (5) 7.7 7.8 77.3
Rio de Janeiro 428 6.0 (4) 6.7 7.9 881 8.9 (3) 11.4 10.1 27.8 São Paulo 1,050 6.0 (5) 6.3 8.4 2,243 8.7 (3) 8.7 10.0 19.0
South region 616 4.9 (5) 5.3 6.9 1,481 7.3 (4) 10.9 10.1 46.4
Paraná 219 5.6 (5) 4.9 6.7 506 7.4 (4) 9.7 9.3 38.8
Santa Catarina 80 3.7 (7) 3.3 4.8 297 7.0 (4) 9.4 9.8 104.2 Rio Grande do Sul 317 4.9 (5) 6.7 8.0 678 7.3 (4) 12.9 10.9 36.3
Midwest region 123 4.2 (6) 2.3 3.8 467 7.2 (4) 6.5 7.4 94.7
Mato Grosso do Sul 33 5.1 (5) 3.4 5.0 104 7.6 (5) 8.3 8.7 74.0
Mato Grosso 14 2.7 (8) 1.2 2.3 81 6.3 (4) 5.1 6.2 169.6
Goiás 48 4.1 (7) 2.1 3.2 180 6.6 (4) 5.9 6.3 96.9
Distrito Federal 28 5.0 (4) 3.2 7.1 102 9.2 (3) 8.1 11.1 56.3
Brazil 2,801 5.1 (5) 3.6 4.9 6,878 6.9 (4) 7.2 7.3 49.0
Region of residence 1996 2012 C (%) N PM (P) CMR SMR N PM (P) CMR SMR
Female
North region 66 4.2 (5) 1.2 2.3 180 4.2 (6) 2.2 3.1 34.8
Rondônia 5 3.5 (5) 0.8 2.1 21 5.1 (6) 2.7 3.7 76.2
Acre 2 3.0 (6) 0.8 1.4 5 2.4 (7) 1.3 2.0 42.9
Amazonas 12 3.0 (6) 1.0 2.2 44 3.8 (5) 2.5 3.6 63.6
Roraima 3 6.1 (4) 2.5 6.1 4 3.4 (4) 1.7 2.3 -62.3
Pará 41 5.5 (5) 1.5 2.7 84 4.5 (5) 2.2 2.9 7.4
Amapá 1 1.5 (9) 0.5 1.3 2 1.2 (8) 0.6 0.7 -46.2
Tocantins 2 2.3 (8) 0.4 0.7 20 5.1 (5) 2.9 3.3 371.4
Northeast region 359 4.8 (5) 1.6 1.9 1,107 5.5 (5) 4.0 3.5 84.2
Maranhão 11 3.1 (7) 0.4 0.6 79 4.7 (5) 2.3 2.7 350.0
Piauí 9 3.6 (8) 0.7 0.9 50 4.5 (5) 3.1 2.9 222.2
Ceará 51 3.9 (5) 1.5 1.7 226 6.1 (5) 5.1 4.3 152.9
Rio Grande do Norte 23 4.0 (6) 1.8 1.9 74 5.3 (5) 4.5 3.8 100.0
Paraíba 20 4.7 (6) 1.2 1.2 73 4.2 (6) 2.6 2.0 66.7
Pernambuco 89 4.7 (5) 2.3 2.6 221 5.8 (4) 4.8 4.0 53.8
Alagoas 12 3.6 (6) 0.9 1.4 34 3.5 (5) 2.1 2.1 50.0
Sergipe 5 1.8 (8) 0.6 0.9 36 4.5 (5) 3.3 2.9 222.2
Bahia 139 6.8 (4) 2.2 2.7 314 6.7 (4) 4.3 3.8 40.7
Southeast region 2,053 7.8 (3) 6.0 6.4 4,182 9.6 (3) 10.0 7.5 17.2
Minas Gerais 294 5.9 (4) 3.5 3.8 679 7.5 (3) 6.7 5.3 39.5
Espírito Santo 55 7.6 (4) 3.9 4.7 149 9.3 (2) 8.2 6.9 46.8
Rio de Janeiro 542 8.1 (2) 7.8 7.2 1,010 10.0 (3) 11.9 8.1 12.5
São Paulo 1,162 8.3 (2) 6.7 7.4 2,344 10.4 (2) 10.9 8.3 12.2
South region 660 6.8 (4) 5.6 6.0 1,469 8.9 (3) 10.4 7.8 30.0
Paraná 183 6.1 (5) 4.0 5.0 485 8.7 (3) 9.0 7.6 52.0
Santa Catarina 83 5.2 (5) 3.4 4.3 256 8.1 (3) 8.0 6.6 53.5
Rio Grande do Sul 394 7.8 (3) 8.1 7.3 728 9.4 (3) 10.4 8.2 12.3
Midwest region 134 5.7 (5) 2.6 4.1 448 83 (3) 6.2 6.4 56.1
Mato Grosso do Sul 30 5.6 (6) 3.1 4.3 78 7.9 (3) 6.2 6.0 39.5
Mato Grosso 14 4.3 (7) 1.3 2.3 63 6.7 (4) 4.1 4.8 108.7
Goiás 56 5.8 (5) 2.5 3.9 197 8.3 (3) 6.4 6.4 64.1
Distrito Federal 34 6.6 (3) 3.6 6.2 110 10.1 (3) 8.0 8.7 40.3
Brazil 3,272 6.9 (5) 4.1 4.8 7,386 8.2 (3) 7.5 6.2 29.2
N: number; PM: proportional mortality; P: ranking position; CMR: crude mortality rate; SMR: standardized mortality ratio; C: comparison.
AMR: average mortality rate; IDMR: ill-defined mortality rate; GDP: gross domestic product per capita. Figure 1. Distribution of indicators by quintiles. Brazilian federative units.
Mean standardized colorectal cancer mortality rate (per 100,000 inhabitants) according to gender
North Region North Region Southeast Region Southeast Region South Region South Region Northeast Region Northeast Region Midwest Region Midwest Region
Up to 2.00 Male AMR
2.00 --| 2.60 2.60 --| 3.40 3.40 --| 6.80 6.80 --| 10.30
Up to 1.90 Female AMR
1.90 --| 2.70 2.70 --| 3.60 3.60 --| 6.00 6.00 --| 8.20
A. Ill-defined mortality rate (per 100,000 inhabitants)
South Region South Region North Region North Region Southeast Region Southeast Region Northeast Region Northeast Region Midwest Region Midwest Region
Up to 46.9 Male IDMR, 2004
46.9 --| 59.5 59.5 --| 91.3 91.3 --| 132.2 132.2 --| 244.2
Up to 26.5 Female IDMR, 2004
26.5 --| 34.9 34.9 --| 54.2 54.2 --| 95.3 95.3 --| 161.0
B. Gross domestic product per capita and Gini coefficient, 2004
South Region South Region North Region North Region Southeast Region Southeast Region Northeast Region Northeast Region Midwest Region Midwest Region
Up to R$ 5,503.43 GDP per capita, 2004
R$ 5,503.42 --| R$ 6,811.70 R$ 6,811.70 --| R$ 9,623.69 R$ 9,623.69 --| R$ 13,244.29 R$ 13,244.29 --| R$ 33,719.09
Up to 0.530
Gini coefficient, 2004
Model 1: centered year; model 2: centered year adjusted for ill-defined cause (rate per 100,000 inhabitants); model 3: centered year adjusted for gross domestic product per capita and Gini coefficient; model 4: centered year adjusted for
all three indicators.
Figure 2. Colorectal cancer mortality trend according to gender. Brazilian federative units, 1996 a 2012. Male Female Colorectal cancer mortality trend Model 1 Model 2 Model 3 Model 4 Trend Stable Upware
p < 0.05
stable across all Brazil and ascendant in 10 States, with highest values in Tocantins (0.20 py), Mato Grosso (0.17 py) and the Federal District (0.18 py).
When adjusted for two socioeconomic indicators (model 3) among males, the upward trend remained significant in 10 States and not significant countrywide; among females, 14 States maintained a significant increase (p<0.05), the highest value being found in Amapá (0.78 py), the Federal District (0.63 py), Sergipe (0.51 py) and Mato Grosso (0.48 py), with a significant increase (p<0.05) in Midwest (0.41 py), South (0.32 py) and Northeast (0.11 py) regions, as well as in Brazil as a whole (0.14 py).
In model 4, adjusted for three indicators, the upward trend remained significant in the States of Piauí (0.09 and 0.20 py), Ceará (0.17 and 0.19 py) and Rio Grande do Sul (0.61 and 0.04 py) for males and females, respectively; among males, the increase was identified countrywide and in the States of Paraíba (0.16 py), Espírito Santo (0.28 py), São Paulo (0.24 aa) and Goiás (0.31 py); as for women, significant States were Roraima (0.41 py), Amapá (0.97 aa), Maranhão (0.10 py), Sergipe (0.46 py), Mato Grosso do Sul (0.47 py) and the Federal District (0.69 py); in Brazil as a whole, there was no sig-nificant increase.
DISCUSSION
Colorectal cancer has lifestyle-related risk factors, including inadequate diet, sed-entarism, smoking, and alcohol consumption; and these are habits that vary accord-ing to socioeconomic conditions4,5-7. Brazil has noticeable differences in the prevalence
of risk factors and socioeconomic conditions according to regions10. The highest
inci-dence of risk factors was found in southern and southeastern States, and the lowest in Northern and Northeastern States9,10. On the other hand, States of the South, Southeast
and Midwest regions have better socioeconomic conditions, including schooling rate,
per capita household income, and best offer of health services compared to States in the North and Northeast regions9,14.
According to estimates by the Globocan 20121, standardized mortality rates in South
America are at intermediate levels (9.4 per 100,000 men and 7.7 per 100,000 women), that is, higher than those found in Brazil (7.3 per 100,000 men and 6.2 per 100,000 women). Only the States of Rio de Janeiro, São Paulo, Rio Grande do Sul and the Federal District for both men and women, and Santa Catarina only as related to men, presented rates that were higher than that of South America.
Although this type of cancer has one of the highest mortality rates among all can-cer types1, there are different trends in colorectal cancer mortality rates across the world.
While countries in South America show an upward trend6, some European-Union
coun-tries have shown a downward trend15. Possible explanations for the decrease in rates are the
In this study, the standardized colorectal cancer mortality rates were found to have increased in all States among males and, for the most part, among females, as seen in model 1 (first stage). However, when the model was adjusted for ill-defined mortality rate, the upward trend was maintained in 20 States among males and in 10 States among females, which shows the influence of quality of information in trend analysis. Using the indicator ill-defined mortality rate as a proxy for quality of the SIM was important, as correction techniques help acquiring knowledge about an event’s actual trend, because increase can be identified simply by improving data collection20.
When using correction techniques for the distribution of ill-defined and underreported death causes in the group of the main noncommunicable diseases (NCD) — cardiovascular diseases, neoplasms, chronic respiratory diseases, and diabetes — for the period comprising 1991 through 2009, a study reported an inversion in upward trends of mortality by NCD in North and Northeast regions20. In a study that applied the same correction techniques in
2011, aiming to correct proportional mortality between NCD, a 6.3% increase in propor-tion of mortality attributed to neoplasms was estimated, with corrected-data proporpropor-tion being 30.4% and crude, 28.6%21.
Underreporting, especially in the North and Northeast regions, may have interfered in rate calculation, since the higher the ill-defined mortality rate, the lower the specific-causes mortality rates. Despite the improvement in data collection and data quality over the decades, especially with the use of active search in the regions in question, so as to correct estimates of vital statistics22, there is still a limitation regarding the use of data corrected
by under-registration, since DATASUS only provides data gathered per chapter of ICD-10. The improvement in vital statistics — in this case, colorectal cancer mortality — is essential because it allows generating information that supports the formulation of public policies in areas demanding greater investments23.
In the second step, models were adjusted by two socioeconomic indicators (GDP per capita and Gini coefficient) so as to control the effects of improvement in social conditions over the years. Comparing model 1 (centered year) and the model adjusted by social indi-cators, in some States the upward trend remained statistically significant, occurring in both states with higher GDP per capita and states that still show income inequality, especially Northeastern ones. These results show that there may be factors interfering with mortal-ity other than those studied here.
The increase in incidence would be likely explained the rise in mortality; however, this cannot be ascertained, as there are no data on incidence of cancer across all Brazil. Currently, cancer incidence is estimated based on data from SIM and Population-Based Cancer Registries across the country. These records cover data from different periods, though24.
Brazil, in the last decades, experienced major socioeconomic changes, but they did not occur evenly throughout the territory. States are at different stages in demographic, epide-miological and nutritional transition14,25, and this is one of the possible explanations for the
in the States showing the greatest reduction in socioeconomic inequality such as those in the North and Northeast regions.
The increased incidence of colorectal cancer is related to eating habits such as increased intake of meat, fat and total calories. This change in population’s diet is especially seen in more developed regions, due to the higher consumption of ultraprocessed foods that comes with the increase in income of the underprivileged populations. Other behaviors such as smoking and sedentarism also increase the risk of developing this cancer. Studies indicate that these habits are directly associated with economic development, which ends up lead-ing people to a western-like lifestyle5,26,27.
Finally, when adjusting the model for all indicators studied (last step), the upward trend remained significant in Brazil as a whole and in seven States among men; in nine States, but not all over Brazil, among women. The differences in mortality rates and upward mor-tality trends found in this study could also be related to the unequal distribution of special-ized cancer services. In a study dealing with colorectal cancer mortality in European coun-tries28, unequal access to health services was pointed out as one of the main explanations for
an upward mortality trend. In Brazil, as in Latin America, service offering is still unequal, because the infrastructure for cancer prevention, diagnosis and treatment tends to concen-trate in more developed areas28,29.
In addition to the matter of service offering organization, when it comes to prevention and early diagnosis, unlike in the United States, Brazil lacks a consensus as to the imple-mentation of screening programs aimed at these types of cancer. However, there is evi-dence that this practice reduces both incievi-dence and mortality30. The Brazilian Society of
Coloproctology and the National Cancer Institute recommend that screening be started at age 50 in low-risk individuals, through fecal occult blood screening (yearly) and sigmoid-oscopy every five years. From the age of 60 on, colonsigmoid-oscopy or barium enema is indicated every ten years31. There is no data for Brazil regarding the prevalence of exams in the target
population. The few local studies available indicate a low prevalence (<20%)32,33. Data about
the proportion of cases diagnosed according to staging are also unknown.
Brazilian initiatives such as the CNCD Coping Plan34, the Plan to Strengthen the Network
for Cancer Prevention, Diagnosis and Treatment35 and the Radiotherapy Expansion Plan,
which provides for the creation of a radiotherapy service and the expansion of existing ser-vices36, are efforts that seek to organize the network aimed at prevention, detection, timely
treatment and consequent increase in survival rates for cancer patients across the country. This subject is currently in vogue and poses a challenge, as the law that guarantees initia-tion of cancer treatment in up to 60 days after diagnosis must be obeyed37.
CONCLUSION
REFERENCES
States, among women, regardless of the indicators studied. Differences according to gender may stem from both changes in risk factors and late access to health services for diagnosis and treatment.
The differences in colorectal cancer mortality rates and the temporal evolution accord-ing to States and regions may reflect socioeconomic inequalities, which are directly related to risk factors for this type of cancer and to access to health services.
Colorectal cancer usually has favorable prognosis when diagnosed timely38,39.
The implanta-tion of the CNCD Coping Plan34, the Plan to Strengthen the Network for Cancer Prevention,
Diagnosis and Treatment35 and the Radiotherapy Expansion Plan36, in addition to the law
that guarantees the initiation of cancer treatment up to 60 days after diagnosis37, the
conse-quent reorganization and better distribution of health services may contribute to a decrease in colorectal cancer mortality rates.
1. Ferlay J, Soerjomataram I, Dikshit R, Eser S, Mathers C, Rebelo M, et al. Cancer incidence and mortality worldwide: Sources, methods and major patterns in GLOBOCAN 2012. Int J Cancer. 2015; 136(5): E359-864. https://doi.org/10.1002/ijc.29210
2. DeSantis C, Naishadham D, Jemal A. Cancer statistics for African Americans, 2013. CA Cancer J Clin. 2013; 63(3): 151-66. https://doi.org/10.3322/caac.21173 3. Jemal A, Siegel RL, Ma J, Islami F, DeSantis C, Sauer
AG, et al. Inequalities in Premature Death from Colorectal Cancer by State. J Clin Oncol. 2015. DOI: 10.1200/JCO.2014.58.7519
4. Guo P, Huang ZL, Yu P, Li K. Trends in cancer mortality in China: an update. Ann Oncol. 2012; 23(10): 2755-62. https://doi.org/10.1093/annonc/mds069
5. Bishehsari F, Mahdavinia M, Vacca M, Malekzadeh R, Mariani-Costantini R. Epidemiological transition of colorectal cancer in developing countries: Environmental factors, molecular pathways, and opportunities for prevention. World J Gastroenterol. 2014; 20(20): 6055-72. https://dx.doi.org/10.3748%2Fwjg.v20.i20.6055 6. Sierra MS, Forman D. Burden of colorectal cancer in Central and South America. Cancer Epidemiol. 2016; 44: S74-81. https://doi.org/10.1016/j.canep.2016.03.010 7. Koo JH, Leong RWL. Sex differences in epidemiological, clinical and pathological characteristics of colorectal cancer. J Gastroenterol Hepatology. 2010; 25(1): 33-42. https://doi.org/10.1111/j.1440-1746.2009.05992.x 8. Ilbawi AM, Anderson BO. Cancer in global health:
How do prevention and early detection strategies relate? Sci Translat Med. 2015; 7(278): 278cm1. DOI: 10.1126/scitranslmed.3008853
9. Instituto Brasileiro de Geografia e Estatística. Pesquisa Nacional por Amostra de Domicílios. Um panorama da saúde no Brasil: acesso e utilização dos serviços, condições de saúde e fatores de risco e proteção à saúde 2008. Rio de Janeiro: Instituto Brasileiro de Geografia e Estatística; 2010.
10. Instituto Brasileiro de Geografia e Estatística. Pesquisa Nacional de Saúde 2013: percepção do estado de saúde, estilos de vida e doenças crônicas: Brasil, grandes regiões e unidades da federação. Rio de Janeiro: Instituto Brasileiro de Geografia e Estatística; 2014. 11. Organização Mundial de Saúde. CID-10. 10ªed. São
Paulo: Editora da USP; 2009.
12. Doll R, Smith PG. Comparison between registries: Age-standardized rates. In: Waterhouse J, Muir C, Shanmugaratnam K, Powell J, Eds. Cancer Incidence in Five Continents. 1982; 4(42): 671-5.
13. Rede Interagencial de Informação para a Saúde. Indicadores básicos para a saúde no Brasil: conceitos e aplicações 2ª ed. Brasília: Organização Pan-Americana da Saúde; 2008.
14. Paim J, Travassos C, Almeida C, Bahia L, Macinko J. The Brazilian health system: history, advances, and challenges. Lancet. 2011; 377: 1778-97. https://doi. org/10.1016/S0140-6736(11)60054-8
16. Tong L, Ahn C, Symanski, Lai D, Du XL. Relative impact of earlier diagnosis and improved treatment on survival for colorectal cancer: a US database study among elderly patients. Cancer Epidemiol. 2014; 38: 733-40. https://doi.org/10.1016/j.canep.2014.10.004 17. Ciombor KK, Wu C, Goldberg RM. Recent therapeutic advances in the treatment of colorectal cancer. Annu Rev Med. 2015; 66: 83-95. https://doi.org/10.1146/ annurev-med-051513-102539
18. Bosetti C, Bertuccio P, Malvezzi M, Levi L, Chatenoud L, Negri E, et al. Cancer mortality in Europe, 2005– 2009, and an overview of trends since 1980. Ann Oncol. 2013. https://doi.org/10.1093/annonc/mdt301 19. Torre LA, Bray F, Siegel RL, Ferlay J, Lortet-Tieulent
J, Jemal A. Global cancer statistics, 2012. CA Cancer J Clin. 2015; 65: 87-108. https://doi.org/10.3322/ caac.21262
20. Duncan BB, Stevens A, Iser BPM, Malta DC, Silva GA, Schmidt MI. Mortalidade por doenças crônicas no Brasil: situação em 2009 e tendências de 1991 a 2009. In: Brasil. Ministério da Saúde. Secretaria de Vigilância em Saúde. Departamento de Análise de Situação em Saúde. Saúde Brasil 2010: uma análise da situação de saúde e de evidências selecionadas de impacto de ações de vigilância em saúde. Brasília: Ministério da Saúde; 2011.
21. Malta DC, De Moura L, Prado RR, Escalante JC, Schmidt MI, Duncan BB. Mortalidade por doenças crônicas não transmissíveis no Brasil e suas regiões, 2000 a 2011. Epidemiol Serv Saúde. 2014; 23(4): 599-608. http://dx.doi.org/10.5123/ S1679-49742014000400002
22. Szwarcwald CL, Morais Neto OL, Frias PG, Souza PRB Jr, Cortez-Escalante JJ, Lima RB, et al. Busca ativa de óbitos e nascimentos no Nordeste e na Amazônia Legal: estimação das coberturas do SIM e do SINASC nos municípios brasileiros. In: Brasil. Ministério da Saúde. Secretaria de Vigilância em Saúde. Departamento de Análise de Situação em Saúde. Saúde Brasil 2010: uma análise da situação de saúde e de evidências selecionadas de impacto de ações de vigilância em saúde. Brasília: Ministério da Saúde; 2011. p. 79-98.
23. Oliveira TCR, Latorre MRDO. Tendências da internação e da mortalidade infantil por diarréia: Brasil, 1995 a 2005. Rev Saúde Pública. 2010; 44(1): 102-11. http:// dx.doi.org/10.1590/S0034-89102010000100011 24. Instituto Nacional de Câncer José Alencar Gomes
da Silva. Coordenação de Prevenção e Vigilância Estimativa 2014: Incidência de Câncer no Brasil. Rio de Janeiro: INCA; 2014. 124 p.
25. Schimidt MI, Duncan BB, Azevedo e Silva G, Menezes AM, Monteiro CA, Barreto SM, et al. Chronic
non-communicable diseases in Brazil: burden and current challenges. Lancet. 2011; 377(9781): 1949-61. https://doi.org/10.1016/S0140-6736(11)60135-9 26. Guimarães RM, Rocha PGM, Muzi CD, Ramos
RS. Increase income and mortality of colorectal cancer in Brazil, 2001-2009. Arq Gastroenterol. 2013; 50(1): 64-9. http://dx.doi.org/10.1590/ S0004-28032013000100012
27. Cotta RMM, Machado JC. Programa Bolsa Família e segurança alimentar e nutricional no Brasil: revisão crítica da literatura. Rev Panam Salud Publica. 2013; 33(1): 54-60.
28. De Angelis R, Sant M, Coleman MP, Francisci S, Baili P, Pierannunzio D, et al. Cancer survival in Europe 1999–2007 by country and age: results of EUROCARE-5—a population-based study. Lancet Oncol. 2014; 15(1): 23-34. https://doi.org/10.1016/ S1470-2045(13)70546-1
29. Goss PE, Lee BL, Badovinac-Crnjevic T, Strasser-Weippl K, Chavarri-Guerra Y, St Louis J, et al. Planning cancer control in Latin America and the Caribbean. Lancet Oncol. 2013; 14(5): 391-436. https://doi.org/10.1016/ S1470-2045(13)70048-2
30. Grubb RL, Pinsky P, Prorok PC, Andriole GL. Screening for Cancer: Lessons Learned from the Prostate, Lung, Colorectal, and Ovarian Cancer Screening Trial. Eur Urol.2015; 68(4): 545-6. https://doi.org/10.1016/j. eururo.2015.04.026
31. Fang CB. Rastreamento do câncer colorretal. Rev Assoc Med Bras. 2002; 48(4): 286-6. http://dx.doi. org/10.1590/S0104-42302002000400020
32. Lima-Costa MF. Influência da idade e da escolaridade no uso de serviços preventivos de saúde – Inquérito de saúde da Região Metropolitana de Belo Horizonte, Minas Gerais, Brasil. Epidemiol Serv Saúde. 2004; 13(4): 209-15. http://dx.doi.org/10.5123/ S1679-49742004000400003
33. São Paulo. Secretaria Municipal da Saúde. Coordenação de Epidemiologia e Informação. Boletim ISA-Capital 2008. Inquéritos de Saúde. Exames preventivos. São Paulo: CEInfo; 2010. 28 p. n. 3.
34. Brasil. Ministério da Saúde. Plano de ações estratégicas para o enfrentamento das doenças crônicas não transmissíveis (DCNT) no Brasil, 2011-2022. Brasília: Ministério da Saúde; 2011.
36. Brasil. Ministério da Saúde. Gabinete do Ministro. Portaria nº 931 de 10 de maio de 2012: Institui o Plano de Expansão da Radioterapia no Sistema Único de Saúde (SUS). Brasília: Ministério da Saúde; 2017. 37. Brasil. Ministério da Saúde. Gabinete do Ministro.
Portaria nº 1.220 de 03 de junho de 2014: Altera o art. 3º da Portaria nº 876/GM/MS, de 16 de maio de 2013, que dispõe sobre a aplicação da Lei nº 12.732, de 22 de novembro de 2012. Brasília: Ministério da Saúde; 2012.
38. Kelsall HL, Baglietto L, Muller D, Haydon AM, English DR, Giles GG. The effect of socioeconomic status
on survival from colorectal cancer in the Melbourne Collaborative Cohort Study. Soc Sci Med. 2009; 68(2): 290-7. https://doi.org/10.1016/j.socscimed.2008.09.070 39. Ait Ouakrim D, Pizot C, Boniol M, Malvezzi M,
Boniol M, Negri E, et al. Trends in colorectal cancer mortality in Europe: retrospective analysis of the WHO mortality database. BMJ. 2015; 351: h4970. https://doi.org/10.1136/bmj.h4970
Received on: 03/29/2016
Final version presented on: 05/26/2017 Accepted on: 08/10/2017