Vol.46, n. 4 : pp. 489-498, December 2003
ISSN 1516-8913 Printed in Brazil
BRAZILIAN ARCHIVES OF
BIOLOGY AND TECHNOLOGY
A N I N T E R N A T I O N A L J O U R N A L
Evaluation of DSSAT Soil-Water Balance Module Under
Cropped and Bare Soil Conditions
Rogério Teixeira de Faria
1∗and Walter Truman Bowen
2 1Instituto Agronômico do Paraná - IAPAR; C. P. 481; 86001-970; Londrina - PR - Brazil. 2 International Fertilizer Development Center - IFDC; Headquarters Muscle Shoals; Alabama - USA
ABSTRACT
The performance of the soil water balance module (SWBM) in the models of DSSAT v3.5 was evaluated against soil moisture data measured in bare soil and dry bean plots, in Paraná, southern Brazil. Under bare soil, the SWBM showed a low performance to simulate soil moisture profiles due to inadequacies of the method used to calculate unsaturated soil water flux. Improved estimates were achieved by modifying the SWBM with the use of Darcy’s equation to simulate soil water flux as a function of soil water potential gradient between consecutive soil layers. When used to simulate water balance for the bean crop, the modified SWBM improved soil moisture estimation but underpredicted crop yield. Root water uptake data indicated that assumptions on the original method limited plant water extraction for the soil in the study area. This was corrected by replacing empirical coefficients with measured values of soil hydraulic conductivity at different depths.
Key words: Soil moisture, Dry Bean, modeling
∗ Author for correspondence
INTRODUCTION
Studies involving long-term simulation are required in central southern Brazil to assess best management practices under variable climate conditions (Faria, 1995). In the region, significant yield reductions occur due to frequent coincidence of critical growth stages with periods of low rainfall during the growing season. To quantify the yield decrease due to water deficit, a precise simulation of the soil water balance components is required, because, in general, mechanistic crop growth simulation models use transpiration as an input to calculate the indices of water stress affecting crop growth and development.
Crop establishment is also risky because short periods without rainfall, associated with high evapotranspiration, cause frequent soil water
deficit at sowing of summer and winter crops. Increased production costs and lower crop yield occur as a consequence of replanting and late sowing. Since soil temperature is not critical for seed germination in Paraná, the risk for crop establishment can best be assessed by evaluation of soil water availability through realistic simulation of the soil water balance during the planting window periods.
yield in Paraná (Faria et al., 1997a). This model was also used to evaluate irrigation strategies (Faria et al., 1997b, Heinmann et al., 2000) and regional crop water requirements (Heinmann et al., 2002). DSSAT’s maize model was applied in Brazil to identify the genetic traits and sowing dates for maize cultivars sowed at the end of the summer and at the beginning of autumn in two locations in São Paulo state (Soler et al., 2002) and to assess planting dates in two sites in Paraná State (Cardoso et al., 2001a; Cardoso et al., 2001b). Since DSSAT models were designed to be widely used with minimal input requirement, several processes are simplified, including the routines in the soil water balance module (SWBM). Assuming simulation models as a formalised collection of testable hypothesis about how environmental variations affect plant processes (Jamieson et al., 1998), the confidence on the value of a specific model is achieved if it performs accordingly to expected when used under the environmental constraints in the local of user’s interest.
This work had as an objective to test the soil water balance module of DSSAT under bare soil and vegetated conditions in a subtropical climate of southern Brazil. Modifications on the method were introduced to improve model estimates.
MATERIAL AND METHODS
The soil water balance module
The soil water balance module (SWBM) in the crop growth models of DSSAT v3.5 computes one-dimensional soil water balance of a stratified profile in a daily time step, as described by Ritchie (1998). Soil characteristics, climate parameters, and crop management practices are standard inputs to the model (IBSNAT,1990). Values of plant growth variables estimated by other modules are also input to SWBM. Water from either precipitation or irrigation infiltrates into the top layer after subtraction of runoff. Empirical procedures are used to calculate soil water flow upwards and downwards through the profile. Drainage flow is calculated by a ‘cascading’ approach, in which excess water above field capacity of a layer is passed directly to the layer below. Drainage do not occurs when soil moisture is below field capacity. A normalized soil water diffusion equation, parameterized for general soil
types of different textures, is used to simulate upwards flux.
Potential evapotranspiration and soil water availability govern evaporation from the top soil layer (0 to 5cm) and transpiration from the root zone. Potential evapotranspiration is partitioned into soil evaporation and plant transpiration, assuming that evaporation depends on the energy that reaches the soil surface and transpiration is proportional to the energy intercepted by crop canopy. Actual transpiration is the minimum between potential transpiration and total root water uptake (TRWU).
At each soil layer, root water uptake by a single root (RWU) depends on soil water availability and rooting density, according to the following relationship:
RLV
Ln
K
RWU
e−
=
01
.
7
132
(1)In which RWU is limited to a maximum value equal to 0.03cm3 of water cm-1 of root day-1 , RLV is root length density simulated daily by the growth model (cm of root cm-3 of soil), and Ke is hydraulic conductivity (cm
day-1), empirically calculated as:
(
)
[
CONSW LL]
e
e
K
=
10
−5 − (2)Where SW is actual soil moisture, LL is lower limit of soil available water (both in cm3cm-3 ), and CON is 45 for LL higher than 0.3cm3cm-3, or calculated by:
LL
CON
=
120
−
250
(3)
Root water uptake from each soil layer in the rooting zone is integrated to calculate TRWU.
Modifications on the soil water balance module In the first approach used (SWBM-D), soil water movement was calculated by the following form of Darcy’s equation:
(
) (
)
t
Z
K
K
q
i i i oi oii
∆
+
∆
Ψ
−
Ψ
−
−
=
+ +1
2
1
1 (4)
Where q is infiltrated depth in the top of the compartment i during a time step ∆t (days), ∆Z is difference between midpoint depths in adjacent soil compartments (m), Ko is unsaturated hydraulic
potential (m). Soil water balance was calculated for each soil layer in a variable time step, from 1 second during periods of wet soil (high flux), to 4 hours during periods of dry soil (low flux). For each soil layer, the values of Ko and ψ were calculated at each time step
from the soil retention and hydraulic conductivity equations, using updated values of soil moisture.
Root water uptake was estimated using Equation 1. Additional information on the algorithm used to implement the method can be found on Faria and Madramootoo (1996).
In the second approach (SWBM-D-T), soil water flow was computed according to first approach
(SWBM-D). However, Ke in Equation 2 was
replaced by Ko, which was calculated as a function
of SW from hydraulic conductivity curves fitted to field data for each soil layer.
Experimental and simulation procedures
Simulated soil moisture profiles were compared with experimental data obtained at the Experimental Station of the Instituto Agronômico do Paraná-IAPAR (latitude 22o23'S, longitude 51°11' W), in Londrina-PR, Brazil. The soil is a dark red latosol, characterized by a deep profile, good drainage, high clay and low carbon contents, and medium to low available water. The soil water retention and unsaturated hydraulic conductivity curves, fitted to field data, are shown in Fig. 1 (Faria and Madramootoo, 1996).
Figure 1 - Soil water retention and hydraulic conductivity curves for different depths of a dark red Latosol in Londrina-PR, Brazil
The model CROPGRO of DSSAT v3.5, including the two version of SWBM, was used to simulate growth and soil water balance in both bean and bare soil plots. The genetic coefficients for a
Ø in Equation 4 were obtained from the soil retention and hydraulic conductivity curves (Fig. 1). Soil moisture was measured once or twice a week in bare soil plots from March to December and in bean plots from March to June 1995. The measurements, replicated three times, were taken gravimetrically from the surface layer (0-10cm) and by a neutron probe in 15cm increments until a depth of 85cm.
RESULTS AND DISCUSSION
Simulation of bare soil condition
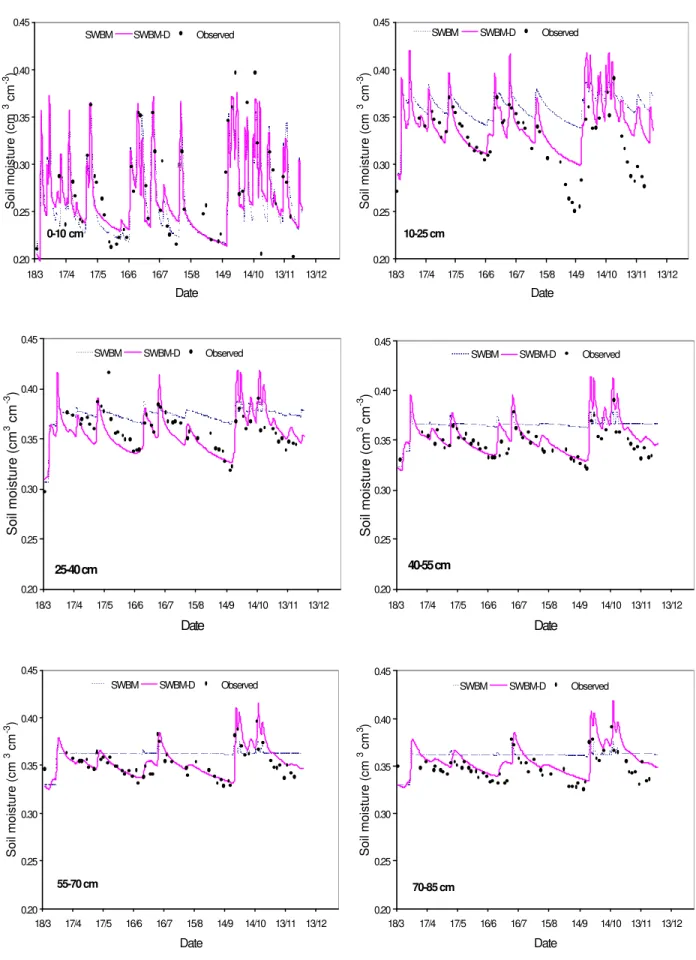
The comparison between simulated soil moisture by the original SWBM and measured data, at different depths, showed a good agreement for the top layer, but a low correspondence for the remaining depths (Fig. 2). Since the model assumed that all the water to supply evaporation came from the 0-5cm layer, simulated soil moisture followed closely observed data during the drying periods. For the intermediate layers (10 to 40cm), the model did not accurately simulate soil moisture decrease during the drying periods because it underestimated the upward flux due to evaporation. In the bottom layers (40-85cm), the SWBM underestimated drainage when soil moisture was below the field capacity. As a consequence, simulated soil moisture was constant at values close to the field capacity, differing from observed values in which soil moisture decreased during dry periods due to unsaturated downward flux.
Simulation results using the first approach (SWBM-D) showed a significant improvement on the model’s performance. The estimates of soil moisture at the six depths were in good agreement with observed data (Fig. 2). The use of Darcy’s equation to calculate soil water flux allowed the upward flux from the intermediate layers to the soil surface to be represented appropriately, resulting in good estimation of soil moisture loss through evaporation during dry periods. For the bottom layers, the modified method allowed simulation of drainage more accurately when soil water content was below field capacity. Consequently, a better representation of the variation in soil moisture during the experimental period was achieved. The SWBM-D simulated an increase in soil evaporation (7 mm) and drainage (10 mm), as compared to estimates from original method (Table 1). Since runoff was almost the
same, the SWBM-D simulated higher soil water depletion (19mm), compared to the SWBM, as a result of higher drainage and soil evaporation.
Simulation of cropped condition
The SWBM simulated high plant water extraction from the depths 0 to 40cm, as a result of the high root density estimated by the growth module of
CROPGRO. As a
consequence, soil moisture
estimates followed the pattern of the observed
data for the intermediate layers (10 to 40cm), but deviations occurred in the top layer, during dry periods, and also in the layers below 40cm, from the mid to the end of the growing season (Fig. 3). With original SWBM, the layer 0-5cm supplies all the water demanded by evaporation, in addition to part of the water extracted by the plant. The excessive soil water decrease calculated for the top layer was due to underestimation of upwards flux required to replace extracted water. For the layers below 40cm it is reasonable to expect low root density and less root water uptake. Likely for bare soil, the simulated values did not follow the variation of observed soil moisture contents in the bottom layers, because the model underestimated soil water depletion caused by unsaturated drainage during the dry periods, in May and June. Similarly to the results for bare soil, the modified version for soil water distribution (SWBM-D) showed a better performance for prediction of soil moisture in the whole profile (Fig. 3), as compared to the original SWBM. Improved estimation of descending and ascending fluxes allowed a better representation of soil moisture distribution over time and depth. The SWBM-D calculated higher upwards flux to the top layer supplying water extracted from the top layer.
Figure 2 - Observed and simulated soil moisture by the water balance module of DSSAT (SWBM) and by the modified module for calculation of soil water flux (SWBM-D), according to different depths in a bare soil.
0-10 cm
0.20 0.25 0.30 0.35 0.40 0.45
18/3 17/4 17/5 16/6 16/7 15/8 14/9 14/10 13/11 13/12
Date
Soil moisture (cm
3 cm -3)
SWBM SWBM-D Observed
F
10-25 cm
0.20 0.25 0.30 0.35 0.40 0.45
18/3 17/4 17/5 16/6 16/7 15/8 14/9 14/10 13/11 13/12
Date
Soil moisture (cm
3 cm -3 )
SWBM SWBM-D Observed
25-40 cm
0.20 0.25 0.30 0.35 0.40 0.45
18/3 17/4 17/5 16/6 16/7 15/8 14/9 14/10 13/11 13/12 Date
Soil moisture (cm
3 cm -3 )
SWBM SWBM-D Observed
40-55 cm
0.20 0.25 0.30 0.35 0.40 0.45
18/3 17/4 17/5 16/6 16/7 15/8 14/9 14/10 13/11 13/12 Date
Soil moisture (cm
3 cm -3 )
SWBM SWBM-D Observed
55-70 cm
0.20 0.25 0.30 0.35 0.40 0.45
18/3 17/4 17/5 16/6 16/7 15/8 14/9 14/10 13/11 13/12
Date
Soil moisture (cm
3 cm -3)
SWBM SWBM-D Observed
70-85 cm
0.20 0.25 0.30 0.35 0.40 0.45
18/3 17/4 17/5 16/6 16/7 15/8 14/9 14/10 13/11 13/12
Date
Soil moisture (cm
3 cm 3 )
Table 1 - Accumulated soil water balance components* (mm) simulated by the original module (SWBM) and by the modified module for soil water distribution (SWBM-D) under bare soil, during March to December 1995
Module PET Prec E D ∆S R
SWBM 1057 845 369 288 52 136
SWBM-D 1057 845 376 298 33 138
* PET is potential evapotranspiration, Prec is precipitation, E is evaporation, D is drainage, ∆S is variation in soil water storage,
and R is runoff
Table 2 - Accumulated soil water balance components* (mm) simulated by the original module (SWBM) and by the modified modules for soil water distribution (SWBM-D) and for the plant water uptake (SWBM-T), during the bean crop, from March to June
Module PET Prec I T E ET D ∆∆S R
SWBM 341 253 10 72 122 194 11 18 40
SWBM-D 341 253 10 58 109 167 39 13 44
SWBM-D-T 341 253 10 79 103 182 35 2 44
* PET is potential evapotranspiration, Prec is precipitation, I is irrigation, T is transpiration, E is evaporation, ET is
evapotranspiration, D is drainage, ∆S is variation in soil water storage and R is runoff
Underprediction of crop yield was corrected by modifying the soil water uptake algorithm in the version SWBM-D-T. Crop yield was better predicted because the new approach allowed the simulation of greater water extraction, mostly from the subsoil layers. Consequently, transpiration was similar to the calculated values by the original SWBM (Table 2). Comparing SWBM-D with SWBM-D-T, one can verify that transpiration was 21 mm higher, soil evaporation 6 mm lower, and evapotranspiration 15 mm higher with SWBM-D-T. Since runoff and drainage were similar, higher evapotranspiration resulted in lower soil water storage (∆S = 2 mm).
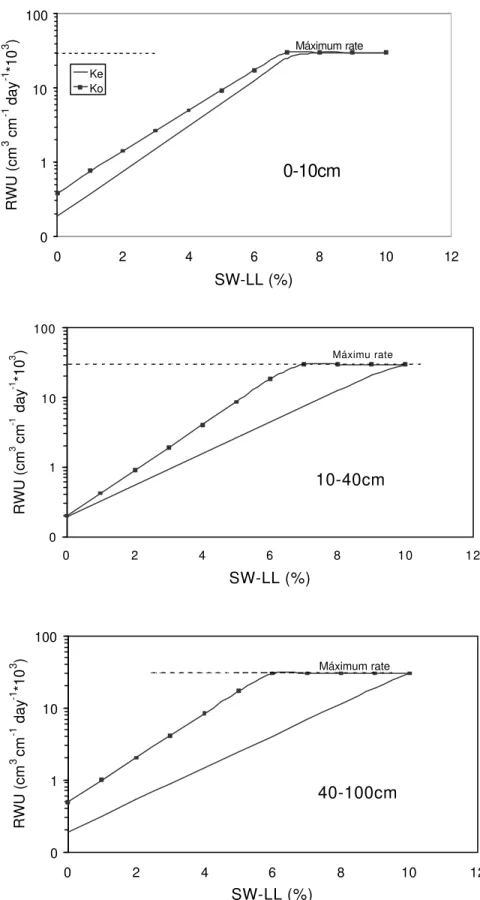
Despite the greater soil water extraction given by the SWBM-D-T, soil moisture variation during the growing season followed observed data closely (Fig. 3). SWBM-D-T calculated soil moisture for the layer 0-25 cm closer to the observed than the SWBM-D. The effect of using Ko was evident from the mid to the end of the growing season when roots extracted water deeper. Root water uptake increased and simulated soil moisture decreased during dry periods. Comparison between root water uptake (RWU) calculated with estimated hydraulic conductivity (Ke ) and with measured values (Ko ) shows that the original method underestimated RWU for the whole profile (Fig. 4). Using Ke in Equation 1, the maximum
Figure 3 - Observed and simulated soil moisture by the water balance module (SWBM) of DSSAT and by the modified modules for calculation of soil water flux (SWBM-D) and for root water uptake (SWBM-D-T), according to different depths under beans
0-10 cm
0.20 0.25 0.30 0.35 0.40 0.45
18/3 28/3 7/4 17/4 27/4 7/5 17/5 27/5 6/6 16/6 26/6 Date
Soil moisture (cm
3 cm -3 )
SWBM-D-T SWBM-D Observed SWBM
10-25 cm
0.20 0.25 0.30 0.35 0.40 0.45
18/3 28/3 7/4 17/4 27/4 7/5 17/5 27/5 6/6 16/6 26/6
Date
Soil moisture (cm
3 cm -3 )
SWBM-D-T SWBM-D Observed SWBM
25-40 cm
0.20 0.25 0.30 0.35 0.40 0.45
18/3 28/3 7/4 17/4 27/4 7/5 17/5 27/5 6/6 16/6 26/6
Date
Soil moisture (cm
3 cm -3 )
SWBM-D-T SWBM-D Observed SWBM
40-55 cm
0.20 0.25 0.30 0.35 0.40 0.45
18/3 28/3 7/4 17/4 27/4 7/5 17/5 27/5 6/6 16/6 26/6
Date
Soil moisture (cm
3 cm -3 )
SWBM-D-T SWBM-D Observed SWBM
55-70 cm
0.20 0.25 0.30 0.35 0.40 0.45
18/3 28/3 7/4 17/4 27/4 7/5 17/5 27/5 6/6 16/6 26/6
Date
Soil moisture(cm
3 cm -3 )
SWBM-D-T SWBM-D Observed SWBM
70-85 cm
0.20 0.25 0.30 0.35 0.40 0.45
18/3 28/3 7/4 17/4 27/4 7/5 17/5 27/5 6/6 16/6 26/6
Date
Soil moisture(cm
3 cm -3 )
Figure 4 - Root water uptake estimated for different depths by Equation 1 using hydraulic conductivity calculated by Equation 2 and 3 (Ke) or estimated from.
0 1 10 100
0 2 4 6 8 10 12
SW-LL (%)
RWU (cm
3 cm -1 day -1 *10 3 )
Ke Ko
0-10cm
Máximum rate
0 1 10 100
0 2 4 6 8 10 12
SW-LL (%)
RWU (cm
3 cm -1 day -1 *10 3 )
10-40cm
Máximu rate
0 1 10 100
0 2 4 6 8 10 12
SW-LL (%)
RWU (cm
3 cm -1 day -1 *10 3 )
CONCLUSIONS
The original soil water balance module of DSSAT v3.5 showed a low performance to simulate soil moisture profiles for bare and cropped soil because of inadequacies in the methods used to calculate soil water flux and root water absorption. The modification of the module with the introduction of Darcy’s equation to calculate soil water flux significantly improved soil moisture estimates. Subsequent modification by using hydraulic conductivity derived from measured data on the equation used to calculate root water uptake provided reasonable estimates of root water absorption under cropped conditions. While application of the modified module is limited because reliable soil retention and hydraulic conductivity data are difficult to obtain, the existing errors in the current module limit its application in many studies in which crop yield depends on soil water status.
RESUMO
A performance do modulo de balanço hídrico (MBH) dos modelos DSSAT v3.5 foi avaliada com dados de umidade do solo medidos em parcelas com solo nu e com cultivo de feijão, em Londrina-PR. Sob condições não vegetadas, o MBH mostrou-se baixa performance em simular a distribuição de água no perfil devido ao método inadequado utilizado para calcular o fluxo insaturado de água no solo. Melhores estimativas foram obtidas modificando-se o MBH com a utilização da equação de Darcy para simular o fluxo de água em função do gradiente de potencial de água no solo entre camadas de solo consecutivas. Quando utilizado para simular o balanço de água no solo cultivado com feijoeiro, o MBH modificado estimou valores de umidade do solo próximos dos valores medidos, porém a evapotranspiração estimada foi baixa em devido ao solo estar mais seco. Conseqüentemente, a produtividade foi subestimada. Um análise dos dados do campo (Ko) em função do índice de água do solo acima de um limite mais baixo da água disponível, método de cálculo da absorção de água pelas raízes, assumido no modelo original, mostrou que há limitação da absorção de água para o solo da área de estudo. O método foi corrigido pela substituição de valores estimados
de condutividade, calculados empiricamente, por valores de condutividade hidráulica insaturada obtidos a campo.
REFERENCES
Cardoso, C. O.; Faria, R. T. and Folegatti, M. V. (2001a), Riscos no estabelecimento e ciclo do milho safrinha semeado em diferentes épocas em Londrina, simulados com o modelo CERES-Maize. In: XII CONGRESSO BRASILEIRO DE AGROMETEOROLOGIA, 2001, Fortaleza-CE. Anais ... Sociedade Brasileira de Agrometeorologia / FUNCEME, 2, 533-534.
Cardoso, C. O.; Faria, R. T. and Folegatti, M. V. (2001b), Rendimento potencial do milho e riscos em condições de safrinha em Ponta Grossa-PR, simulados pelo modelo CERES-Maize. In: XII CONGRESSO BRASILEIRO DE AGROMETEOROLOGIA, 2001, Fortaleza-CE. Anais ... Sociedade Brasileira de Agrometeorologia / FUNCEME, 2, 535-536.
Doorenbos, J. and Kassam, A. M. (1979), Yield response to water. FAO Irrigation and Drainage Paper 33. Food Agriculture Organization of the United Nations, Rome, Italy, 139 pp.
Faria, R. T. (1995), Application of crop growth simulation models in Paraná State, Brazil. In: Thornton, P. K.; Bowen, W. T. and Wilkens, P. W. (Eds.). Applying crop models and decision support systems. International Fertilizer Development Center, Muscle Shoals, 2, 57.
Faria, R. T. and Madramootoo, C. A. (1996), Simulation of soil moisture profiles for wheat in Brazil. Agric. Water Manage. 31, 35-49.
Faria, R. T.; Oliveira, D. and Folegati, M. V. (1997a), Simulação da fenologia e produção do feijoeiro pelo modelo BEANGRO. In: X Congresso Brasileiro de Agrometerologia, 1997, Piracicaba-SP. Anais..., Piracicaba, Sociedade Brasileira de Agrometerologia, 140-142.
Faria, R. T.; Folegatti, M. V.; Frizzone, J. A. and Saad, A. M. (1997b), Determination of a long-term irrigation strategy for drybeans in Parana State-Brazil. Scientia Agricola, 54, 155-164.
Heinmann, A. B.; Hoogenboom, G.; Georgiev, G. A.; Faria, R. T. and Frizzone, J. A. (2000), Center pivot irrigation management optimization using the CROPGRO model Transactions of the ASAE, 43 : (6), 1507-1516.
IBSNAT (1990), IBSNAT progress report 1987-1990. International Benchmark Site Network for Agrotechnoly Transfer, Honolulu, USA, 54 pp. Jones, J. W.; Tsuji, G. Y.; Hoogenboom, G.; Hunt, L. A.;.
Thornton, P. K.;, Wilkens, P. W.; Iamamura, D. T.; Bowen, W. T. and Sing, U. (1998), Decision support system for agrotechnology transfer, DSSAT v3. In: Tsugi, G. Y.; Hoogenboom, G. and Thornton P. K. (Eds.). Understanding Options for Agricultural Production. Kluwer Academic Publishers, Dordrecht, pp. 157-178.
Jamieson, P. D.; Porter, J. R.; Goudriaan, J.; Ritchie, J. T.; van Keulen and H. Stol, W. (1998), A comparison of the models AFRCWHEAT2, CERES-Wheat, Sirius SUCROS2, and SWHEAT with measurements from wheat grown under drought. Field Crops Research, 55, 23-44.
Ritchie, J. T. (1998), Soil water balance and plant water stress. In: Tsugi, G. Y.; Hoogenboom, G. and Thornton P. K. (Eds.). Understanding Options for Agricultural Production. Kluwer Academic Publishers, 41-54.
Soler, C. T.; Folegatti, M. V. and Faria, R. T. (2002), Uso do modelo CERES-Maize para identificação de características genéticas desejáveis e de práticas adequadas de manejo em milho safrinha. Revista Brasileira de Agrometeorologia, 9 : (2).