Vol.50, n. 3 : pp.385-394 May 2007
ISSN 1516-8913 Printed in Brazil BRAZILIAN ARCHIVES OF
BIOLOGY AND TECHNOLOGY
A N I N T E R N A T I O N A L J O U R N A L
Adsorption of Glyphosate on Clays and Soils from Paraná
State: Effect of pH and Competitive Adsorption of
Phosphate
Lútecia Hiera da Cruz1, Henrique de Santana1, Cássia Thaïs Bussamra Vieira Zaia2 and
Dimas Augusto Morozin Zaia1*
1Departamento de Química; CCE; Universidade Estadual de Londrina; [email protected]; 86051-990; Londrina -
PR - Brasil. 2Departamento de Ciências Fisiológicas; CCB; Universidade Estadual de Londrina; 86051-990; Londrina - PR - Brasil
ABSTRACT
This work showed that the adsorption of glyphosate (GPS) depends on surface area for clays and amount of clays and CEC for soils. Organic matter (OM) had a secondary role in the adsorption of GPS on soils. The adsorption of GPS on soils from Londrina and Floraí counties and clays (montmorillonite, kaolinite) decreased when pH increased, however, for bentonite clay and soil from Tibagi county was kept constant. For the soils, the competitive adsorption between GPS and phosphate showed that displace of GPS by phosphate was related to the amount of clays, CEC and pH. GPS was not easily displaced by phosphate on the clays. The FT-IR spectra of the soils and clays showed that soil from Londrina resembled kaolinite. Thus, this could explain the results of adsorption of GPS and the competitive adsorption between GPS and phosphate.
Key words: Glyphosate, adsorption, clays, soils
*
Author for correspondence
INTRODUCTION
Paraná is an agricultural state and glyphsate (GPS) is among the most widely used herbicides (Rodrigues and Almeida, 1995). In the literature, there are several papers describing that the adsorption of GPS by soils or clays depends on cation exchange capacity (CEC) and clay content (Glass, 1987); iron and aluminum amorphous oxides and organic matter (Morillo et al., 2000); and iron and aluminum oxides (Prata et al., 2000; Gerritse et al., 1996). However, there is no agreement about the most important factors that control the adsorption of GPS. Several authors also studied the effect of pH on the adsorption of GPS by soils or clays and they agreed that an
increase of pH decreased the adsorption of GPS (Nomura and Hilton, 1977; McConnell and Hossner, 1985; Morillo et al., 2000; Sheals et al., 2002). However, Glass (1987) showed that pH had no effect on the adsorption of GPS by ilite. The studies of competitive adsorption between phosphate and GPS on minerals, clays and soils have showed that GPS could be displaced by phosphate (McBride and Kung, 1989; Dion et al., 2001; Gimsing and Boggaard, 2001). The displacement of GPS by phosphate can occur easily in some minerals such as amorphous iron oxide and goethite (McBride and Kung, 1989;
Gimsing and Boggaard, 2001), but the
of GPS by phosphate can be considered a serious problem for the farmers, because of the phytotoxicity of GPS residues (Cornish, 1992). Hence the adsorption of GPS by clays and soils as well as the competitive adsorption between GPS and phosphate depends on chemical composition of materials understudied.
In the present study, the adsorption of GPS on clays (montmorillonite, kaolinite, bentonite) and soils from several counties (Floraí, Tibagi, Londrina) of Paraná State-Brazil in different pHs (4.00-7.00) and two concentrations of CaCl2 (0.002 and 0.020 mol/L) was examined. The competitive adsorption between phosphate and GPS in these clays and soils in two different pHs was also examined and the FT-IR study of the clays and soils was also done.
MATERIALS AND METHODS
Materials
All reagents were of analytical reagent grade.
Clays
Bentonite and montmorillonite were purchased from Acros Organics-NJ, USA. Kaolinite was from LAPROM/CT-UFRGS-RS, Brazil. All the clays were used without further preparation. Bentonite: chemical composition (%): SiO2=73.0, Al2O3=14.0, Fe2O3=2.7, CaO=0.2, MgO=1.1, Na2O=0.6, K2O=1.9; surface area = 240 m2/g
(Acros Organics). Montmorillonite: chemical
composition (%): SiO2=54.0, Al2O3=17.0,
Fe2O3=5.2, CaO=1.5, MgO=2.5, Na2O=0.4,
K2O=1.5; surface area = 10 m2/g (Acros Organics). Kaolinite: chemical composition (%): SiO2=45.7, Al2O3=38.9, Fe2O3=0.3, CaO=0.1, MgO=0.1, Na2O=0.1, K2O=0.6, TiO2=0.2; surface
area = 20 m2/g (from LAPROM/CT-UFRGS).
Glyphosate
Glyphosate (GPS) 95% was gift from Milênia AgroCiência-PR, Brazil.
Soils
The soils were collected from Londrina, Tibagi and Floraí counties (Paraná State of Brazil) and were classified as eutrustose or eutrothose, entissolos and ustose or orthose, respectively. The soils were collected from 0-10 cm dept, dried in an
oven at 40°C for 24 h and crushed to pass a 2 mm sieve.
Methods
UV-Vis and infrared spectrophotometries were carried out on Shimadzu spectrophotometers UV-Vis 1203 and FT-IR-8300, respectively.
Determination of the characteristics of soils
The organic matter (OM), total nitrogen (Nt), CEC, P, Al2O3, Fe2O3, SiO2, sand, silt, clay of soils were determinated as described by standard methods (Table 1) from IAPAR (1992) and EMBRAPA (1997).
Determination of pH (water, CaCl2-0.010 mol L-1, SMP-buffer) in the clays and soils
The determination of pH of the samples (clays and soils) in water or CaCl2 and SMP-buffer were carried out as described by IAPAR (1992) and Pereira et al. (1998), respectively (Table 2).
Adsorption of glyphosate (GPS) on clays and soils in different pHs and concentration of CaCl2
For each clay or soil the following procedure was used: 310 µL aliquots of 10.065 µmol of GPS (3.247 µmol for Floraí soil) were added to two different sets of four Eppendorf tubes (1.5 mL) each. To one set of Eppendorf tubes 200 mg of clay or soil was added. To all the tubes the pH was adjusted to 4.0, 5.0, 6.0 or 7.0 with NaOH (1.0 mol L-1) or HCl (1.0 mol L-1) and volume was made up to 500 µL. For the samples with CaCl2, 10.065
µmol of GPS (3.247 µmol for Floraí soil) dissolved in 500 µL of 2.0 or 20 mmol L-1 of CaCl2 was added. All the Eppendorf tubes were tumbled for 24 h; after the pH was measured again, the tubes with clays or soils were centrifuged for 15 minutes at 2,000 r.p.m., a 25 µL aliquot was removed from each tube and transferred to a test tube. The volume in the test tube was made up to 2.0 mL with NaOH (0.010 mol L-1) and 200 µL of ninhydrin (6.0 g L-1) were added. The tubes were shaken, incubated at 100°C for 15 minutes, cooled to room temperature, and the absorbances at 560 nm were read against the blank. The amount of GPS adsorbed on clays or soils was calculated using the following equation:
GPS adsorbed (µmol)=10.065 - 10.065{Abs[sample
For the Floraí soil 3.247 was used instead 10.065, because of the small adsorption of GPS on this soil.
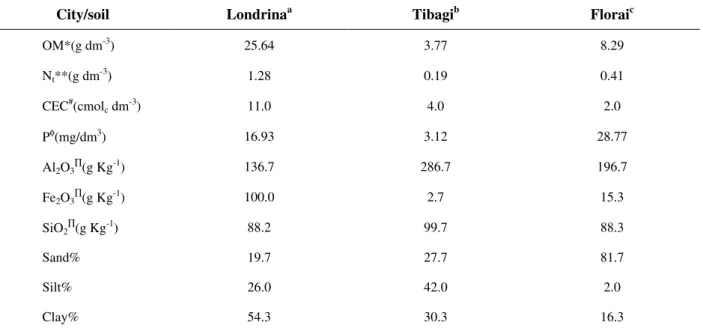
Table 1 - Characteristics of agriculture soils from three couties of Paraná State-Brazil.
City/soil Londrinaa Tibagib Floraic
OM*(g dm-3) 25.64 3.77 8.29
Nt**(g dm-3) 1.28 0.19 0.41
CEC#(cmolc dm-3) 11.0 4.0 2.0
Pφ(mg/dm3) 16.93 3.12 28.77
Al2O3∏(g Kg -1
) 136.7 286.7 196.7
Fe2O3∏(g Kg-1) 100.0 2.7 15.3
SiO2∏(g Kg-1) 88.2 99.7 88.3
Sand% 19.7 27.7 81.7
Silt% 26.0 42.0 2.0
Clay% 54.3 30.3 16.3
a
Eutrustose or eutrothose, bentissolos, custose or orthose, *organic matter (OM) from dichromate oxidation, **total nitrogen measured by the Kjeldahl method, #cation exchange capacities (CEC) were calculated by the sum up the exchangeable cations (Ca2+, Mg2+, Al3+) in KCl 1.0 mol L-1, and K+ in Mehlich solution. φP was extracted with Mehlich solution. ∏The soil samples were attacked with sulfuric acid (1:1 V/V), Al2O3 and Fe2O3 were determinated in the
sulfuric solution and SiO2 in the residue; each result is a mean of three determinations.
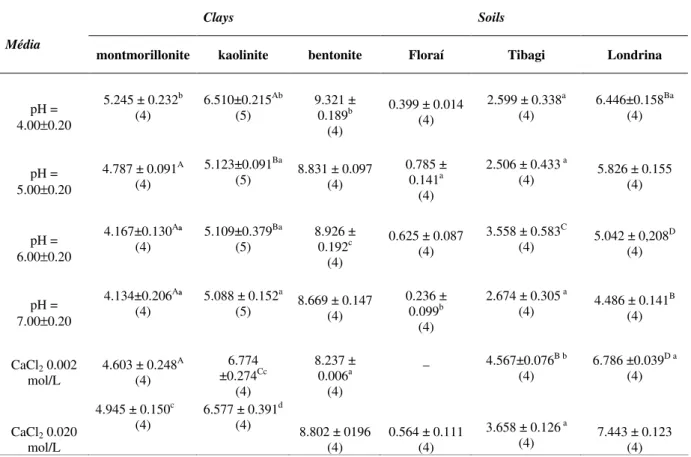
Table 2 - Determination of pH (water, CaCl2, SMP-buffer) in the clays montmorillonite, kaolinite, a nd bentonite, and in soils from Florai, Tibagi and Londrina counties of Paraná State-Brazil.
Clays Soils
pH
m k b F T L
Water 2.37 4.62 3.20 7.52 5.07 6.96
*CaCl2 1.62 3.24 2.86 6.48 3.61 6.41
#
SMP-buffer 1.56 3.93 3.21 7.11 4.31 6.54
*0.010 mol L-1 CaCl2. #SMP-buffer was prepared as described by Pereira et al. (1998). Each result is a mean of at least two determinations. m = montmorillonite; k = kaolinite; b = bentonite; F = Florai; T = Tibagi;L = Londrina.
Competitive adsorption between glyphosate (GPS) and inorganic phosphate (Na2HPO4) on clays and soils in different pHs
From 1.0 to 100 µmol inorganic phosphate
(Na2HPO4) was added to two different sets of 9 Eppendorf tubes (1.5 mL) each. 10.065 µmol of glyphosate was added to all the tubes. To one set of Eppendorf tubes, 200 mg of clay or soil was added. The pH was adjusted for each clay or soil
as followed: pH 4.00 and 6.00 for
aliquot was removed from each tube and transferred to a test tube. The analysis of GPS was carried out as described above as well as the calculation of the amount of GPS adsorbed on clays or soils.
Infrared-FT spectrophotometry of clays and soils
About 10 mg of the sample (soils or clays) plus 200 mg of KBr were weighed. They were ground with an agate mortar and pestle until a homogenized mixture was obtained and then disc pellets were prepared and the spectra from 400 to 4000 cm-1 were recorded. After, for the soils samples, the disc pellets containing soil sample were ground with an agate mortar and pestle, the mixtures were transferred to porcelain crucibles and heated for 15 minutes at 280ºC in a muffle
furnace. Then, new disc pellets were prepared and spectra were recorded again.
Statistical analysis
The ANOVA test and Student-Newman-Keuls test (S-N-K test) were used for the comparisons between means at a significance level of p<0.05.
RESULTS AND DISCUSSION
Table 3 shows the amount of glyphosate (GPS) adsorbed (µmol) on clays (montmorillonite, kaolinite, bentonite) and soils from counties of Paraná State (Floraí, Tibagi, Londrina) at different pH (4.00-7.00) and two concentrations of CaCl2 (0.002 and 0.020 mol/L).
Table 3 - Amount in µmol of glyphosate adsorbed on clays and soils of Paraná State-Brazil in several pHs and two concentrations of CaCl2.
Clays Soils
Média
montmorillonite kaolinite bentonite Floraí Tibagi Londrina
pH = 4.00±0.20
5.245 ± 0.232b (4)
6.510±0.215Ab (5)
9.321 ± 0.189b
(4)
0.399 ± 0.014 (4)
2.599 ± 0.338a (4)
6.446±0.158Ba (4)
pH = 5.00±0.20
4.787 ± 0.091A (4)
5.123±0.091Ba
(5) 8.831 ± 0.097 (4)
0.785 ± 0.141a
(4)
2.506 ± 0.433 a
(4) 5.826 ± 0.155 (4)
pH = 6.00±0.20
4.167±0.130Aª (4)
5.109±0.379Ba (5)
8.926 ± 0.192c
(4)
0.625 ± 0.087 (4)
3.558 ± 0.583C
(4) 5.042 ± 0,208
D
(4)
pH = 7.00±0.20
4.134±0.206Aª (4)
5.088 ± 0.152a
(5) 8.669 ± 0.147 (4)
0.236 ± 0.099b
(4)
2.674 ± 0.305 a
(4) 4.486 ± 0.141
B
(4)
CaCl2 0.002
mol/L
4.603 ± 0.248A (4)
6.774 ±0.274Cc
(4)
8.237 ± 0.006a
(4)
_ 4.567±0.076B b
(4)
6.786 ±0.039D a
(4)
CaCl2 0.020
mol/L
4.945 ± 0.150c (4)
6.577 ± 0.391d (4)
8.802 ± 0196 (4)
0.564 ± 0.111 (4)
3.658 ± 0.126 a
(4) 7.443 ± 0.123 (4)
The ANOVA test was used for all data. The results were statistically different (p<0.010) and F showed a range from 67.25 to 219.70 (Table 3). As shown by the S-N-K test, the amount of GPS adsorbed on the clays and soils for the most of pH and concentrations of CaCl2decreased in the following order: bentonite > kaolinite ≈ soil of Londrina > montmorillonite > soil of Tibagi > soil of Floraí (Table 3). The amount of GPS adsorbed by clays was related to surface areas of them. Among the clays used, bentonite had the highest surface area (240 m2/g) and also showed the best adsorption (Table 3). For the other two clays, the surface area
decreased from kaolinite (20 m2/g) to
montmorillonite (10 m2/g) as well as the amount of GPS adsorbed by them (table 3). For all pH in the Table 3, the straight lines relating surface areas of the clays (Y) to amount of GPS adsorbed by the clays (X) showed that the correlation coefficients were from 0.9639 to 0.9993. For CaCl2 0.002 and 0.020 mol L-1 the correlation coefficients were 0.8270 and 0.9225, respectively. However, the
concentration of Al2O3 (bentonite-14.0%,
montmorillonite-17.0%, kaolinite-38.9%) and
Fe2O3 (bentonite-2.7%, montmorillonite-5.2%, kaolinite-0.3%) in these clays as well as the SMP-buffer (Table 2) were not related to the amount of GPS adsorbed by them (Table 3).
The literature is ambiguous on the effect of type of clay on adsorption. Glass (1987) obtained a decrease in adsorption (montmorillonite > ilite >> kaolinite) and Miles and Moye (1988) obtained a different decrease in sorption (kaolinite > iron oxide >> illite > aluminium oxide > montmorillonite > bentonite). The adsorption of GPS by the Paraná State soils decreased (Londrina>Tibagi>Floraí) as shown in Table 3. For all pH and concentrations of CaCl2 (0.020 mol L-1), the straight lines relating amount of clay or CEC of the soils (Y) to amount of GPS adsorbed by the soils (X) showed that the correlation coefficients were from 0.9434 to 0.9999 and from 0.87915 to 0.9917, respectively (Table 3). The correlation coefficients for the straight lines relating Nt or OM amounts (Table 1) and GPS adsorbed by the soils (Table 3) were from 0.6194 to 0.8605 and 0.6155 to 0.8548, respectively. However, the concentration (Table 1) of Al2O3, Fe2O3, and P in these soils as well as the SMP-buffer (Table 2) were not related to the amount of GPS adsorbed by soils (Table 3). Hence, CEC and
the amount of clays played the main role in the amount of GPS adsorbed by the soils, and also Nt and OM were important for the adsorption of GPS. Glass (1987) studied the adsorption of GPS in three soils (Houston clay loam, Muskingum silt loam, Sassagras sandy loam) and showed that the adsorption of GPS by the soil was related to the clay content and CEC. By the other hand, Morillo et al. (2000) showed that adsorption of the other three different soils (Ultic Haploxeralf, Alfic Dystric Eutrochrepts, Podosol) were not related to CEC and clays content, but to the content of iron and aluminum amorphous oxides and OM. Prata et al. (2000) also showed that the adsorption of GPS by different soils (Rhodic Kandiudalf, Anionic Acrudox, Typic Humaquept) was related to iron and aluminum oxides content, and OM played a secondary role. Gerritse et al. (1996) studied sandy soils and showed the adsorption GPS strongly increased with iron and aluminum content of soils, but decreased with an increase in soil organic carbon content. These disagreement about the parameters were probably because of the differences of chemical composition of these soils. The ANOVA test was used for all columns from Table 3; the results were statistically different (p<0.015) and F showed a range from 4.48 to 57.20. An increase in pH showed a decreased in the amount of GPS adsorbed on montmorillonite, kaolinite and soil from Londrina (Table 3). The S-N-K test showed that the amount of GPS adsorbed was statistically different (p<0.05) for the followings pH: 4.00/6.00 and 4.00/7.00 for
montmorillonite; 4.00/5.00, 4.00/6.00 and
4.00/7.00 for kaolinite; and all values of pH for soil from Londrina (Table 3). For the Floraí soil, an increase in pH from 4.00 to 5.00 increased the amount of GPS adsorbed; from pH 5.00 to 6.00 it kept constant and at pH 7.00 a decrease was obtained. The S-N-K test showed that the amount of GPS adsorbed on it was statistically different (p<0.05) for the pH 5.00 and 7.00 (Table 3). McConnell and Hossner (1985) using kaolinite, hematite and goethite and Sheals et al. (2002) using goethite also showed that the adsorption of GPS were dependent on the pH GPS/clay system. Nomura and Hilton (1977) and Morillo et al.
in a decrease in the adsorption. For the bentonite and Tibagi soil (Table 3), the variation of pH did not change the amount of GPS adsorbed by them (p>0.05, S-N-K test). Glass (1987) also concluded that GPS adsorption on illite was independent of pH. Hence, the effect of pH on the adsorption of GPS in clays or soils was very dependent of the composition of these materials. As shown by S-N-K test (p<0.05) the variation of the concentration of CaCl2 had an effect only on Tibagi and Londrina soils (Table 3). Gimsing and Borggaard (2001) studied the effect of several electrolytes (KCl 10 mmol L-1 or 100 mmol L-1, CaCl2 10 mmol L-1) on the adsorption of GPS on goethite and they showed that electrolytes had little effect on GPS adsorption.
For all clays and Tibagi and Londrina soils, the S-N-K test also showed that the amount of GPS
adsorbed by them in different pH and
concentrations of CaCl2 were statistically different (p<0.05) from each other (Table 3). The
competitive adsorption between GPS and
phosphate by clays (montmorillonite, kaolinite, bentonite) and soils from Paraná State (Floraí, Tibagi, Londrina counties) in two different pH was studied. For all clays and soils the ratios of phosphate (µmol)/GPS (µmol) were from 0.0 to 10.0.
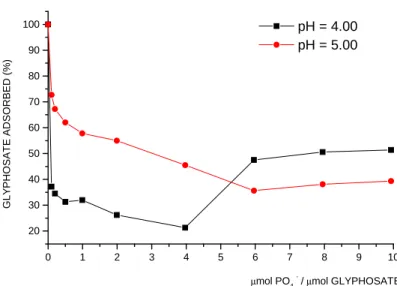
Fig. 1 shows percentage of GPS adsorbed by kaolinite in different ratios of phosphate (µmol)/GPS (µmol) and pH. In the two pH studied (4.00 and 5.00), at the ratio of 1.0 of phosphate/GPS, the amounts of GPS adsorbed on kaolinite were 30 and 60%, respectively (Fig. 1). An increase in the ratio of phosphate/GPS from 5.0 to 10.0 at pH 4.00 and 5.00 showed that the amounts of GPS adsorbed on kaolinite were constant and about 50 and 40%, respectively (Fig. 1). For the bentonite, in both pH (4.00 and 7.00) at the ratio 1.0 of phosphate/GPS, the GPS adsorbed was about 95% (data not shown). The amounts of GPS adsorbed by bentonite decreased until the ratio of phosphate/GPS was 5.0. From the ratios of 5.0 to 10.0 of phosphate/glyphosate, the amount of GPS adsorbed by bentonite remained constant (77% for pH 4.00; 72% for pH 7.00) (data not shown). The percentage of GPS adsorbed by montmorillonite in ratio 1.0 of phosphate/GPS at pH 4.00 was about 80%. The amount of GPS adsorbed decreased in the ratios from 1.0 to 5.0 of
phosphate/GPS and after that remained constant at 65% (data not shown). On the other hand, at pH 6.00 even the ratio of 10.0 of phosphate/GPS did not change the amount of GPS adsorbed by montmorillonite in which it remained about 100% (data not shown).
Mcbride and Kung (1989), Gimsing and Boggaard (2001) and Dion et al. (2001) studied the
competitive adsorption between GPS and
phosphate on amorphous iron oxide, goethite and clays (illite, kaolinite), respectively. Gimsing and Borggaard (2001) observed that phosphate was able to desorb GPS, but GPS was unable to desorb phosphate. McBride and Kung (1989) showed that GPS was completely displaced from an amorphous iron oxide by phosphate. Dion et al. (2001) showed that for clays (illite, Kaolinite) there was preference to GPS by surface sites; however, GPS is displaced by the effect of the concentration of phosphate. Present results were in accord with those from Dion et al. (2001) because GPS was displaced by phosphate on kaolinite or bentonite or montmorillonite when the ratios of phosphate/GPS were increased. It should be pointed out even ratio of 10.0 of phosphate/GPS was not able to displace GPS on montmorillonite at pH 6.00, and for the other clays only about 50 and 30% were displaced from kaolinite and bentonite, respectively. This strong binding of GPS to the clays could be attributed to three groups (amine, carboxylate, phosphonate) of GPS that could strongly coordinate with the metal ions (Subramaniam and Hoggard, 1988; Dideriksen and Stip, 2004). Fig. 2 shows the percentage of GPS adsorbed by the soil from Londrina in different ratios of phosphate (µmol)/GPS (µmol) and two pH (4.00 and 7.00). At the ratio of 1.0 of phosphate/GPS, for both pHs (4.00, 7.00), the amount of GPS adsorbed on soil from Londrina was about 70% (Fig. 2). For the pH 4.00, even ratio of 10.0 of phosphate/GPS did not significantly change the amount of GPS adsorbed on the soil from Londrina, which remained constant at about 70% (Fig. 2). For the pH 7.00, until ratio of 4.0 of phosphate/GPS, a small decrease the amount adsorbed by soil was observed, after which it remained constant at about 50% (Fig. 2).
Figure 1 - Effect of different ratios of phosphate (µmol)/glyphosate (µmol) on the adsorption of glyphosate on kaolinite in pH 4.00 and 5.00. The amount of glyphosate adsorbed without phosphate was taken as 100%.
Figure 2 - Effect of different ratios of phosphate (µmol)/glyphosate (µmol) on the adsorption of glyphosate on soil from Londrina in pH 4.00 and 7.00. The amount of glyphosate adsorbed without phosphate was taken as 100%.
The adsorption of GPS on soil from Tibagi in different ratios of phosphate/GPS, at pHs 4.00 and 7.00, was also studied (data not shown). At lower ratios of phosphate/GPS, pH 7.00, a sharp decrease of the amount adsorbed by soil from
Tibagi was observed, but at ratios
(phosphate/GPS) bigger than 1.00 a small decreased was observed, and at ratios bigger than 4.00, the amount of GPS adsorbed remained constant at 20% (data not shown). For the pH 4.00
0 1 2 3 4 5 6 7 8 9 10
20 30 40 50 60 70 80 90
100 pH = 4.00
pH = 5.00
G
L
Y
P
H
O
S
A
T
E
A
D
S
O
R
B
E
D
(
%
)
µmol PO4
/ µmol GLYPHOSATE
0 1 2 3 4 5 6 7 8 9 10
30 40 50 60 70 80 90 100 110
pH = 4.00 pH = 7.00
G
L
Y
P
H
O
S
A
T
E
A
D
S
O
R
B
E
D
(
%
)
(soil from Tibagi), a constant decrease in the amount of GPS adsorbed was observed, which reached 45% at the ratio of 10.0 of phosphate/GPS (data no shown). In the presence of ratios bigger than 0.2 of phosphate/GPS at pH 4.00 and 7.00, the soil from Floraí was unable to adsorb GPS (data not shown).
The results of competitive adsorption between GPS and phosphate in the soils (Londrina, Tibagi, Floraí) showed that GPS was displaced by phosphate as followed: Londrina > Tibagi > Floraí. For these soils, it should be pointed out that the amount of clays (Table 1) and CEC (Table 1) followed the same order.
Dion et al. (2001) also studied the competitive adsorption between GPS and phosphate in three soils (illitic Palouse silt loam, unmapped weathered Kaolinite soil obtained from a roaduct in Latah County-Idaho, and Sharpsburg silty clay loam). They observed the same results those with the clays, but there was preference to GPS by surface sites. Present results were in accord with those of Dion et al. (2001) because, in soils with high content of clays, the GPS was not easily displaced by phosphate even in the ratio of 10.0 of phosphate/GPS as shown by soil from Londrina (Fig. 2) and soil from Tibagi (data not shown). However, the GPS was easily displaced by phosphate in the soil from Floraí, whose content of clays was low (Table 1). The desorption of GPS by phosphate could be the cause of serious problems for the farmers, because of the phytotoxicity of GPS residues, as showed by Cornish (1992) for the tomato transplants. In the present study of the competitive adsorption between GPS and phosphate in soils, it was also observed that the amount of GPS adsorbed by the soils decreased when pH was increased. This could be attributed to an increase in negative charge of the surface of soils and GPS, that
weakened the interaction between them
(McConnell and Hossner, 1985; Sheals et al., 2002).
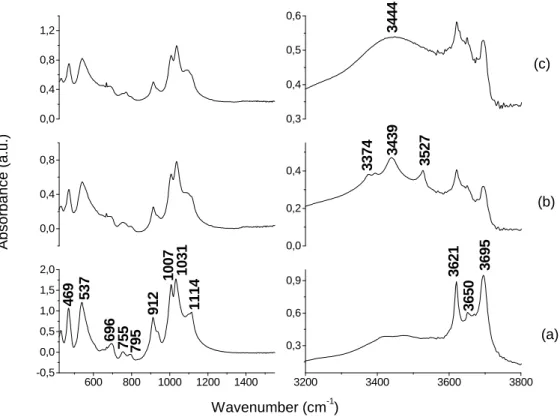
Fig. 3 shows the FT-IR spectra of the kaolinite (3a), soil from Londrina (3b) without heating, and soil from Londrina (3c) after heating at 280ºC for 15 minutes. For the sample of kaolinite, the FT-IR spectrum at lower frequencies showed bands at 469, 537, 696, 755, 795, 912, 1007, 1031 and 1114 cm-1 (Fig. 3a), which were the same bands observed in the spectra of soil of Londrina (Fig. 3b and 3c). The FT-IR spectra of kaolinite (Fig. 3a) and soil from Londrina heated at 280ºC (Fig. 3c) at
higher frequencies showed bands at 3621, 3650 and 3695 cm-1, which were attributed to OH stretching (Kristóf et al., 1997). However, the soil from Londrina without heating (Fig. 3b), besides those bands, showed others at 3374, 3439 and 3527 cm-1. After heating the soil, instead of these bands that could be attributed to OM of the soil because they disappeared with heating a broad band at 3444 cm-1 was observed (Fig. 3c). This was characteristic of O-H stretching of water in KBr solid. Benites et al. (1999) studied the thermal decomposition of OM and showed that aliphatic molecules, amine, and phenolic groups were decomposed at 280ºC. Then, those bands (3374, 3439, 3527 cm-1) could be attributed to amine groups, since this soil showed the highest concentration of total nitrogen (Table 1). The FT-IR spectra of soils from Floraí and Tibagi at higher frequencies showed the following bands: 3621, 3650, 3697 and 3620, 3650, 3668, 3695. But they did not have bands that could be attributed to OM, probably due to lower amount of OM in these soils (Table 1). At lower frequencies, the FT-IR spectra of these soils (Floraí and Tibagi) had several bands that appeared in the spectrum of kaolinite however they were not the same spectra (data not shown). The FT-IR spectra of other clays (bentonite, montmorillonite) studied herein did not resemble these soils (data not shown). The FT-IR spectra of soil of Londrina (Fig. 3b and 3c) resembled the spectrum of kaolinite (Fig. 3a), which probably this explained why the GPS was adsorbed by kaolinite and by the soil of Londrina in the same amount (Table 3), kaolinite and soil of Londrina showed almost the same results in the competitive adsorption between GPS and phosphate (Figs. 1 and 2).
CONCLUSION
on clays (montmorillonite, kaolinite) occurred when pH was increased. For the soils, the study of
competitive adsorption between GPS and
phosphate showed that displacing of GPS by phosphate was related to the amount of clays, CEC and pH. The displacement of GPS by phosphate could be a cause of serious problems for the farmers, because of the phytotoxicity of GPS residues. For the soils, an increase of pH also increased the desorption of GPS by phosphate, probably because of the weaker of interaction between GPS and soils due to an increased
negative charge on them. GPS was not easily displaced by the phosphate on the clays. The strong binding of GPS to the clays could be attributed to three groups (amine, carboxylate, phosphonate) of GPS that could strongly coordinate with the metal ions of clays. The FT-IR spectra of the soils and clays showed that soil from Londrina, resembled kaolinite which explained almost the same results of adsorption of GPS on them as well as the competitive adsorption between GPS and phosphate.
0,0 0,4 0,8 1,2
A
b
s
o
rb
a
n
c
e
(
a
.u
.)
0,3 0,4 0,5 0,6
3
3
7
4
0,0 0,4 0,8
0,0 0,2 0,4
3
4
4
4
3
4
3
9
3
5
2
7
600 800 1000 1200 1400
-0,5 0,0 0,5 1,0 1,5 2,0
7
9
5
7
5
5
1
0
0
7
1
0
3
1
1
1
1
4
9
1
2
6
9
6
5
3
7
4
6
9
Wavenumber (cm-1)
3200 3400 3600 3800
0,3 0,6
0,9 3
6
2
1
3
6
5
0
3
6
9
5
(c)
(b)
(a)
Figure 3 - FT-IR spectra without heating: kaolinite (a), soil from Londrina (b), and FT-IR spectra of soil from Londrina heated at 280°C for 15 minutes (c).
ACKNOWLEDGEMENTS
The authors are much indebted to Dr. Paulo A. Fioretto from Laborsolo for analysis of the soils, Dr. Carlos H. Sampaio of LAPROM/CT-UFRGS for the gift of kaolinite, Milenia Agrociência for the gift of GPS, and Dr. Nelson Tagima from Departamento de GeoCiências-CCE, UEL, for the classification of soils. Lutécia Hiera da Cruz was recipient of a fellowship from CNPq. This research was
supported by grants from Capes/PROAP and CNPq (nº 470087/01-3).
RESUMO
solos. A adsorção de GPS sobre os solos de Londrina e Florai e argilas (montimorilonita, caulinita) diminui com o aumento do pH e manteve-se constante para a bentonita e o solo de Tibagi. Para os solos estudados, a adsorção competitiva entre GPS e fosfato mostrou que o deslocamento do GPS pelo fosfato depende da quantidade de argilas, CTC e pH. O GPS não foi facilmente desorvido das argilas pelo fosfato. Os espectros IV-FT dos solos e argilas mostraram que o solo de Londrina e a caulinita são muito semelhantes. Portanto, isto poderia explicar os resultados de adsorção do GPS e da adsorção competitiva entre o GPS e o fosfato apresentarem resultados semelhantes.
REFERENCES
Acros Organics, Products Specifications, Retrieved December 12, 2003 from World Wide Web: http://www.across.be
Benites, V. M.; Mendonça, E. S.; Schaefer, C. E. R.; Martin Neto, L. (1999), Caracterização dos ácidos húmicos extraídos de um latossolo vermelho amarelo e de um podzol por análise termodiferencial e pela espectroscopia no infravermelho. R. Bras. Ci. Solo, 23, 543-551. Cornish, P. S. (1992), Glyphosate residues in a sandy
soil affect tomato transplants. Austr. J. Exp. Agr.
32, 395-399.
Dideriksen, K.; Stipp, S. L. S. (2003), The adsorption of glyphosate and phosphate to goethite: a molecular-scale atomic force microscopy study. Geochimica et Cosmochimica Acta Geochim. Cosmochim. Acta18, 3313-3327.
Dion, H. M.; Harsh, J. B.; Hill Jr., H. H. (2001), Competitive sorption between glyphosate and inorganic phosphate on clay minerals and low organic matter soils. J. Radioanal. Nucl. Chem.
249, 385-390.
EMBRAPA Manual de métodos de análises do solo, 2nd edition, EMBRAPA, Rio deJaneiro, RJ, Brazil, 1997.
Gerritse, R. G.; Beltran, J.; Hernadez, F. (1996), Adsorption of atrazine, simazine, and Glyphosate in soils of the Gnangara Mound, Western Australia.
Austr.J. Soil Res.34, 599-607.
Gimsing, A. L.; Borggaard, O. K. (2001), Effect of KCl and CaCl2 as background electrolytes on the competitive adsorption of Glyphosate and phosphate on goethite. Clays and Clay Min. 49, 270-275.
Glass, R. L. (1987), Adsorption of glyphosate by soils and clay minerals. J. Agric. Food Chem. 35, 497-500.
IAPAR Manual de análise química do solo e controle de qualidade, IAPAR, Londrina, PR, Brazil, 1992. Kristóf, J.; Frost, R. L.; Felinger, A.; Mink, J. (1997),
FTIR spectroscopic study of intercalated Kaolinite.
J. Mol. Struc.410-411, 119-122.
McBride, M.; Kung, K. H. (1989), Complexation of glyphosate and related ligands with iron (III). J. Soil Sci. Soc. Am. 53, 1668-1673.
McConnell, J. S.; Hossner, L. R. (1985), pH-Dependent adsorption isotherms of Glyphosate. J. Agric. Food Chem.33, 1075-1078.
Milles, C. J.; Moye, H. A. (1988), Extraction of glyphosate herbicide from soil and clay minerals and determination of residues in soils. J. Agric. Food Chem.36, 486-491.
Morillo, E.; Undabeytia, T.; Maqueda, C.; Ramos A. (2000), Glyphosate adsorption on soils of different characteristics. Influence of copper addition.
Chemosphere40, 103-107.
Nomura, N. S.; Hilton, H. W. (1977), The adsorption and degradation of glyphosate in five Hawaiian sugarcane SoilsWeed Res.17, 113-121.
Pereira, M. G.; Valladares, G. S.; Souza, J. M. P. F.; Pérez, D. V.; dos Anjos, L. H. C. (1998), Estimation of potential acidity by pH SMP method in soils from Rio de Janeiro state, Brazil. R. Bras. Ci. Solo22, 159-162.
Prata, F.; Lavorenti, A.; Regitano, J. B.; Torniselo, V. L. (2000), Influence of organic matter in sorption and desorption of Glyphosate in soils with different mineralogical attributes. R. Bras. Ci. Solo24, 947-951.
Rodrigues, B. N.; Almeida, F. S. Guia de Herbicidas, Instituto Agronômico do Paraná, Londrina-PR, Brazil, 1995, pp.675.
Sheals, J.; Sjöberg, S.; Persson, P. (2002), Adsorption of Glyphosate on goethite: molecular caracterization of surface complexes. Environ. Sci. Techn. 36, 3090-3095.
Subramaniam, V.; Hoggard, P. E. (1988), Metal complexes of glyphosate. J. Agric. Food Chem.36,
1326-1329.