JORGE PAZ-FERREIRO (2*); EVA VIDAL VÁZQUEZ (2); SIDNEY ROSA VIEIRA(3)
ABSTRACT
The application of geostatistics to data obtained from geochemical prospecting process can provide useful information for evaluating mineralization potential. The objective of this study was to evaluate the spatial distribution of Au, As and Sb contents over a large area of the Coruña province, Spain. A geochemical survey was carried out from which a data set with 323 samples was collected. Macroelements and trace elements were determined by routine analytical techniques. The spatial variability was assessed using semivariogram and cross-semivariogram as well as indicator cross-semivariogram analysis. Frequency distributions of the studied elements
departed from normal, as indicated by skewness and kurtosis coefficients. Coefficients of variation ranked as follows: Sb < As < Au. Significant correlation coefficients between Au, Sb and As were found, even though the
correlation values were low. Spherical models with nugget effects ranging from 50% (As) to 57.8% (Au) were
fitted to the experimental semivariograms. Cross semivariograms of Au versus Sb and As showed smaller nugget
variance than individual semivariograms. Indicator semivariograms were calculated taken mean, median, and different percentiles as threshold values. Ordinary kriging, cokriging, and indicator kriging were performed to
generate geochemical maps. The method has succeeded in effectively extracting useful information, and improving
the analysis of the metallogenic and ore-controlling factors, thereby playing an important role in qualitative and quantitative predictions.
Key words: geochemical survey, geostatistics, kriging, indicator kriging, cokriging.
RESUMO
ANÁLISES GEOESTATíSTICAS DE UMA SéRIE DE DADOS GEOQUíMICOS
A aplicação da geoestatística para o tratamento de dados de prospecção pode proporcionar informações úteis para a avaliação do potencial de mineralização. O objetivo deste estudo foi avaliar a distribuição espacial dos conteúdos de Au, As e Sb sobre uma grande área da província de Coruña, Espanha. Foi efetuada uma prospeção geoquímica obtendo-se um conjunto de 323 amostras. Determinou-se o conteúdo de macroelementos e elementos traço, por técnicas de análises de rotina. A variabilidade espacial foi avaliada mediante semivariogramas ordinários, semivariogramas cruzados
e semivariogramas indicadores. Os coeficientes de assimetria e curtose, permitiram comprovar que as distribuições de frequência estudadas não se ajustam a uma distribuição normal. Os coeficientes de variação aumentam na ordem: Sb < As < Au. Foram observados coeficientes de correlação significativos entre Au, Sb e As, aínda que baixos. Foram ajustados modelos esféricos aos semivariogramas cujos
valores de efeito pepita variaram entre 50% (As) e 57,8% (Au). Os semivariogramas cruzados de Au versus Sb e As proporcionaram menores efeitos pepita do que os semivariogramas individuais. Calcularam-se semivariogramas indicadores tomando média, mediana e distintos percentis, como referência. Foram obtidos mapas geoquímicos usando krigagem, krigagem indicatriz e cokrigagem para
delimitar as anomalias geoquímicas. Os métodos empregados permitiram extrair informações de forma eficiente e melhorar análise dos fatores que controlam a mineralização e contribuindo assim para
predições qualitativas e quantitativas.
Palavras-chave: prospeçao geoquímica, geoestatística, krigagem, krigagem indicatriz, cokrigagem.
(1) Received for publication in September 15, 2008 and accepted in May 10, 2010.
(2) Facultad de Ciencias. Universidade da Coruña. Campus A Zapateira. C.P. 15071, A Coruña, Spain. E-mail: [email protected] (*) Corresponding author. [email protected]
1. INTRODUCTION
A geochemical study in mining exploration consists of two particular stages. The first involves
collecting and analyzing various types of geological materials, such as soils, stream sediments and rocks. The second step, concerns the treatment and interpretation of available numerical information by plotting the geochemical values on maps, and interpretation of the results. After discovery of the mineral deposit, geochemical sampling plays a key role in the delineation of the mineralization process. Sometimes mineralization
can be extremely subtle, if not impossible to recognize
in hand specimen. Without the use of geochemical sampling methods, many known ore deposits would probably not have been discovered. Historically these methods have been some of the most productive among
any other methods used in mineral exploration.
The collected materials may be analyzed for any number of elements. Which elements are chosen for analysis depends on budget, the geology of the area, and the commodity which is being sought. Often there are
specific elements or suites of elements which are known to be associated with specific types of mineralization.
Therefore it is possible to evaluate the potential for
the existence of certain types of mineralization by
evaluating which elements are associated in a given
area. The specific features of geochemical exploration
studies are the treatment of a huge amount of data, the imprecision of this data, the multivariate character, and especially, the spatial dependence of variables. This latter characteristic gives these variables their regionalized behavior (Journeland HuiJbregts, 1978), as the basis of geostatistical methods.
Geostatistical interpolation (kriging) provides the best linear unbiased prediction for spatially dependent properties (Journel and HuiJbregts, 1978; Vieira et al., 1997). Kriging has been frequently used for the spatial interpolation of mineral deposits (sousa, 1989; Jiménez espinosa and CHiCa olmo, 1999; reis et
al., 2003; 2004). However, the great variability on ore
concentration in conjunction with sparse sampling may mask the spatial dependence (Journel, 1983). An important problem associated with the analysis of the geochemical information is the presence of
skewed distributions with high coefficient of variation.
Another problem is that values below detection
limit are grouped at detection limit. Experimental semivariograms become extremely sensitive to high
and low values, and may be practically useless in some cases. In these situations, two traditional solutions are
proposed: (i) trim off the extreme values, based on
geological or probabilistic criteria; or, (ii) transform the data by means of a smoothing function or the natural
logarithms. The first approach is very simplistic
and not acceptable when these data carry the most valuable structural information, not to mention their economic weight. Log-transformations are non-linear, and that calls for non-linear estimation techniques (i.e., disjunctive kriging), which require a hypothesis about the distribution. The lognormal kriging estimator
provides an approximately unbiased estimator, but error estimations are often exaggerated and it only
works well when the transformed data are a Gaussian random function. Although logarithmic transformation is one approach which has been frequently used for highly skewed data (Cambardella et al., 1994; Van meirVenne et al., 1996), real data sets, unfortunately may not meet the severe requirements for using this technique.
The indicator transformation is also an alternative for dealing with the data, which have a positively
skewed distribution with a few extreme values.
This method can transform any data set having an asymmetric distribution into the normal scores, which have a standard normal distribution. Then, the kriging estimation can be performed in the normal-scored space (gooVaerts, 1997; CHilèsand delfiner, 1999).
Multi element surveys are routinely performed owing to the fact that geochemical variables are
frequently associated with each other. Significant
correlations between variables allow joint estimation of values by corregionalization. Therefore, if large nugget effect happens for individual semivariograms, cokriging may be a method of analysis particularly useful (CHilès and delfiner, 1999; Vieira, 2000).
The west of La Coruña province, Galicia (NW Spain) is an area of mining interest because of the presence of Au mineralization (porter and ÁlVarez
morÁn, 1992). After geochemical exploration surveys,
Au data presents significant problems for numerical
treatment. Arsenic has been used to evaluate the metallogenetic importance of this zone. In other
words, As can be considered a pathfinder of Au in
this zone, as the two are genetically related (Jiménez espinosaand CHiCa olmo, 1999). The objective of this study was to evaluate the spatial distribution of Au, As and Sb contents over a large area of the Coruña province, Spain.
2. MATERIAL AND METHODS
Sampling and analysis
to arsenopyrite (porter and ÁlVarez morÁn, 1992). A large number of elements (e.g. As, Sb, Bi, Pb. Cu, Ag, Cd, Se and Te) are enriched in Au bearing deposits.
Geologically this area is located in the Iberian
Massif and more specifically in the Galicia Tras os Montes
Zone. Concerning the local geology, the study area comprises predominantly acid rocks, mainly alkaline and calcalkaline granites, gneiss and migmatites. The
most significant structural feature of this zone is the presence of a mylonitic band, with an approximate
NE-SW orientation.
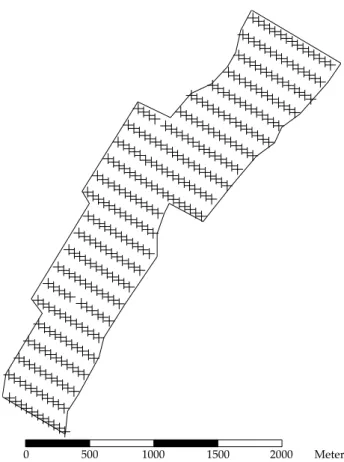
The data set comprises 323 samples taken below the A horizon at the 30-40 cm depth, as it is traditionally done in geochemical surveys within the temperate climatic zone. Therefore, samples were collected preferentially in the B horizon. Occasionally, in places where the B horizon was not present, samples were collected in the BC or C horizon. Samples were taken in a rectilinear grid at equal distances of 40 m and along evenly spaced lines of 70 m (Figure 1). The lines were perpendicular to the NE-SW trending tectonic structures.
Samples were air dried and sieved. Eighteen chemical elements were analyzed for each sample,
generating a data matrix of 323 rows and 18 columns.
0 500 1000 1500 2000 Meters
Figure 1. Sampling scheme for the study data set with 323 points.
The sample digestion method depended on the element being targeted. Aqua regia was used for Au and Ag,
while a hydrofluoric-perchloric (HF-HClO4) acid attack was performed for As, Sb and Se. For the remaining
elements a hydrofluoric-perchloric-nitric (HF-HClO4 -N03H) digestion was used (leComteand sondag, 1980; reiset al., 2004). For this study Au was analyzed and also As and Sb were retained because these two elements are considered the most useful indicators of the presence
of gold, usually referred to as pathfinder elements.
Gold was analyzed by Inductively-coupled Plasma-Atomic Emission Spectroscopy (ICP-AS). The analytical equipment was atomic absorption spectrometry-hybride generation for As and Sb. The detection limit was 5 ppm for As and Sb and 2 ppm for Au.
Statistical and Geostatistical analysis
The preliminary analysis was performed by calculation of the main statistical moments (mean,
minimum value, maximum value, standard deviation, coefficient of variation, skewness and kurtosis). The linear correlation coefficient between Au, As and Sb also
was calculated.
The spatial variability was assessed using semivariogram and cross-semivariogram analysis and maps obtained with kriging and cokriging estimation (Vieira, 2000). Semivariograms were calculated using the equation,
2
(1)
where γ*(h) is experimental semivariance, N(h) is
the number pairs of values Z(xi), Z(xi+h) separated by a distance h.
Experimental semivariograms were fitted by
theoretical models. The initial selection was made on the basis of visual observation followed by an automatic (least-squares) estimation of semivariogram parameters,
until the fitted model becomes theoretically consistent.
Cross-validation was used to assess the precision of the interpolation method (Vieira, 2000).
Cross-semivariograms were analysed for the
pairs of variables which showed significant correlation.
Calculations were performed by means of the equation,
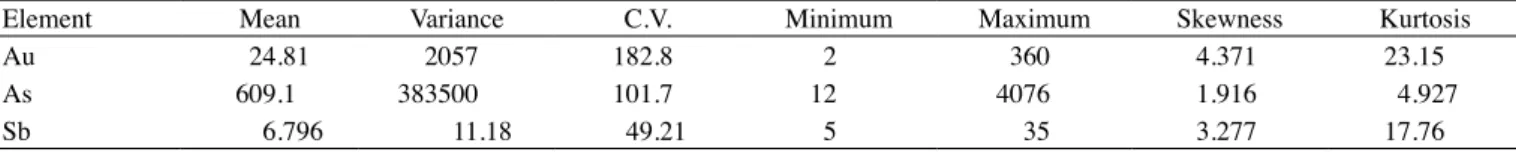
Element Mean Variance C.V. Minimum Maximum Skewness Kurtosis
Au 24.81 2057 182.8 2 360 4.371 23.15
As 609.1 383500 101.7 12 4076 1.916 4.927
Sb 6.796 11.18 49.21 5 35 3.277 17.76
Table 1. Summary statistics of the variables studied
The indicator kriging is a nonparametric distribution free estimation method. It is based on the transformation of raw data as a function of an indicator. It results on a new data set consisting of only “zeros” and “ones”, namely indicator variables, after the establishment of a series of cut-offs, zk, of the continuous function z(xi). Therefore, the indicator function is defined as a step function of z:
(3)
The kriging and the cokriging techniques were used to estimate the values for unsampled points with minimum variance and the indicator kriging allows estimating probabilities of occurrence of the studied element above a threshold (Vieira, 2000). Maps of spatial variability were constructed using the software SURFER 7.0 (golden software, 1999).
3. RESULTS AND DISCUSSION
Table 1 shows a statistical summary for Au, As and Sb. Frequency distributions of these three elements considering the percentage of samples per class is presented in Figure 2.
Concentrations of Au, As and Sb, showed an important amount of variability and all three were
strongly positive skewed, as a few extreme values appear
in the data set. Moreover, most of the Au and Sb samples showed very low values that lie close to the detection
limit. Coefficients of variation were 182.8, 101.7 and 49.2 for Au, As and Sb, respectively. This results in difficulties
in the application of current geostatistical techniques.
Gold concentration range was between the
detection limit, 2 ppm, and a maximum of 360 ppm. Similarly, Sb ranged from 5 to 35 ppm. Arsenic exhibits
higher mean values than Au and Sb, with a range of concentrations between 12 and 4076 ppm. Arsenic
can be considered as a pathfinder of Au, therefore it can be considered appropriate at a first sight as a
secondary variable in the geostatistical analysis of Au.
However in our study case the correlation coefficients
between Au and As was low (R2=0.10), even though it is was significant (P<0.05) allowing corregionalization.
Jiménez espinosaand CHiCa olmo (1999) found a higher
correlation coefficient (R2=0.76) between Au and As in a neighboring deposit of the study mining district.
Correlation coefficient between Au and Sb was a little
higher (R2=0.14), but the linear dependence between these elements also was weak. Both As and Sb were
used as auxiliary variables for geoestatistical analysis.
The patterns of spatial variability for Au, As and Sb were assessed by semivariogram, indicator semivariograms and cross-semivariogram analysis.
Figure 3 shows the experimental semivariograms together with models fitted to them and Table 2 lists
parameters of these models. Semivariograms could
be fitted quite well over the spatial scale of interest by
spherical models with a nugget and a spatial component. The nugget effect was rather high with values of the dependence ratio, C0/(C0+C1), of 55.97 % for Au, 50 % for As and 55.44 % for Sb, which indicate moderate spatial dependence (Cambardellaet al., 1994). Therefore
at small distances the three studied elements exhibits
a rather low degree of continuity and the patterns of spatial variability at this scale is not very different. The range of spatial dependence was between 271.9 m (Au) and 515.4 m (Sb).
The individual semivariograms for Au, As and
Sb could be fitted quite well. For example, regression coefficients (R2) between experimental and modelled data points were 0.996, 0.994 and 0.996 for Au, As and
Sb, respectively. The goodness of fit was evidenced by
the commonly used parameters of cross-validation, such as mean error and root mean square error (data not shown).
Scatter plots of the three studied elements show
that locally extreme values are surrounded by much
smaller ones. In this situation, there will be huge spatial variation among observations over a short
distance, and the fitted semivariogram model usually
has a large nugget effect. The large nugget effect means the variable is not very regular and is discontinuous from point to point. The higher is the nugget effect, the lower the spatial dependence. Kriging estimations
using semivariograms with large nugget effect exhibit
high kriging estimation errors and as the nugget effect increases and approaches pure nugget effect any map generated by using the kriging process will not be very meaningful.
Table 2. Fitted semivariogram models with their parameters
Element Model C0 C1 C0/(C0+C1) a (m) r2
Au Spherical 1305.13 1026.75 55.97 271.9 0.996
As Spherical 200000 200000 50.00 463.0 0.994
Sb Spherical 6.83 5.49 55.44 515.4 0.996
0.00 0.10 0.20 0.30 0.40 0.50
1 2 3 4 5 6 7 8 9 10 11 12
Au conce ntration (mg kg-1)
R
e
la
ti
v
e
f
r
e
que
n
c
y
5 10 20 30 40 50 60 70 80 90 100 360
a)
0.00 0.05 0.10 0.15 0.20 0.25 0.30
1 2 3 4 5 6 7 8 9 10 11 12
As concentration (mg kg-1)
R
e
la
ti
ve
f
r
e
qu
e
n
c
y
100 200 300 400 500 600 700 800 900 1000 1500 4076
b)
0.0 0.1 0.2 0.3 0.4 0.5 0.6 0.7
1 2 3 4 5 6 7 8 9 10 11 12
S b concentration (mg kg-1)
R
e
lati
ve
f
r
e
que
n
c
y
5 6 7 8 9 10 11 12 13 14 15 >15
c)
0 500 1000 1500 2000 2500 3000
0 200 400 600 800
S e m iv a ri a n c e Distance, (m) (a) Sph(1305,1027,272) 0 100000 200000 300000 400000 500000
0 100 200 300 400 500 600 700 800
S e m iv a ri a n c e Distance, (m) (b) Sph(200000,200000,463) 0 2 4 6 8 10 12 14 16
0 100 200 300 400 500 600 700 800
S e m iv a ri a n c e Distance, (m) (c) Sph(6.8,5.5,515)
Figure 3. Experimental semivariograms and fitted models for Au (a), As (b) and Sb(c).
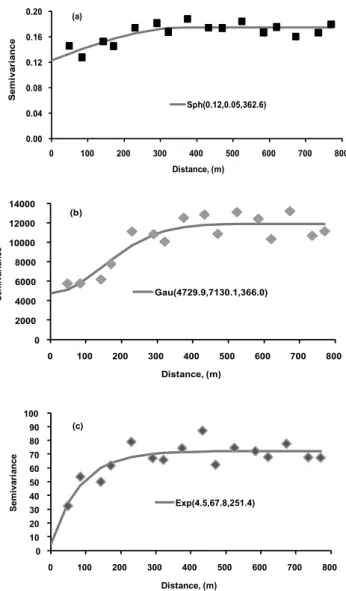
obtained with the 75th percentile. Figure 4 shows the indicator semivariogram for Au (IAu75) using this cut-off. Semivariogram IAu75 was best fitted by a spherical model with a range of 362.6 m (Table 3). However the nugget effect of this indicator semivariogram (70.28% of the sill value) was even higher than those of the semivariogram of the raw data sets (55.97% of the sill value). Semivariogram ISb75 was also fitted by a spherical model and in this case the nugget effect was somewhat lower, 41.21% of the sill value.
Patterns of spatial variability revealed by the indicator semivariograms of the three studied elements were rather close to those of individual semivariograms obtained from the raw data sets. Thus, both individual and indicator semivariograms of Au, As and Sb show
that continuity patterns at small distances are not very different, suggesting a high spatial variation at small distances.
Common practice has shown that cross semivariograms present smaller nugget variance than individual direct semivariograms (Vieira et al., 1997; paz gonzÁlez et al., 2001). In order to investigate if coregionalisation could improve the description of spatial continuity and reduce the estimation errors of the kriging variance, cross-semivariograms for Au versus As and Au versus Sb were constructed. Figure 4 shows these
experimental cross semivariograms with corresponding fitted models and the respective parameters are listed in Table 4. The cross semivariogram Au x As was best fitted by a gaussian model with a dependence ratio of
0.00 0.04 0.08 0.12 0.16 0.20
0 100 200 300 400 500 600 700 800
S e m iv a ri a n c e Distance, (m) (a) Sph(0.12,0.05,362.6) 0 2000 4000 6000 8000 10000 12000 14000
0 100 200 300 400 500 600 700 800
S e m iv a ri a n c e Distance, (m) (b) Gau(4729.9,7130.1,366.0) 0 10 20 30 40 50 60 70 80 90 100
0 100 200 300 400 500 600 700 800
S e m iv a ri a n c e Distance, (m) (c) Exp(4.5,67.8,251.4)
Figure 4. Experimental indicator semivariogram and fitted
39.88% and a range of 366 m. The cross semivariogram
Au x Sb was best fitted by an exponential model with
only 2.61% dependence ratio and a range of 251.3 m. Thus, the reduction in the value of the nugget variance was higher in the case of Au versus Sb than in the case of Au versus As.
Therefore, cokriging clearly improved the spatial continuity at small distances. Because the nugget
variances in the cross semivariograms were significantly reduced, mainly in the case of Au x Sb, this nugget value
perhaps better describes laboratory analytical errors rather than variability occurring within the shortest sampling interval (paz gonzÁlez et al., 2001). This is consistent with the fact that analytical values below detection limit are grouped at detection limit.
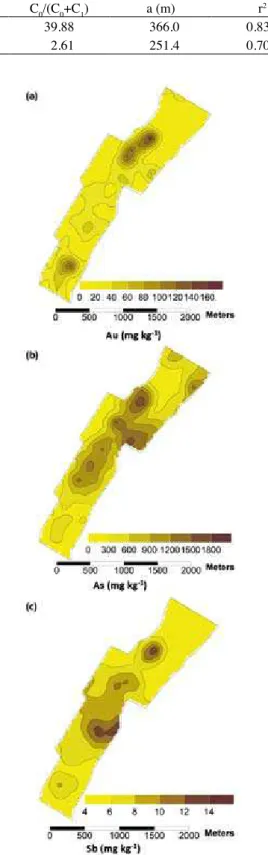
Once spatial continuity was modeled, ordinary kriging, indicator kriging and cokriging were performed to generate geochemical maps. Kriging
maps for Au, As and Sb are shown in figure 5. Gold
distribution is characterized by two mineralization
zones within the study area where maximum values
occur. These zones are well delineated and they are located near the top and near the bottom of the contour
map in figure 5. However, kriging contour maps
also show that there is not a total correspondence
between areas with maximum values of Au, As and
Sb. Actually, the micro-region on the bottom of the Au kriging map (Figure 5) does not appear in the kriging maps for As and Sb. The similitudes in the
micro region with maximum values near the top of
the map in Au, As and Sb, are more conspicuous. Thus the three kriging maps also show clear differences, suggesting variability in the mineralization processes of Au, As and Sb at the study scale. Because processes inducing spatial variation during mineralization are superimposed, the individual effect of factors affecting the distribution of Au, As and Sb is not always evident.
Indicator kriging also was used as an alternative in analyzing and interpreting geochemical data. Au map obtained by indicator kriging is shown in Figure 6. Contour kriging maps clearly delineate the two zones with Au mineralization within the study area.
Table 3. Fitted indicator semivariogram models with their parameters
Variable Model C0 C1 C0/(C0+C1) a (m) r2
I Au 75th percentile Spherical 0.123 0.052 70.28 362.6 0.996
I Sb 75th percentile Spherical 0.068 0.097 41.21 500.0 0.995
Variables Model C0 C1 C0/(C0+C1) a (m) r2
Au vs As Gaussian 4729.9 7130.1 39.88 366.0 0.836
Au vs Sb Exponential 4.5 67.8 2.61 251.4 0.708
Table 4. Fitted cross-semivariogram models with their parameters
Figure 6. Indicator Kriging map of Au.
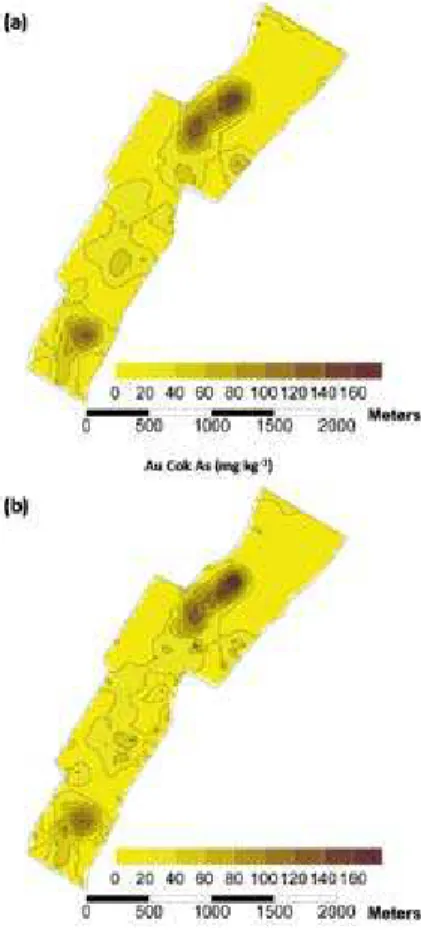
Figure 7. Cokriging maps of Au vs. As (a) and Au vs. Sb (b). Next, kriging and cokriging maps for Au are
compared, in order to test the possible advantages in using coregionalization for estimation purposes. Figure 7 shows the maps of Au estimations obtained with cokriging using both As and Sb as the secondary variable. Basically, kriging (Figure 5) and cokiging maps (Figure 7) for Au present the same results, with a little more detail on the cokriged map, owing to the contribution of the variability of As or Sb, and in spite
of the low correlation coefficient of the concentration
of Au with these two elements. Thus, cokriging and ordinary kriging estimations were somewhat alike. The limited improvement obtained by cokriging is related with the smaller nugget effect of cross-semivariograms when compared with individual semivariograms.
Semivariogram analysis and kriging maps illustrate possible environmental processes operating within the plot and allowed inferences to be made about factors controlling the spatial distribution of Au, As and Sb. Kriging maps provide additional evidence that different processes controls the contents of Au, As and Sb within the study area. Therefore, the geostatistical approach has demonstrated to be a highly effective method to separate the studied plot into homogeneous small zones characterized by similitude and differences in the mineralization processes.
4. CONCLUSIONS
1. Au, As and Sb are not normally distributed owing to their mineralization processes for high values and the analytical detection limit for low values.
2. Semivariogram, cross-semivariogram and indicator semivariogram analysis were equivalent for the spatial variability assessment all with high nugget effect
values reflecting the nature of the spatial continuity.
3. Kriging, cokriging and indicator kriging were equivalent for mapping Au, As and Sb variability and to identify micro regions with distinct values for all of the study variables. A combination of both ordinary and indicator kriging seem to be the ideal for delineating geochemical anomalies.
REFERENCES
CHILéS, J.P.; DELFINER, P. Geostatistics. Modeling Spatial Uncertainty. Wiley Series in Probability and Statistics. John Wiley, 1999. 720p.
CAMBARDELLA, C.A.; MOORMAN, T.B.; NOVAK, J.M., PARKIN; T.B.; KARLEN, D.L.; TURCO, R.F.; KONOPKA, A.E. Field-scale variability of soil properties in central Iowa soils. Soil Science Society of America Journal, v.58, p. 1501-1511, 1994.
GOLDEN SOFTWARE. Surfer plotting software information brochure. Golden. CO. USA, 1999. 619p.
GOOVAERTS, P. Geostatistics for natural resources evaluation. Oxford: Oxford University Press, 1997. 483p. (Applied Geostatistics Series)
Finisterre-Fervenza region, NW Spain. Applied Geochemistry v. 14, p.133-145, 1999.
JOURNEL, A.G. Nonparametric estimation of spatial distributions. Mathematical Geology. v.15, p.445-468, 1983.
JOURNEL, A.G.; HUIJBREGTS, J. Mining Geostatistics. London: Academic Press, New York, San Francisco, 1978. 600p.
LECOMTE, P.; SONDAG, F. Regional geochemical reconnaissance in the Belgian Ardennes, secondary dispersion patterns in stream sediments. Mineral Deposits, v.15, p. 47-60, 1980.
PAZ GONZÁLEZ, A.; TABOADA CASTRO, M.T.; VIEIRA, S.R. Geostatistical analysis of heavy metals in a one-hectare plot under natural vegetation in a serpentine area. Canadian Journal of Soil Science, v.81, p.469-479, 2001.
PORTER, D.; ÁLVAREZ MORÁN, B. Mineralizaciones de oro del Noroeste de España. In: GARCíA GUíNEA, J.; MARTíNEZ FRíAS, J. (Ed.). Recursos minerales de España, (Colección
Textos Universitarios no. XV): CSIC Publication Services,
1992. p.849-860.
REIS, A.P.; SOUSA, A.J; CARDOSO FONSECA, E. Application of geostatistical methods in gold geochemical anomalies
identification (Montemos-O-Novo, Portugal). Journal of Geochemical Exploration, v.77, p.45-63, 2003.
REIS, A.P.; SOUSA, A.J.; FERREIRA DA SILVA, E.; PATINHA, C.; FONSECA, E.C. Combining multiple correspondence analysis with factorial kriging analysis for geochemical mapping of the gold-silver deposit at Marrancos (Portugal). Applied Geochemistry, v.19, p.623-631, 2004.
SOUSA, A.J. Geostatistical data analysis-an application to ore body typology. In: Geostatistics, v. 2, p. 851-860, 1989.
Van MEIRVENNE, M., PANNIER, J., HOFMAN, G.; LOUWAGIE, G. Regional characterization of the long-term change in soil organic carbon under intensive agricultura. Soil Use and Management, v.12, p.86-94. 1996.
VIEIRA, S.R.; NIELSEN, D.R.; BIGGAR, J.W.; TILLOTSON, P.H. The scaling of semivariograms and the kriging estimation. Revista Brasileira de Ciência do Solo, v.21, p.523-533. 1997.